| Param | Original file | Final file |
|---|---|---|
| Filename | modeM0/AS1A12_018T01_9000005386_38460cztM0_level2.fits | modeM0/AS1A12_018T01_9000005386_38460cztM0_level2_quad_clean.evt |
| Size (bytes) | 378,498,240 | 93,559,680 |
| Size | 361.0 MB | 89.2 MB |
| Events in quadrant A | 2,947,575 | 657,734 |
| Events in quadrant B | 3,733,864 | 638,417 |
| Events in quadrant C | 2,578,016 | 617,372 |
| Events in quadrant D | 4,344,983 | 553,576 |
| Mode SS | |||
|---|---|---|---|
| Quadrant | BADHDUFLAG | Total packets | Discarded packets |
| A | 0 | 106 | 0 |
| B | 0 | 106 | 0 |
| C | 0 | 106 | 0 |
| D | 0 | 106 | 0 |
| Mode M9 | |||
|---|---|---|---|
| Quadrant | BADHDUFLAG | Total packets | Discarded packets |
| A | 0 | 19 | 0 |
| B | 0 | 19 | 0 |
| C | 0 | 19 | 0 |
| D | 0 | 19 | 0 |
| Mode M0 | |||
|---|---|---|---|
| Quadrant | BADHDUFLAG | Total packets | Discarded packets |
| A | 0 | 11878 | 3 |
| B | 0 | 14554 | 2 |
| C | 0 | 10834 | 2 |
| D | 0 | 16415 | 2 |
| Quadrant | Total seconds | Saturated seconds | Saturation percentage |
|---|---|---|---|
| A | 5226 | 29 | 0.554918% |
| B | 5226 | 292 | 5.587447% |
| C | 5226 | 7 | 0.133946% |
| D | 5226 | 291 | 5.568312% |
Noise dominated data is calculated using 1-second bins in cleaned event files. If a bin has >2000 counts, and if more than 50% of those come from <1% of pixels, then it is considered to be noise-dominated and hence unusable.
| Quadrant | # 1 sec bins | Bins with >0 counts | Bins with >2000 counts | High rate bins dominated by noise | Noise dominated (total time) | Noise dominated (detector-on time) | Marked lightcurve |
|---|---|---|---|---|---|---|---|
| A | 7138 | 5227 | 21 | 21 | 0.29% | 0.40% | 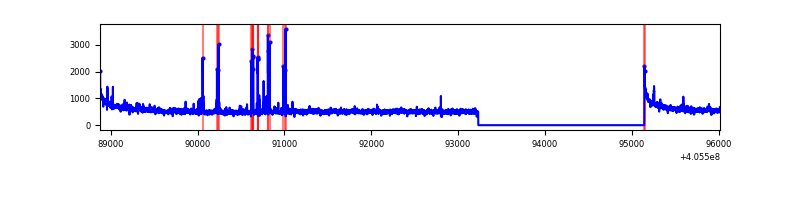 |
| B | 7138 | 5227 | 210 | 210 | 2.94% | 4.02% | 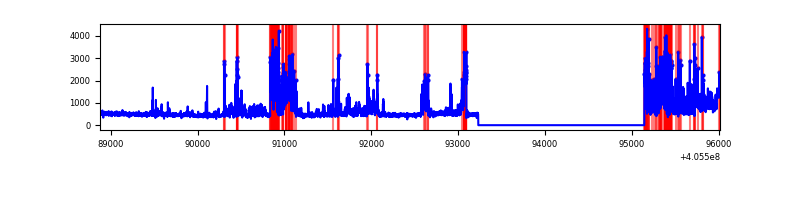 |
| C | 7138 | 5227 | 4 | 4 | 0.06% | 0.08% | 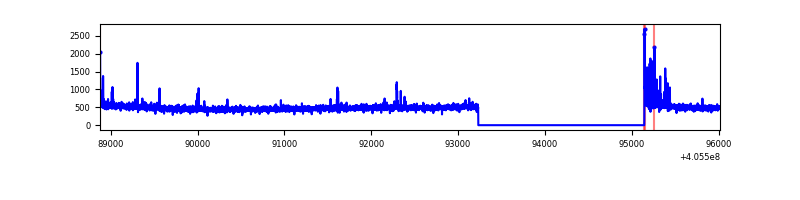 |
| D | 7138 | 5227 | 289 | 289 | 4.05% | 5.53% | 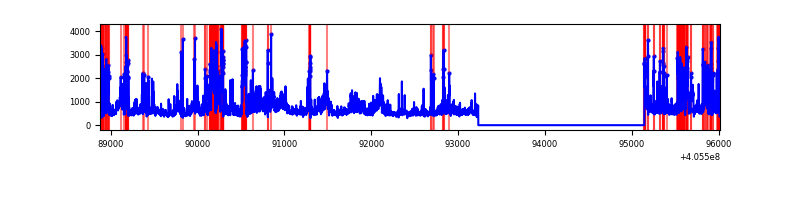 |
Top three noisy pixels from each quadrant. If the there are fewer than three noisy pixels in the level2.evt file, extra rows are filled as -1
| Pixel properties | Quadrant properties | ||||||
|---|---|---|---|---|---|---|---|
| Quadrant | DetID | PixID | Counts | Sigma | Mean | Median | Sigma |
| A | 10 | 83 | 389834 | 3186.25 | 610 | 598 | 122.2 |
| A | 13 | 248 | 85570 | 695.57 | 610 | 598 | 122.2 |
| A | 12 | 189 | 42638 | 344.13 | 610 | 598 | 122.2 |
| B | 5 | 184 | 1154887 | 10328.49 | 589 | 576 | 111.8 |
| B | 0 | 183 | 122233 | 1088.56 | 589 | 576 | 111.8 |
| B | 4 | 232 | 78364 | 696.03 | 589 | 576 | 111.8 |
| C | 15 | 214 | 221377 | 1663.96 | 579 | 583 | 132.7 |
| C | 14 | 254 | 53633 | 399.8 | 579 | 583 | 132.7 |
| C | 0 | 10 | 13916 | 100.48 | 579 | 583 | 132.7 |
| D | 12 | 235 | 983377 | 7161.42 | 577 | 561 | 137.2 |
| D | 12 | 227 | 388637 | 2827.77 | 577 | 561 | 137.2 |
| D | 7 | 38 | 217692 | 1582.15 | 577 | 561 | 137.2 |
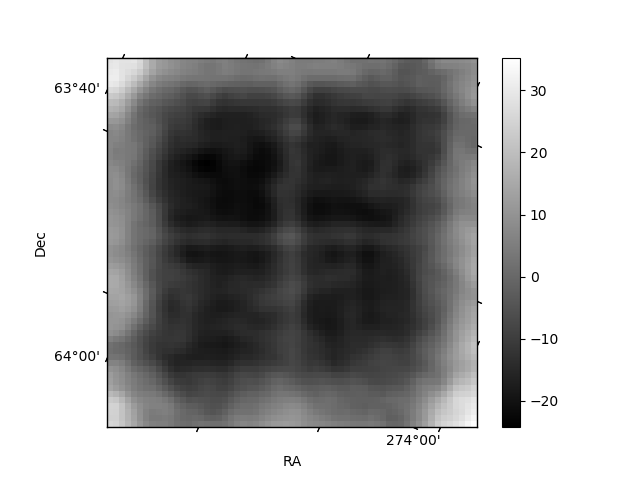
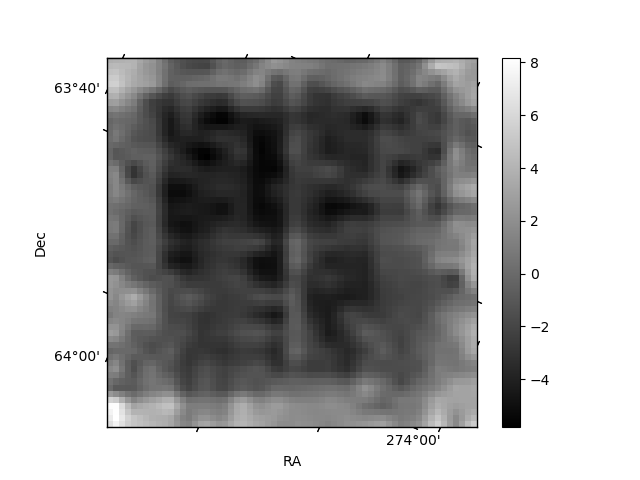
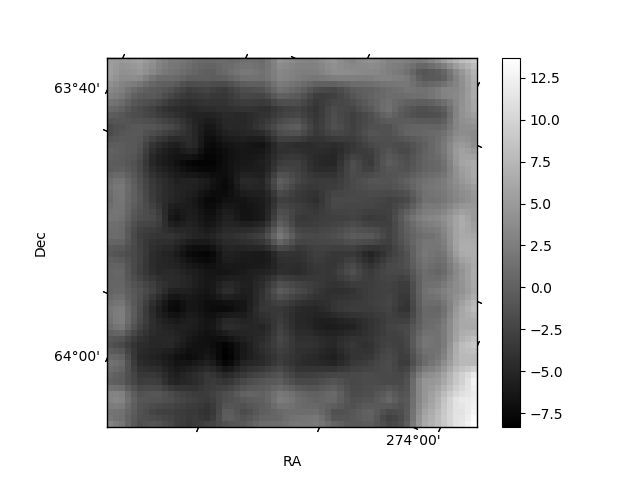
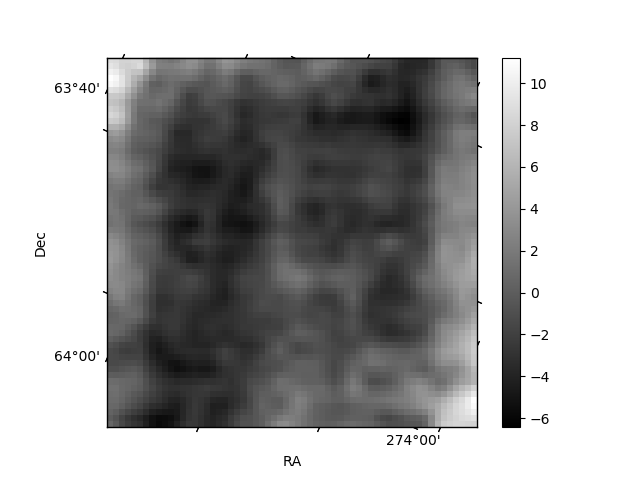
Histogram calculated using DETX and DETY for each event in the final _common_clean file
| Quadrant A | 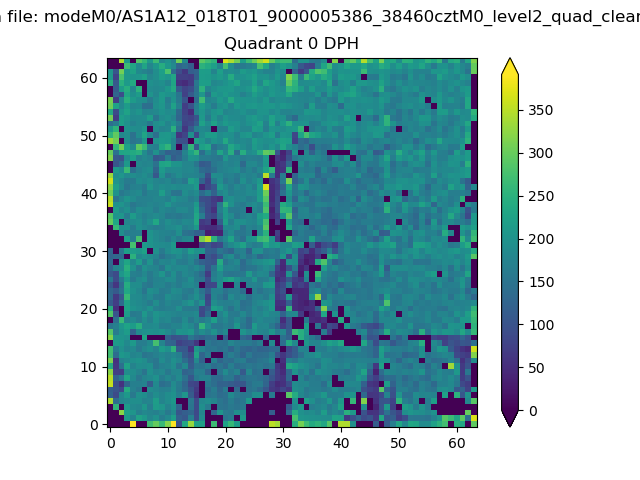 |
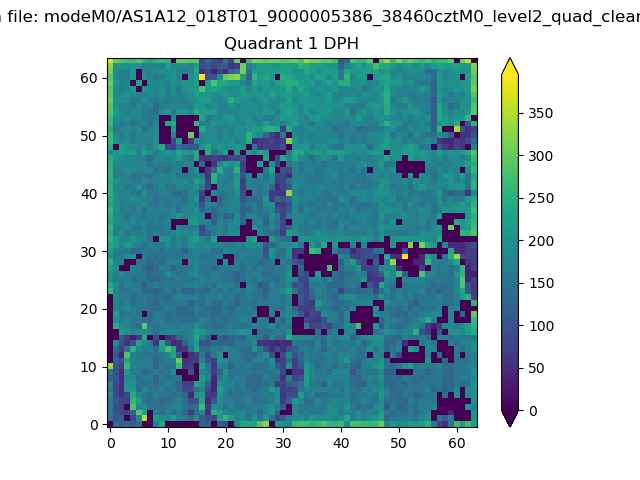 |
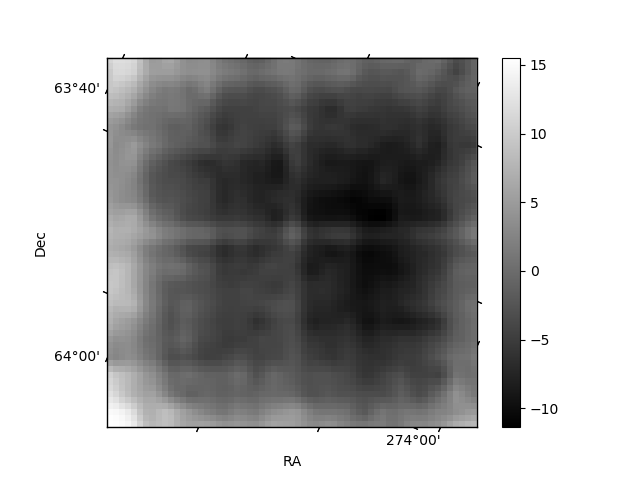
Quadrant B |
|---|---|---|---|
| Quadrant D | 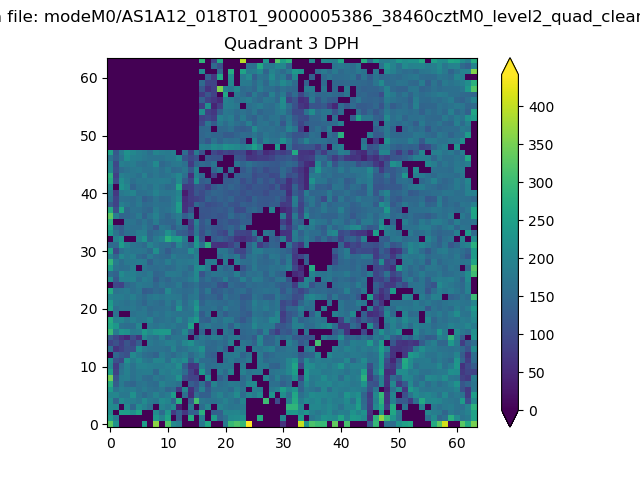 |
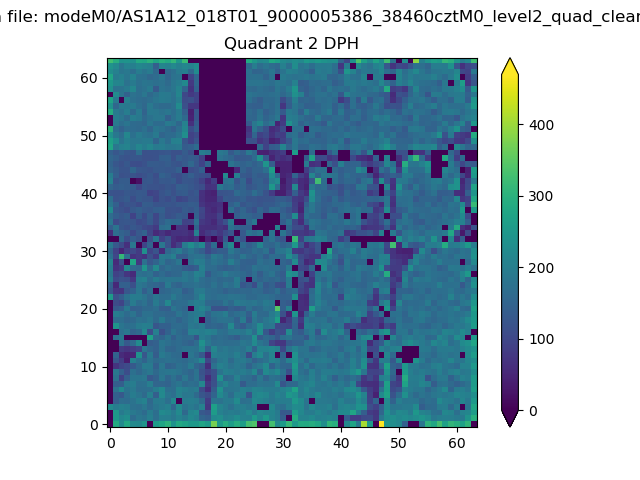 |
Quadrant C |
| Plot type | Count rate plots | Images |
|---|---|---|
| Comparison with Poisson distribution Blue bars denote a histogram of data divided into 1 sec bins. Red curve is a Poisson curve with rate = median count rate of data. |
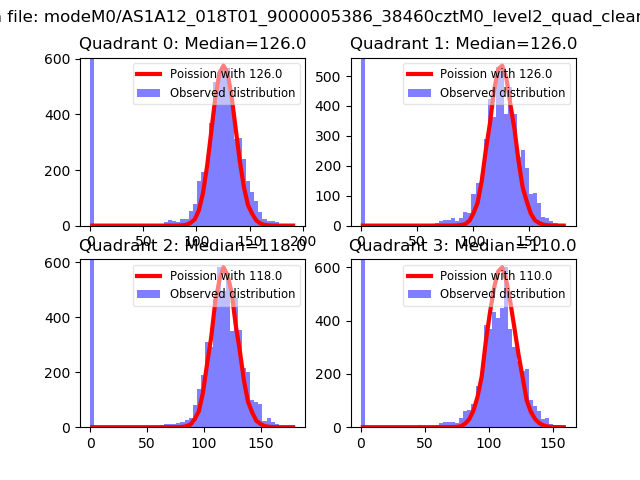 |
 |
| Quadrant-wise count rates Data is divided into 100 sec bins |
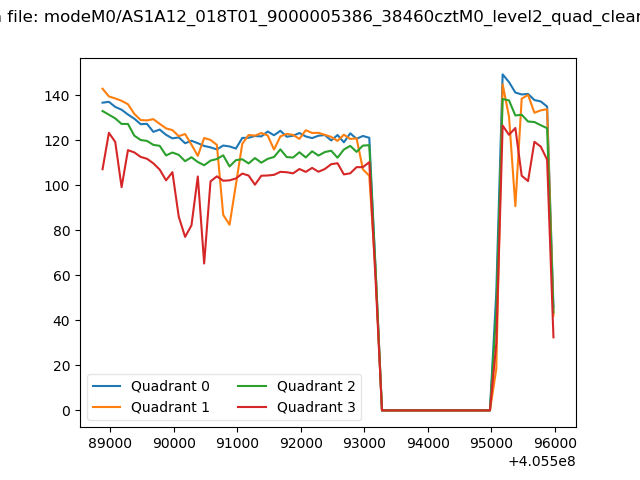 |
|
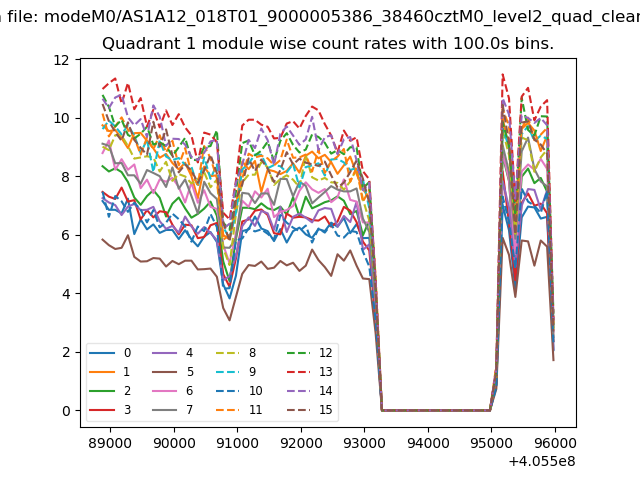
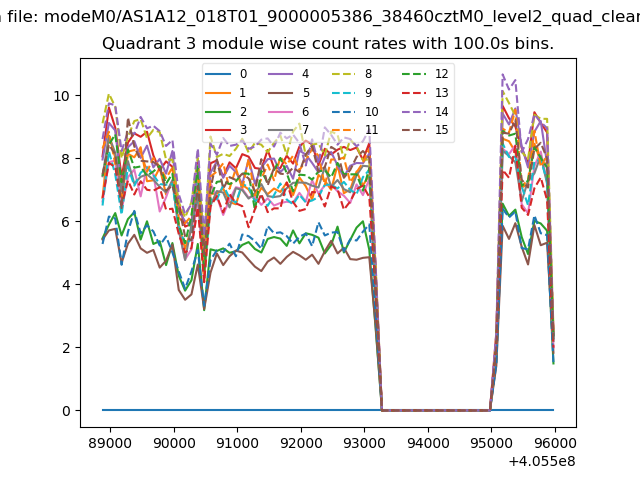
| Module-wise count rates for Quadrant A Data is divided into 100 sec bins |
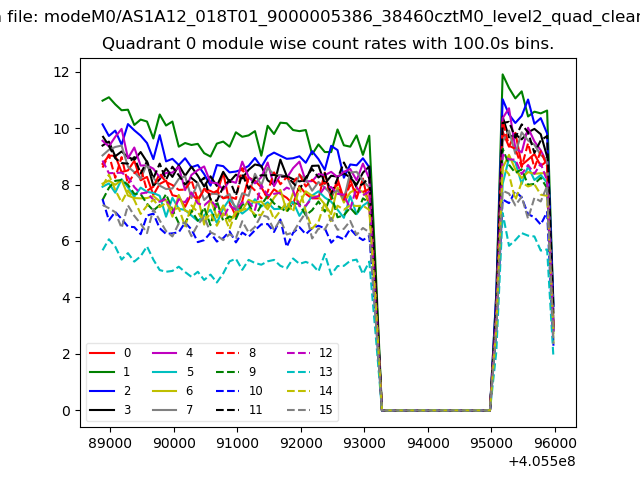 |
 |
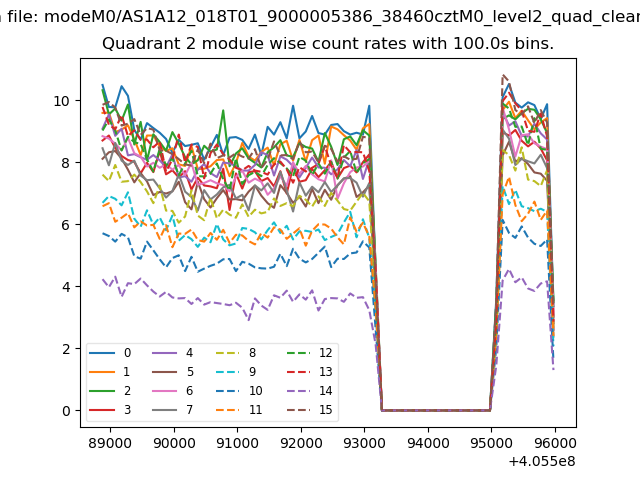
| Module-wise count rates for Quadrant B Data is divided into 100 sec bins |
 |
 |
| Module-wise count rates for Quadrant C Data is divided into 100 sec bins |
 |
 |
| Module-wise count rates for Quadrant D Data is divided into 100 sec bins |
 |
 |
| Parameter | Plot |
|---|---|
| CZT HV Monitor | 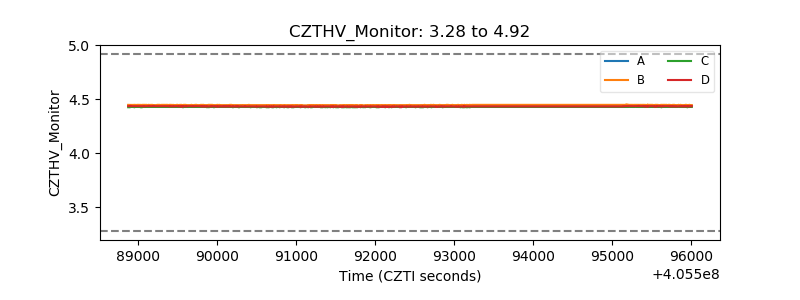 |
| D_VDD | 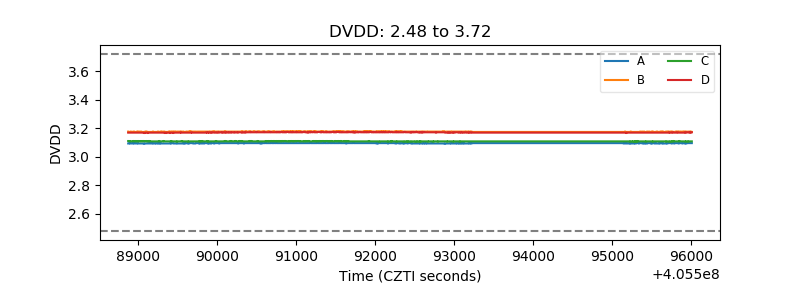 |
| Temperature 1 | 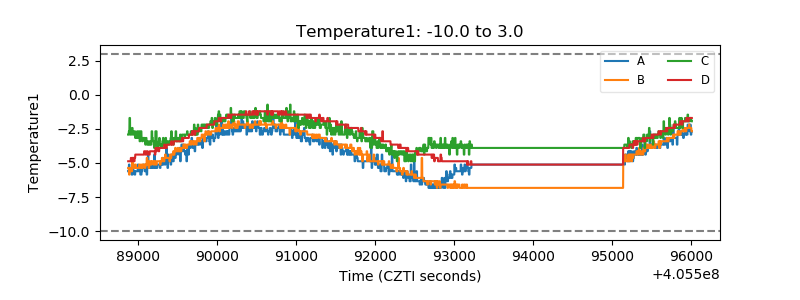 |
| Veto HV Monitor | 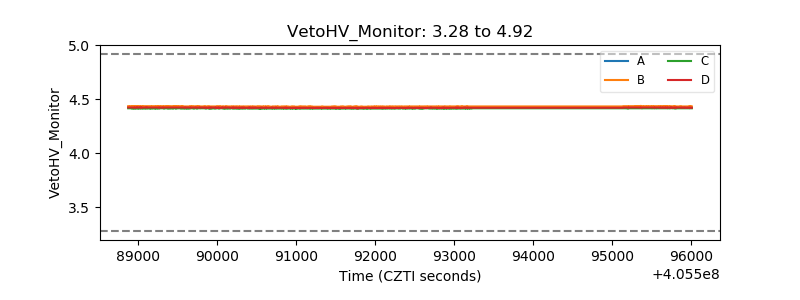 |
| Veto LLD | 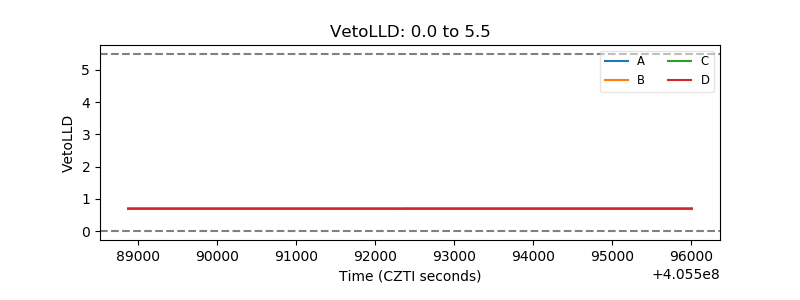 |
| Alpha Counter | 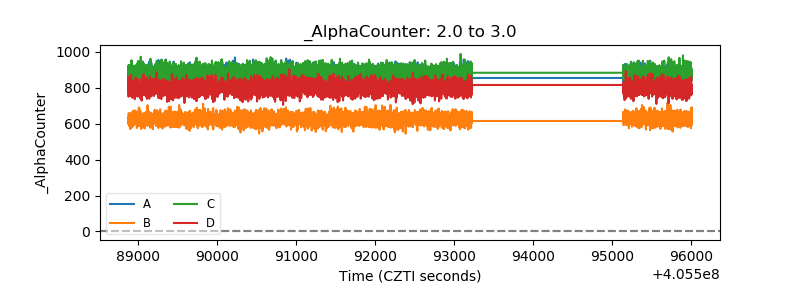 |
| _CPM_Rate | 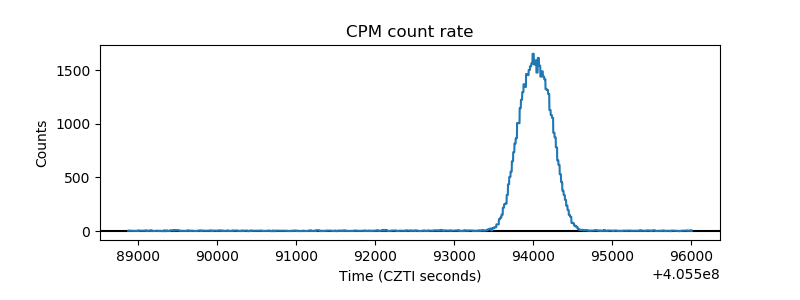 |
| CZT Counter | 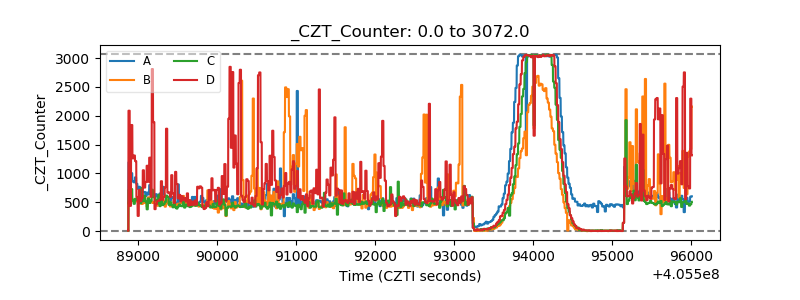 |
| +2.5 Volts monitor | 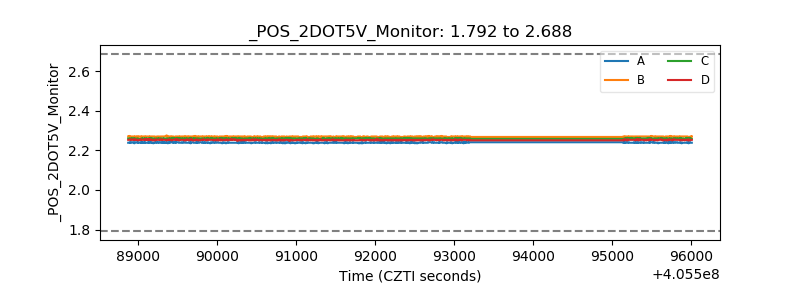 |
| +5 Volts monitor | 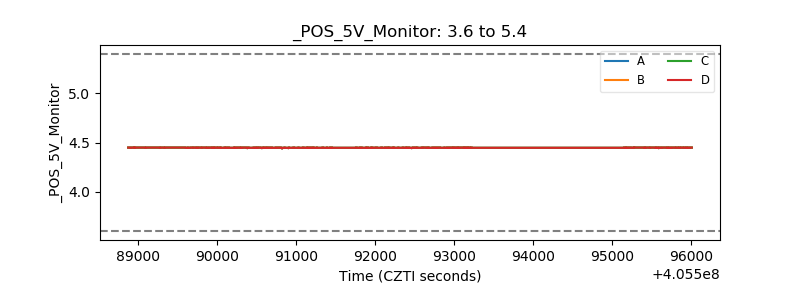 |
| _ROLL_ROT | 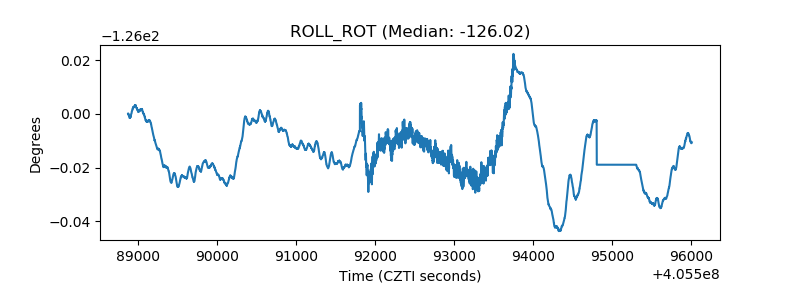 |
| _Roll_DEC | 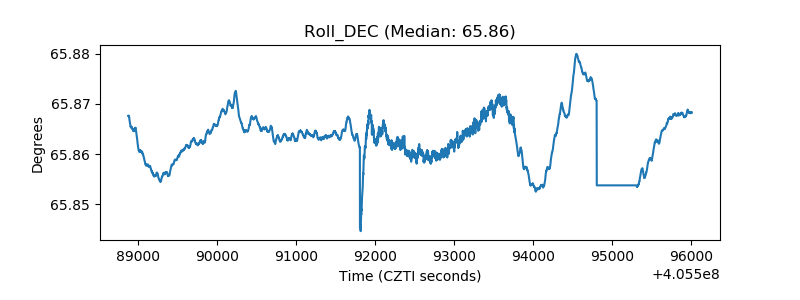 |
| _Roll_RA | 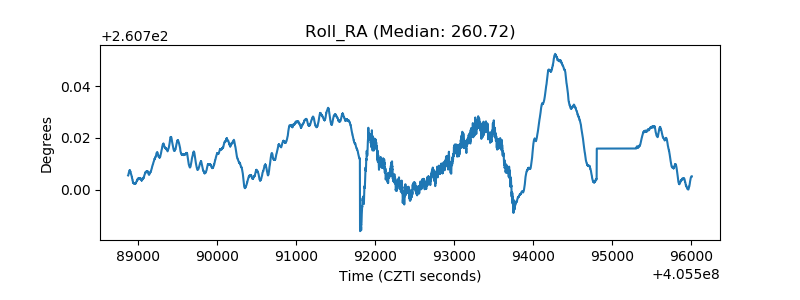 |
| Veto Counter | 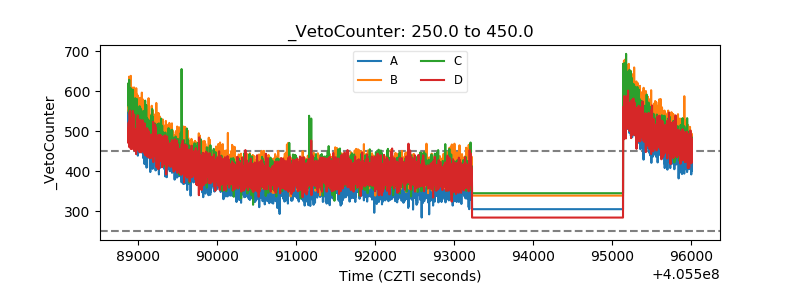 |