| Param | Original file | Final file |
|---|---|---|
| Filename | modeM0/AS1A12_018T01_9000005386_38461cztM0_level2.fits | modeM0/AS1A12_018T01_9000005386_38461cztM0_level2_quad_clean.evt |
| Size (bytes) | 384,647,040 | 88,712,640 |
| Size | 366.8 MB | 84.6 MB |
| Events in quadrant A | 2,689,658 | 631,561 |
| Events in quadrant B | 3,282,164 | 613,628 |
| Events in quadrant C | 2,391,057 | 590,192 |
| Events in quadrant D | 5,498,526 | 510,537 |
| Mode SS | |||
|---|---|---|---|
| Quadrant | BADHDUFLAG | Total packets | Discarded packets |
| A | 0 | 100 | 0 |
| B | 0 | 100 | 0 |
| C | 0 | 100 | 0 |
| D | 0 | 100 | 0 |
| Mode M9 | |||
|---|---|---|---|
| Quadrant | BADHDUFLAG | Total packets | Discarded packets |
| A | 0 | 20 | 0 |
| B | 0 | 20 | 0 |
| C | 0 | 20 | 0 |
| D | 0 | 20 | 0 |
| Mode M0 | |||
|---|---|---|---|
| Quadrant | BADHDUFLAG | Total packets | Discarded packets |
| A | 0 | 10874 | 2 |
| B | 0 | 12847 | 1 |
| C | 0 | 9925 | 1 |
| D | 0 | 19687 | 1 |
| Quadrant | Total seconds | Saturated seconds | Saturation percentage |
|---|---|---|---|
| A | 4848 | 12 | 0.247525% |
| B | 4848 | 202 | 4.166667% |
| C | 4848 | 5 | 0.103135% |
| D | 4848 | 591 | 12.190594% |
Noise dominated data is calculated using 1-second bins in cleaned event files. If a bin has >2000 counts, and if more than 50% of those come from <1% of pixels, then it is considered to be noise-dominated and hence unusable.
| Quadrant | # 1 sec bins | Bins with >0 counts | Bins with >2000 counts | High rate bins dominated by noise | Noise dominated (total time) | Noise dominated (detector-on time) | Marked lightcurve |
|---|---|---|---|---|---|---|---|
| A | 6881 | 4849 | 6 | 6 | 0.09% | 0.12% | 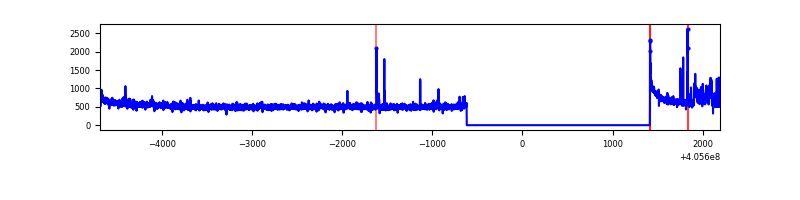 |
| B | 6881 | 4849 | 162 | 162 | 2.35% | 3.34% | 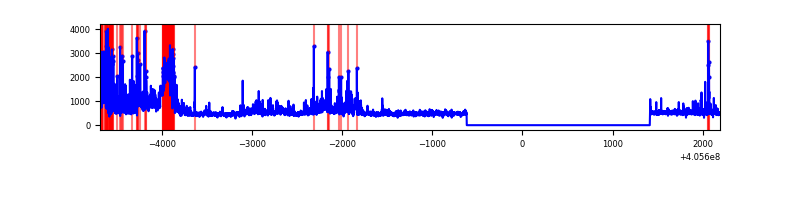 |
| C | 6881 | 4849 | 2 | 2 | 0.03% | 0.04% | 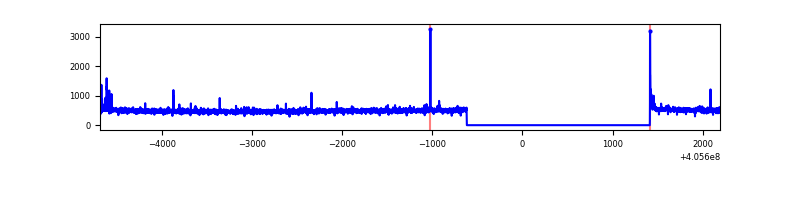 |
| D | 6881 | 4849 | 565 | 565 | 8.21% | 11.65% | 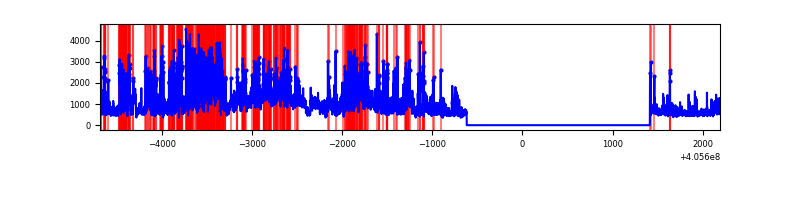 |
Top three noisy pixels from each quadrant. If the there are fewer than three noisy pixels in the level2.evt file, extra rows are filled as -1
| Pixel properties | Quadrant properties | ||||||
|---|---|---|---|---|---|---|---|
| Quadrant | DetID | PixID | Counts | Sigma | Mean | Median | Sigma |
| A | 10 | 83 | 332950 | 2916.85 | 574 | 564 | 114.0 |
| A | 12 | 16 | 71709 | 624.33 | 574 | 564 | 114.0 |
| A | 9 | 143 | 27567 | 236.96 | 574 | 564 | 114.0 |
| B | 5 | 184 | 891029 | 8577.85 | 558 | 545 | 103.8 |
| B | 0 | 183 | 61813 | 590.18 | 558 | 545 | 103.8 |
| B | 15 | 201 | 44026 | 418.84 | 558 | 545 | 103.8 |
| C | 15 | 214 | 202796 | 1610.23 | 548 | 550 | 125.6 |
| C | 14 | 254 | 34313 | 268.81 | 548 | 550 | 125.6 |
| C | 0 | 10 | 16666 | 128.31 | 548 | 550 | 125.6 |
| D | 12 | 235 | 1532481 | 11852.22 | 539 | 523 | 129.3 |
| D | 12 | 227 | 1265040 | 9783.13 | 539 | 523 | 129.3 |
| D | 13 | 249 | 197203 | 1521.64 | 539 | 523 | 129.3 |
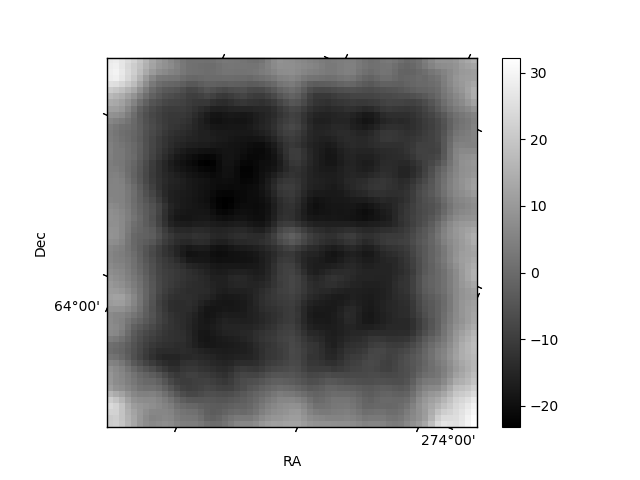
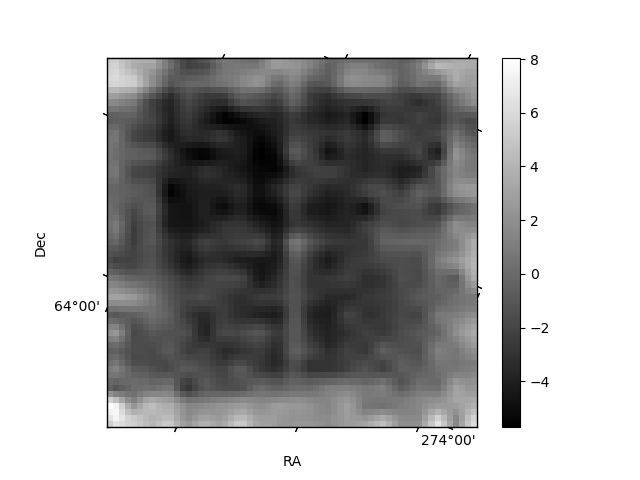
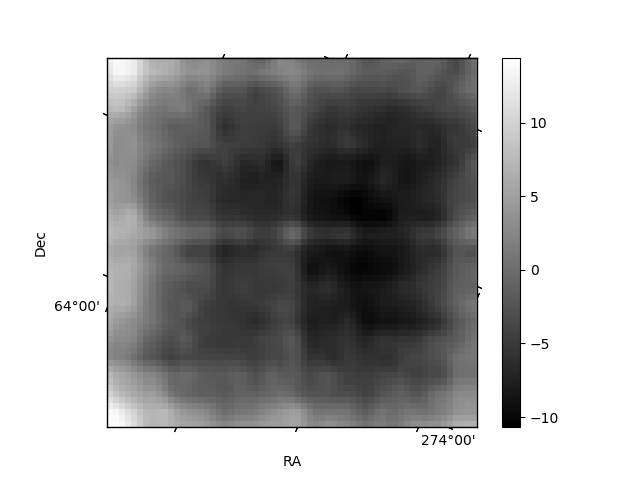
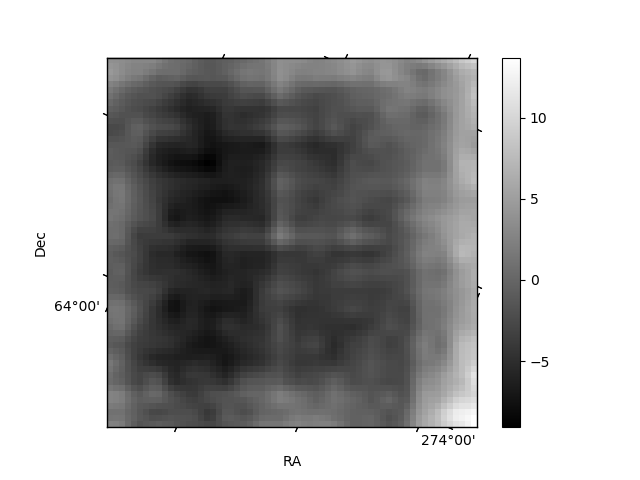
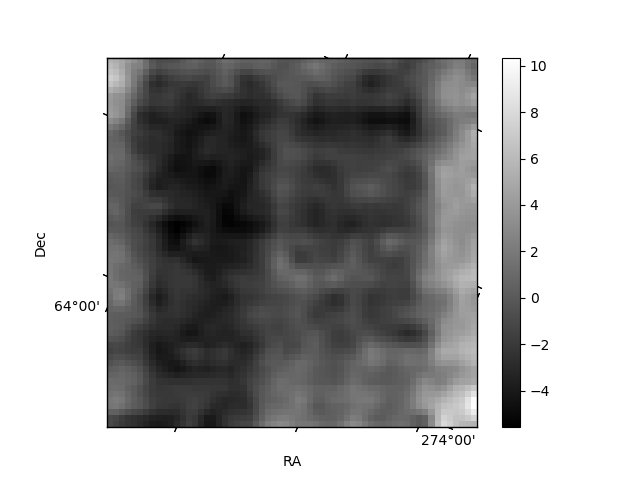
Histogram calculated using DETX and DETY for each event in the final _common_clean file
| Quadrant A | 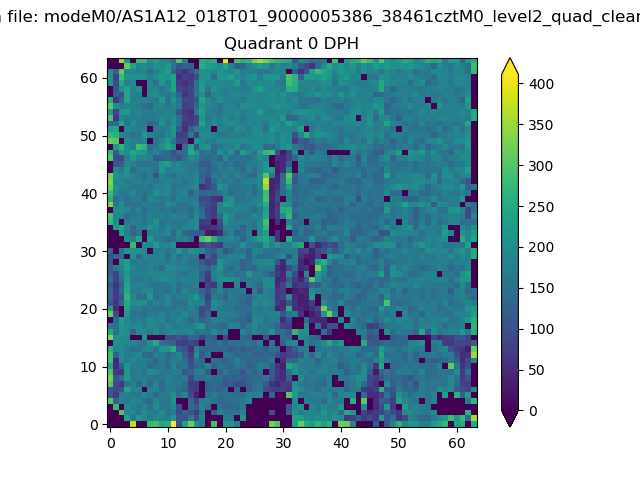 |
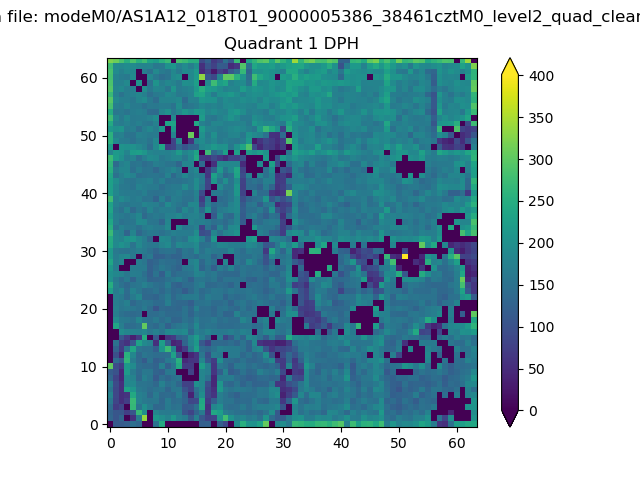 |
Quadrant B |
|---|---|---|---|
| Quadrant D | 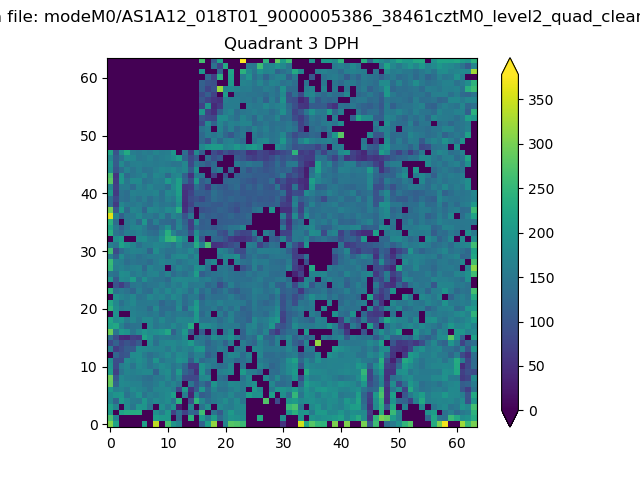 |
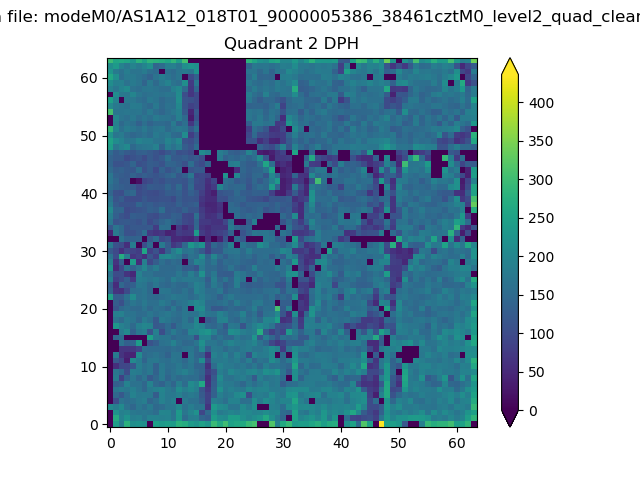 |
Quadrant C |
| Plot type | Count rate plots | Images |
|---|---|---|
| Comparison with Poisson distribution Blue bars denote a histogram of data divided into 1 sec bins. Red curve is a Poisson curve with rate = median count rate of data. |
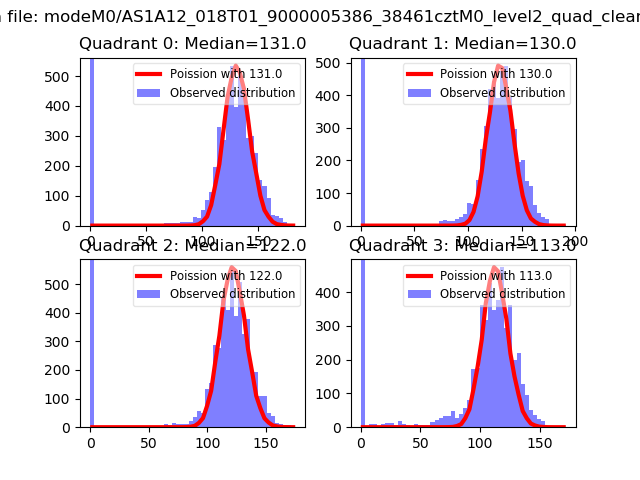 |
 |
| Quadrant-wise count rates Data is divided into 100 sec bins |
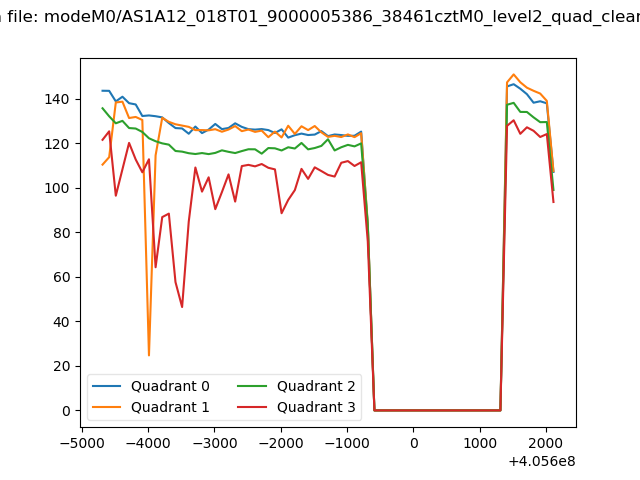 |
|
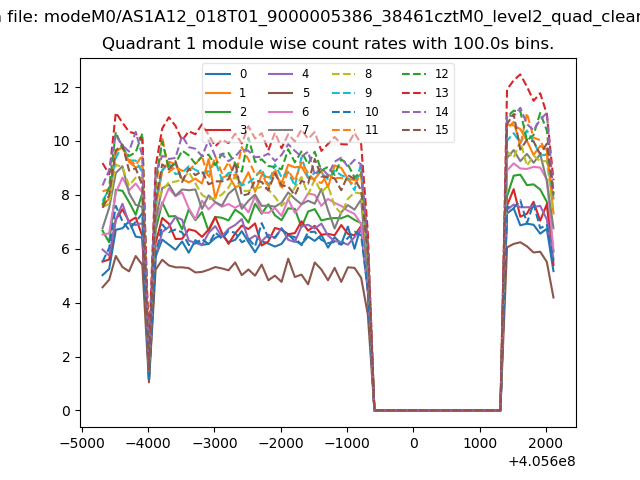
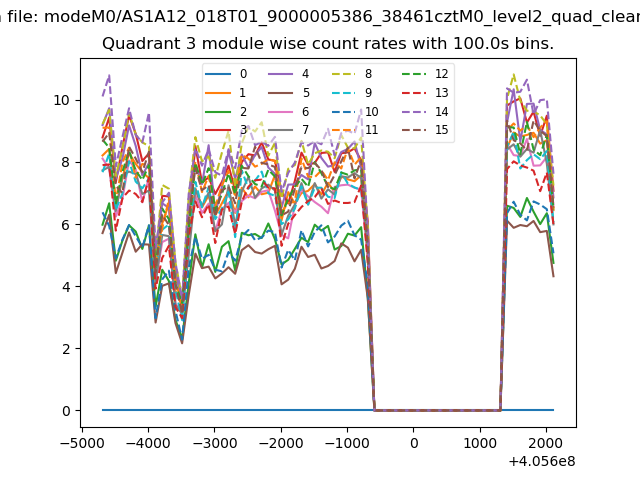
| Module-wise count rates for Quadrant A Data is divided into 100 sec bins |
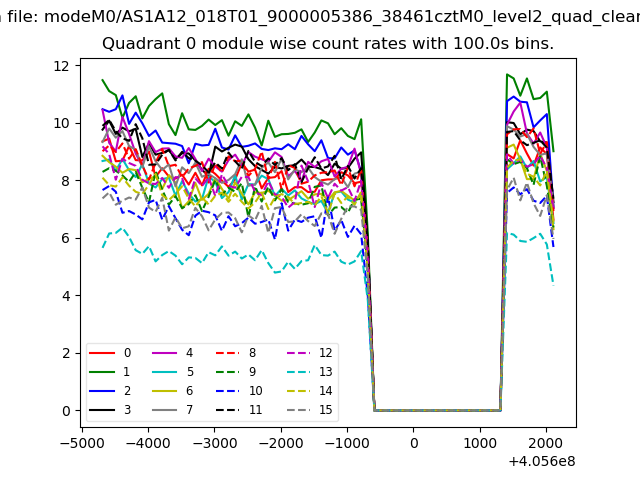 |
 |
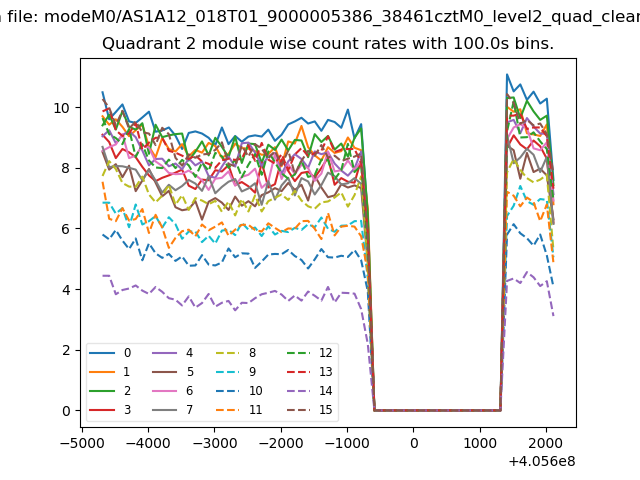
| Module-wise count rates for Quadrant B Data is divided into 100 sec bins |
 |
 |
| Module-wise count rates for Quadrant C Data is divided into 100 sec bins |
 |
 |
| Module-wise count rates for Quadrant D Data is divided into 100 sec bins |
 |
 |
| Parameter | Plot |
|---|---|
| CZT HV Monitor | 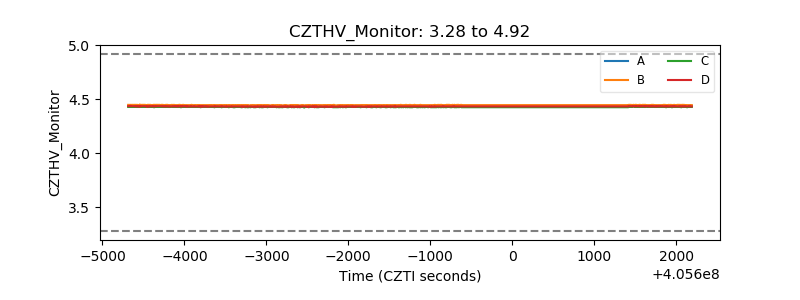 |
| D_VDD | 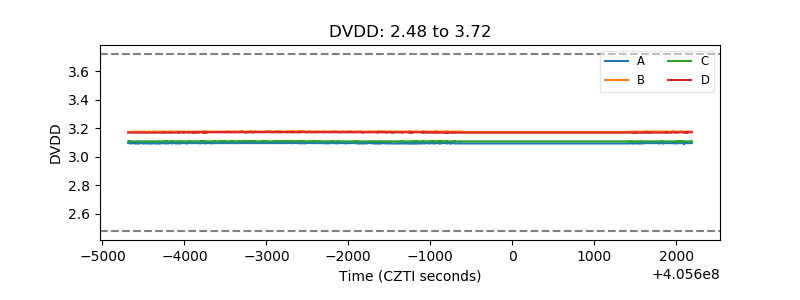 |
| Temperature 1 | 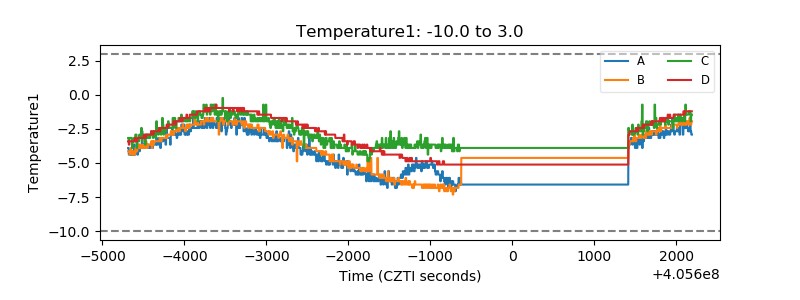 |
| Veto HV Monitor |  |
| Veto LLD | 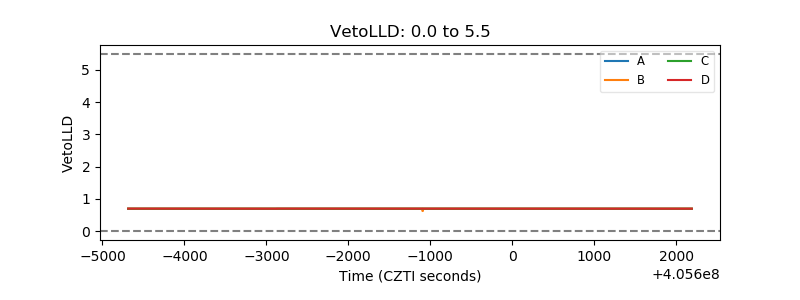 |
| Alpha Counter | 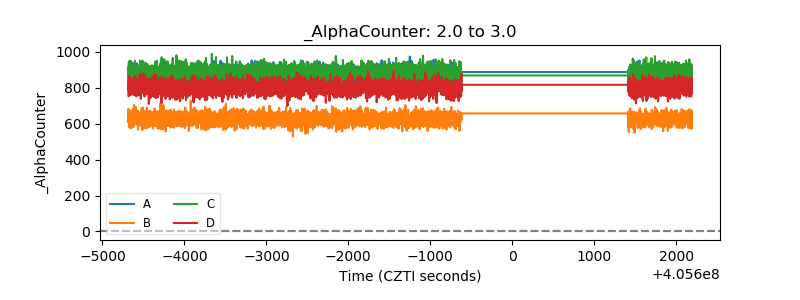 |
| _CPM_Rate | 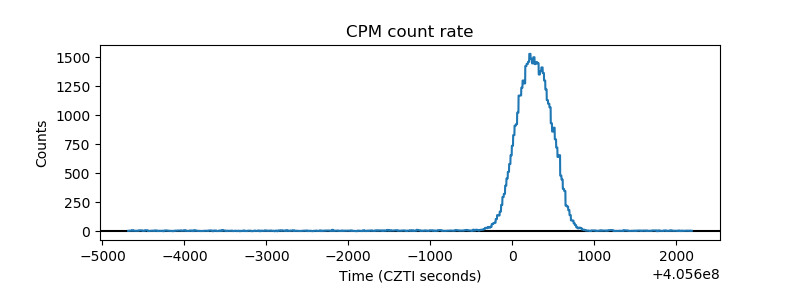 |
| CZT Counter | 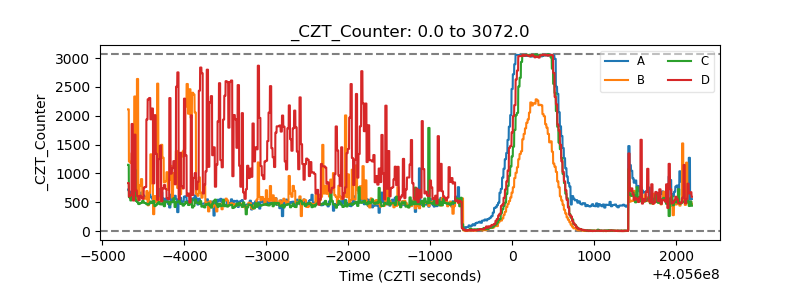 |
| +2.5 Volts monitor | 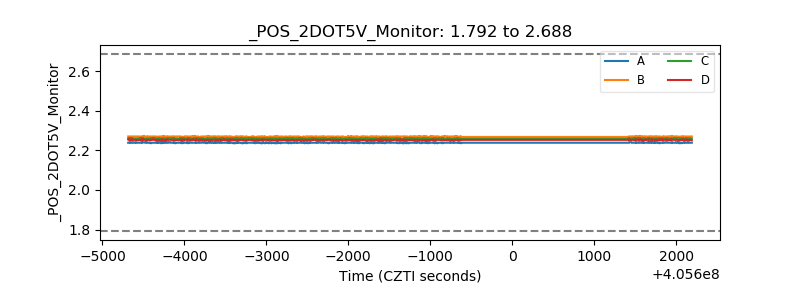 |
| +5 Volts monitor | 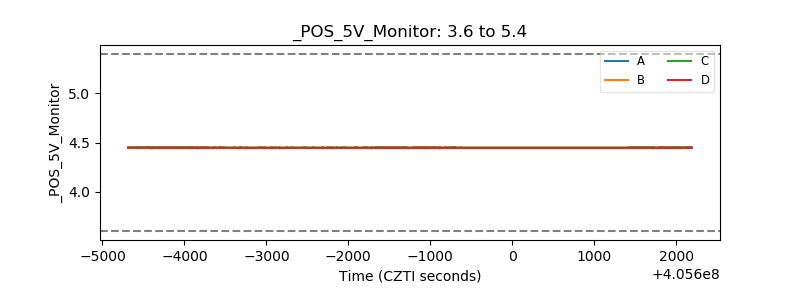 |
| _ROLL_ROT | 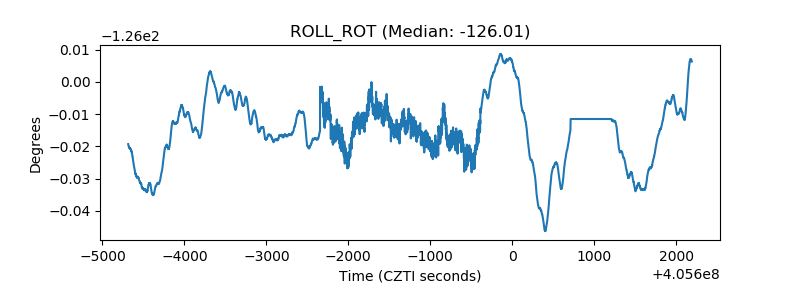 |
| _Roll_DEC | 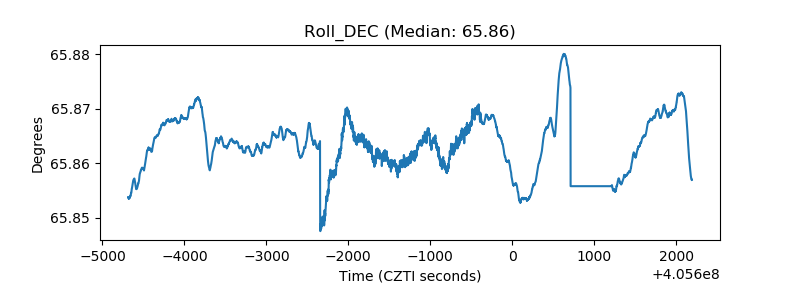 |
| _Roll_RA | 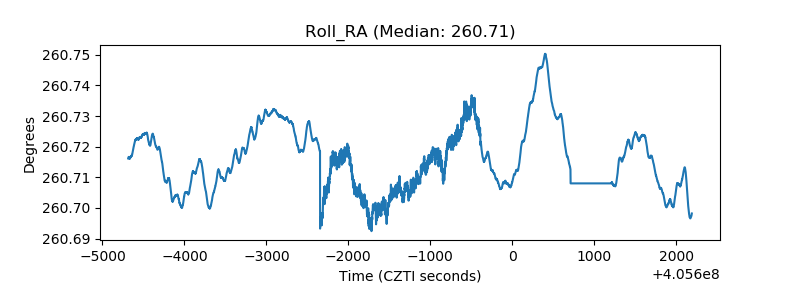 |
| Veto Counter | 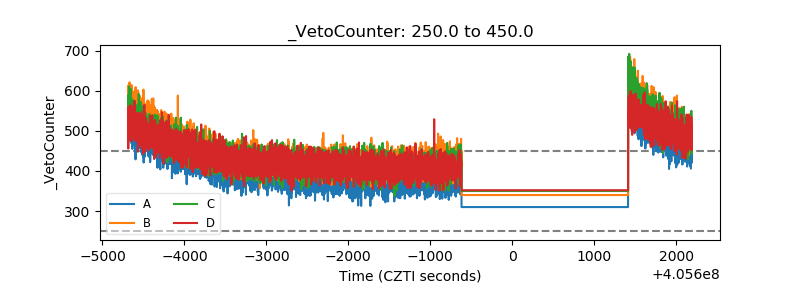 |