| Param | Original file | Final file |
|---|---|---|
| Filename | modeM0/AS1A12_018T01_9000005386_38462cztM0_level2.fits | modeM0/AS1A12_018T01_9000005386_38462cztM0_level2_quad_clean.evt |
| Size (bytes) | 351,527,040 | 91,235,520 |
| Size | 335.2 MB | 87.0 MB |
| Events in quadrant A | 2,901,700 | 639,767 |
| Events in quadrant B | 2,606,931 | 643,672 |
| Events in quadrant C | 2,510,943 | 603,523 |
| Events in quadrant D | 4,609,229 | 529,888 |
| Mode SS | |||
|---|---|---|---|
| Quadrant | BADHDUFLAG | Total packets | Discarded packets |
| A | 0 | 102 | 0 |
| B | 0 | 102 | 0 |
| C | 0 | 102 | 0 |
| D | 0 | 102 | 0 |
| Mode M9 | |||
|---|---|---|---|
| Quadrant | BADHDUFLAG | Total packets | Discarded packets |
| A | 0 | 22 | 0 |
| B | 0 | 22 | 0 |
| C | 0 | 22 | 0 |
| D | 0 | 23 | 0 |
| Mode M0 | |||
|---|---|---|---|
| Quadrant | BADHDUFLAG | Total packets | Discarded packets |
| A | 0 | 11627 | 3 |
| B | 0 | 10836 | 2 |
| C | 0 | 10268 | 2 |
| D | 0 | 17056 | 2 |
| Quadrant | Total seconds | Saturated seconds | Saturation percentage |
|---|---|---|---|
| A | 4928 | 30 | 0.608766% |
| B | 4928 | 44 | 0.892857% |
| C | 4928 | 12 | 0.243506% |
| D | 4928 | 477 | 9.679383% |
Noise dominated data is calculated using 1-second bins in cleaned event files. If a bin has >2000 counts, and if more than 50% of those come from <1% of pixels, then it is considered to be noise-dominated and hence unusable.
| Quadrant | # 1 sec bins | Bins with >0 counts | Bins with >2000 counts | High rate bins dominated by noise | Noise dominated (total time) | Noise dominated (detector-on time) | Marked lightcurve |
|---|---|---|---|---|---|---|---|
| A | 7049 | 4929 | 25 | 25 | 0.35% | 0.51% | 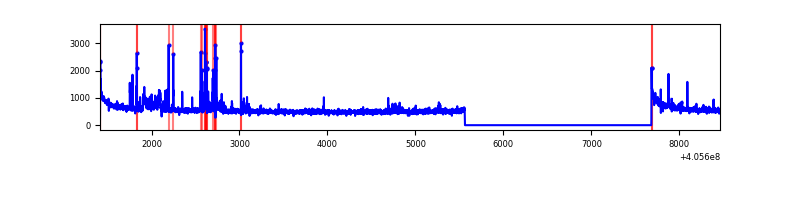 |
| B | 7049 | 4929 | 21 | 21 | 0.30% | 0.43% | 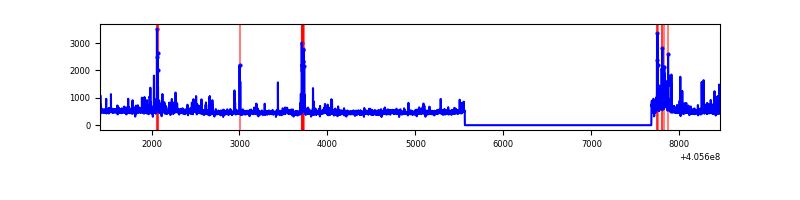 |
| C | 7049 | 4929 | 9 | 9 | 0.13% | 0.18% | 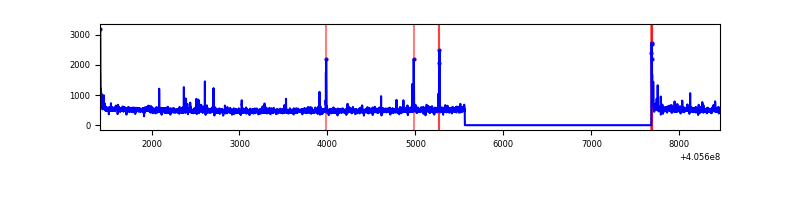 |
| D | 7049 | 4929 | 402 | 402 | 5.70% | 8.16% | 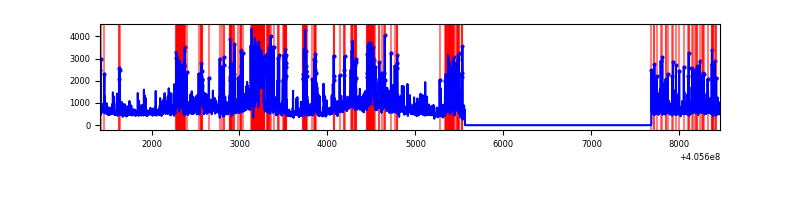 |
Top three noisy pixels from each quadrant. If the there are fewer than three noisy pixels in the level2.evt file, extra rows are filled as -1
| Pixel properties | Quadrant properties | ||||||
|---|---|---|---|---|---|---|---|
| Quadrant | DetID | PixID | Counts | Sigma | Mean | Median | Sigma |
| A | 10 | 83 | 388494 | 3375.64 | 585 | 575 | 114.9 |
| A | 13 | 248 | 129123 | 1118.61 | 585 | 575 | 114.9 |
| A | 12 | 16 | 56531 | 486.92 | 585 | 575 | 114.9 |
| B | 0 | 183 | 124081 | 1147.91 | 574 | 558 | 107.6 |
| B | 5 | 184 | 84938 | 784.15 | 574 | 558 | 107.6 |
| B | 4 | 232 | 42785 | 392.42 | 574 | 558 | 107.6 |
| C | 15 | 214 | 207941 | 1605.42 | 562 | 567 | 129.2 |
| C | 14 | 254 | 62000 | 475.59 | 562 | 567 | 129.2 |
| C | 0 | 10 | 40311 | 307.68 | 562 | 567 | 129.2 |
| D | 12 | 235 | 1293569 | 9680.11 | 552 | 538 | 133.6 |
| D | 13 | 249 | 549741 | 4111.54 | 552 | 538 | 133.6 |
| D | 12 | 227 | 312533 | 2335.71 | 552 | 538 | 133.6 |
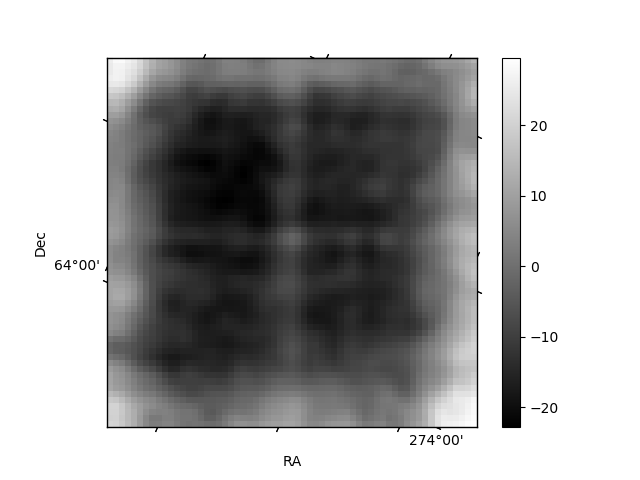
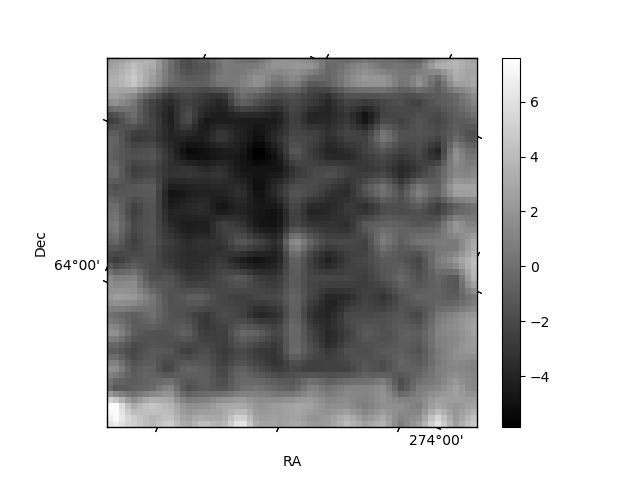
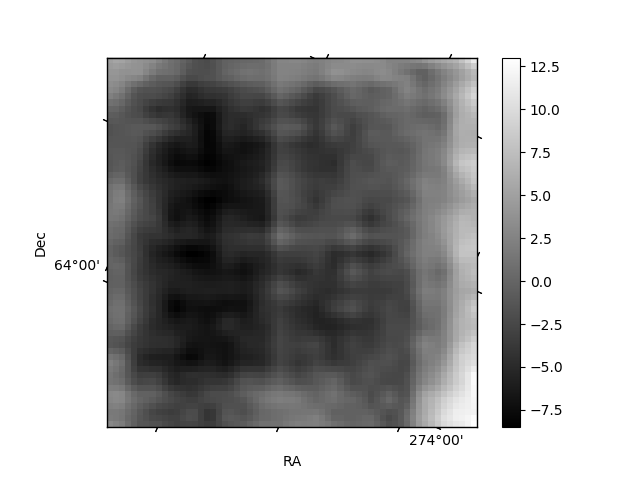
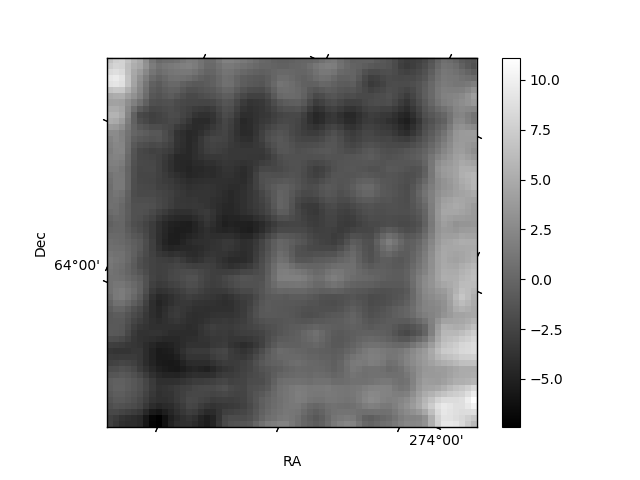
Histogram calculated using DETX and DETY for each event in the final _common_clean file
| Quadrant A | 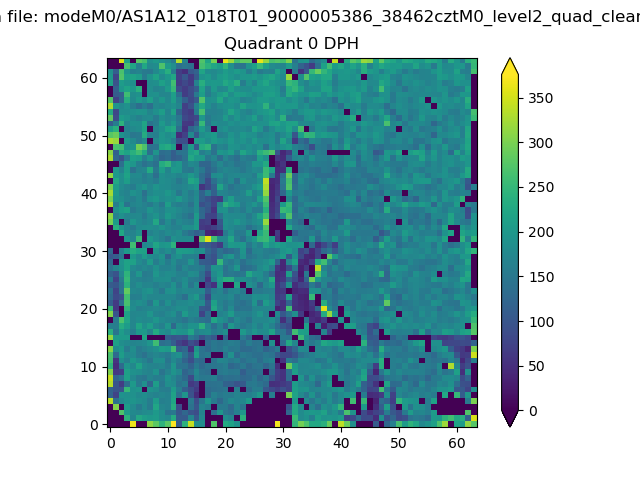 |
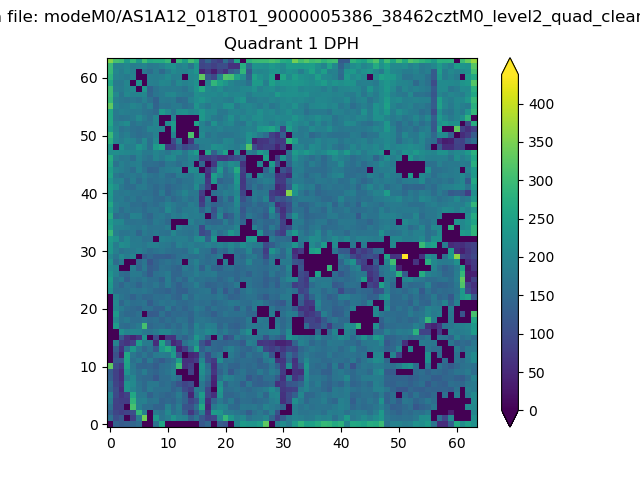 |
Quadrant B |
|---|---|---|---|
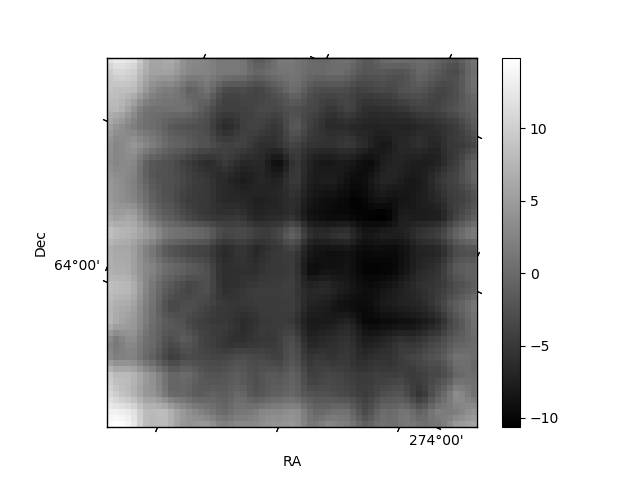
| Quadrant D | 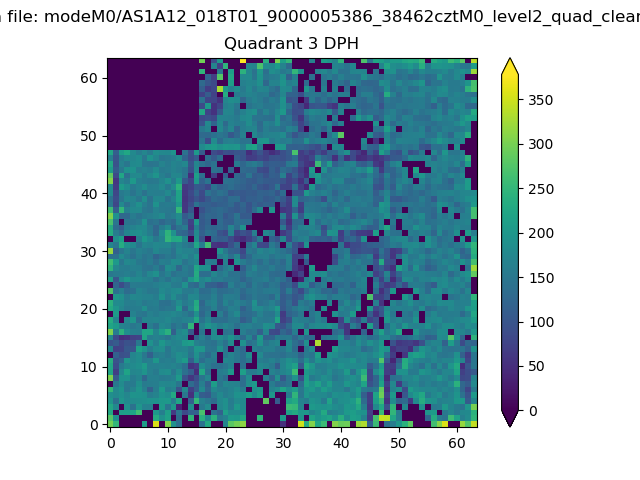 |
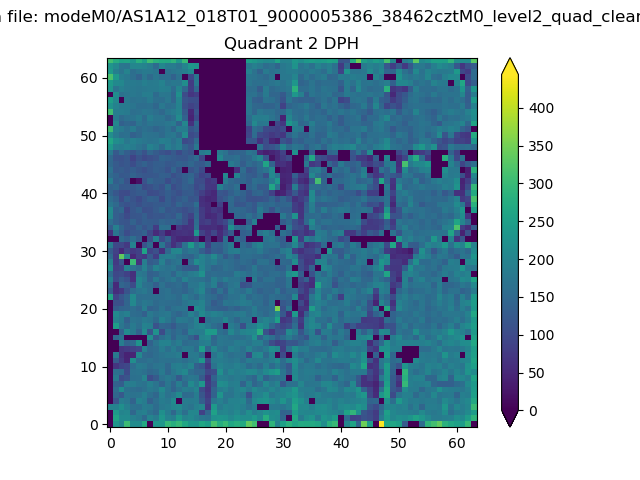 |
Quadrant C |
| Plot type | Count rate plots | Images |
|---|---|---|
| Comparison with Poisson distribution Blue bars denote a histogram of data divided into 1 sec bins. Red curve is a Poisson curve with rate = median count rate of data. |
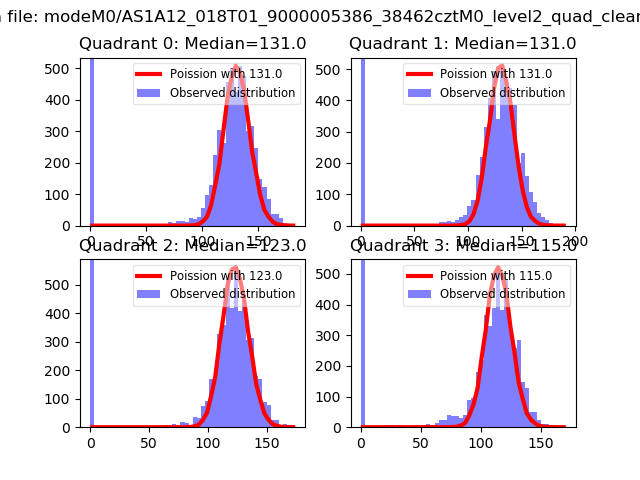 |
 |
| Quadrant-wise count rates Data is divided into 100 sec bins |
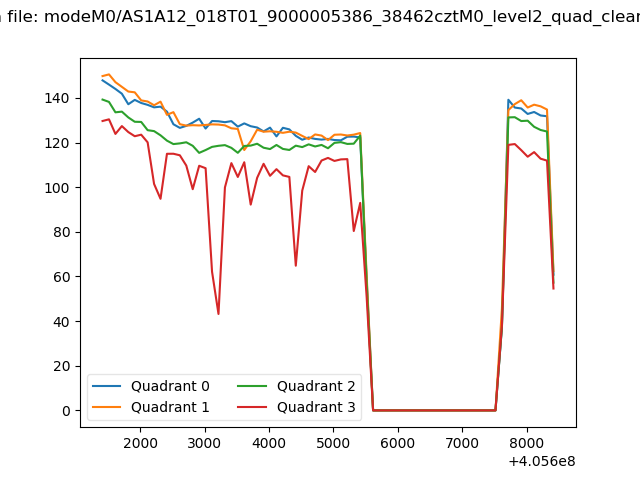 |
|
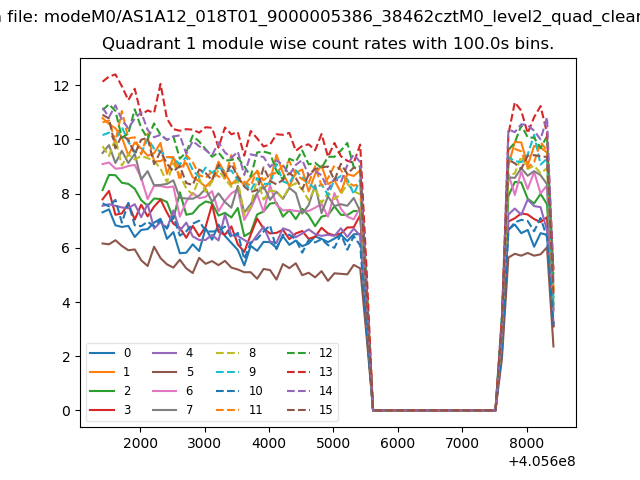
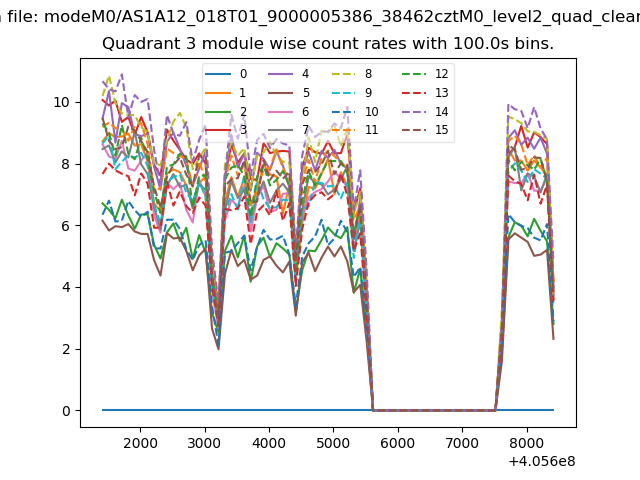
| Module-wise count rates for Quadrant A Data is divided into 100 sec bins |
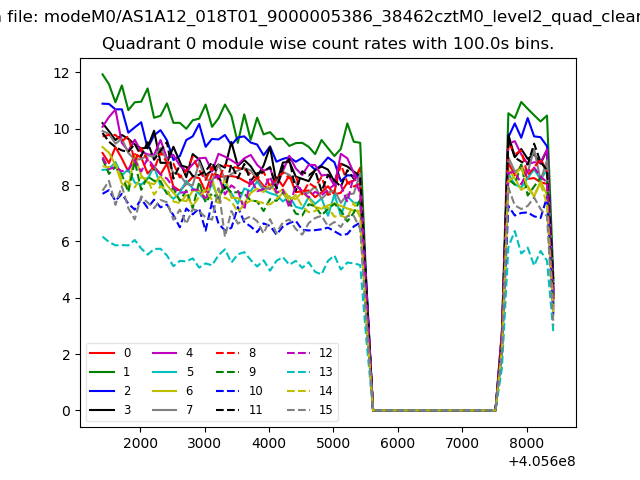 |
 |
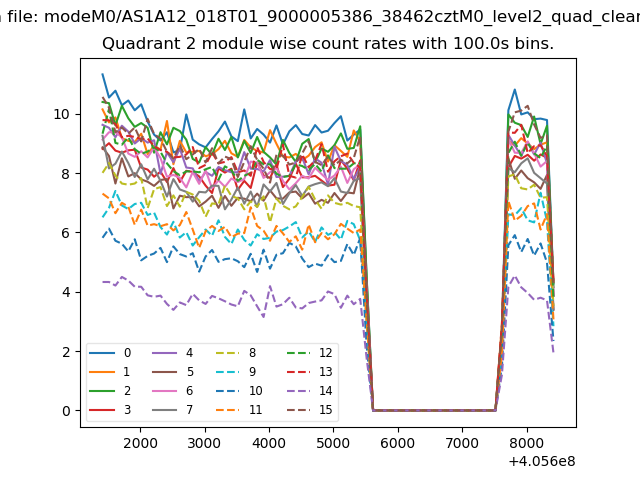
| Module-wise count rates for Quadrant B Data is divided into 100 sec bins |
 |
 |
| Module-wise count rates for Quadrant C Data is divided into 100 sec bins |
 |
 |
| Module-wise count rates for Quadrant D Data is divided into 100 sec bins |
 |
 |
| Parameter | Plot |
|---|---|
| CZT HV Monitor | 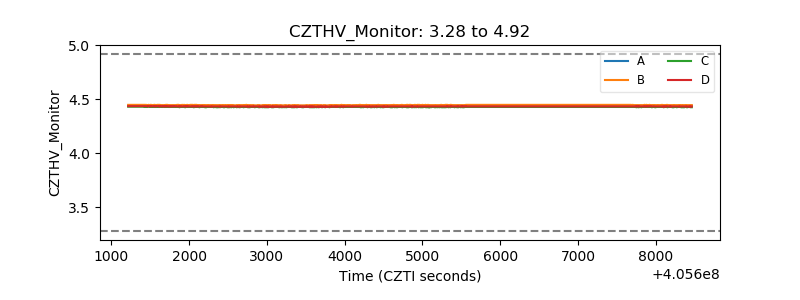 |
| D_VDD | 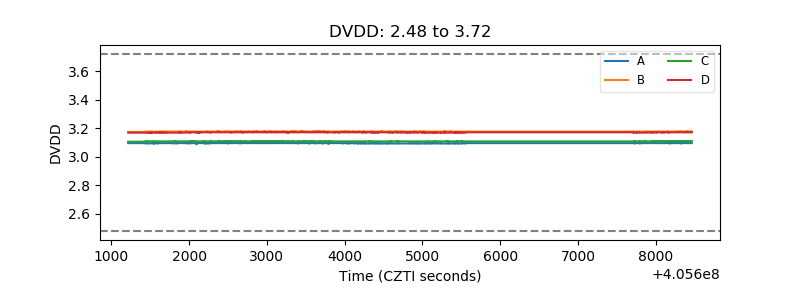 |
| Temperature 1 | 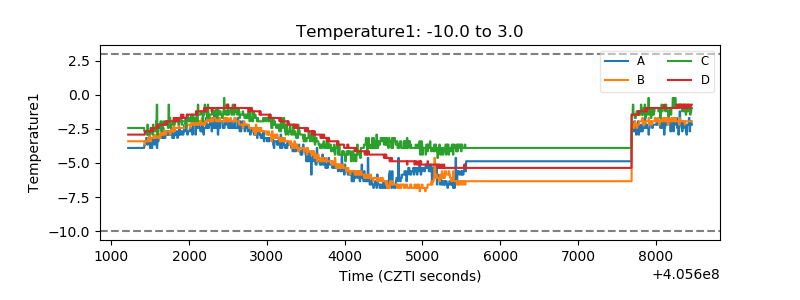 |
| Veto HV Monitor | 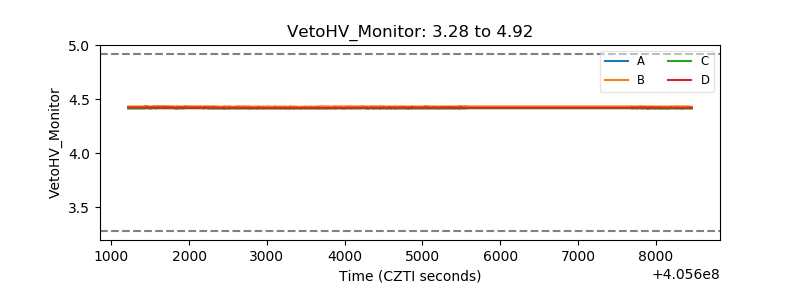 |
| Veto LLD | 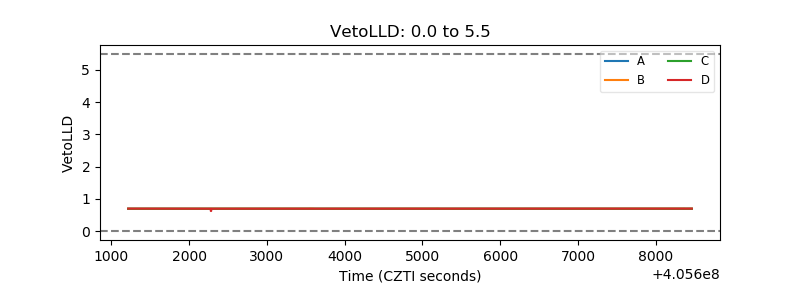 |
| Alpha Counter | 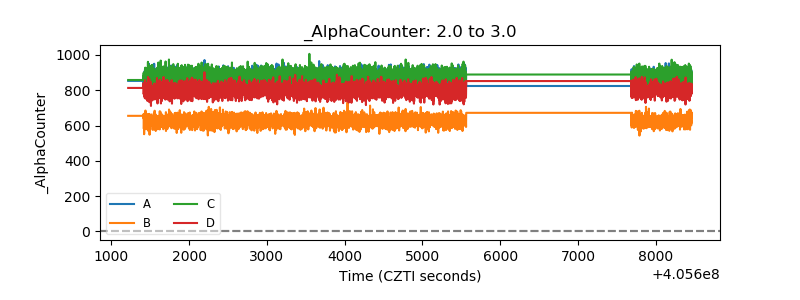 |
| _CPM_Rate | 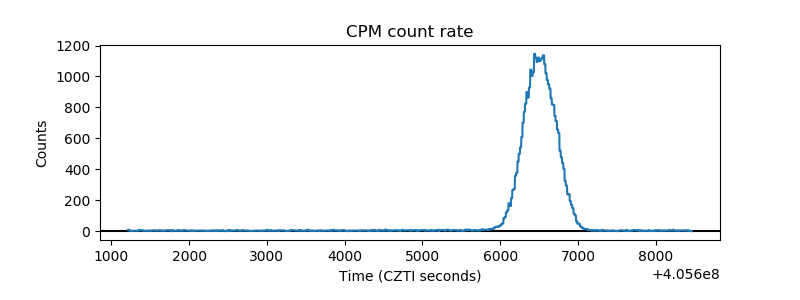 |
| CZT Counter | 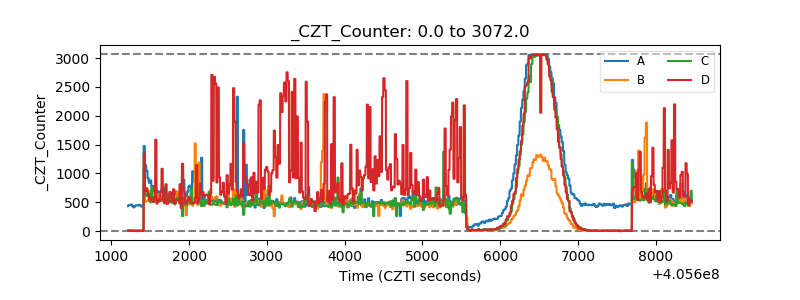 |
| +2.5 Volts monitor | 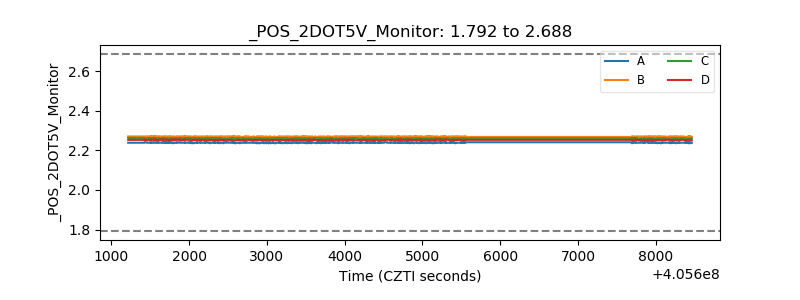 |
| +5 Volts monitor | 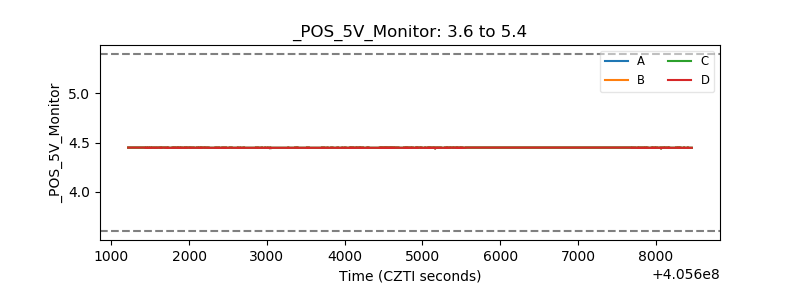 |
| _ROLL_ROT | 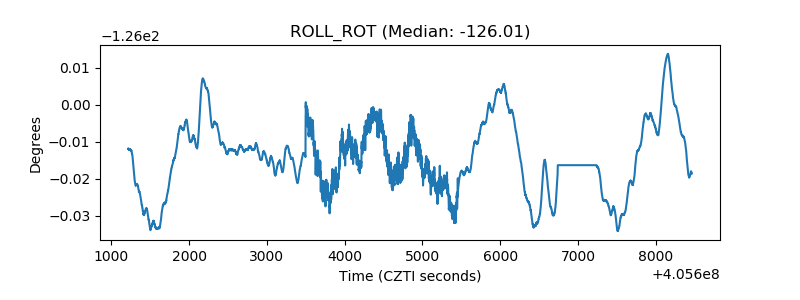 |
| _Roll_DEC | 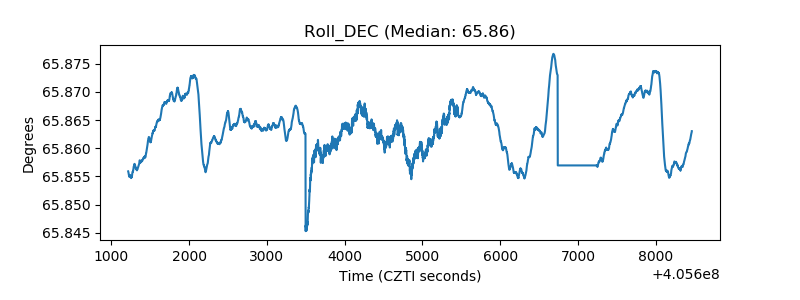 |
| _Roll_RA | 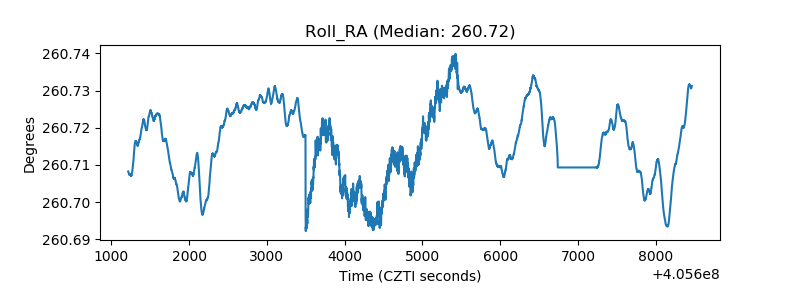 |
| Veto Counter | 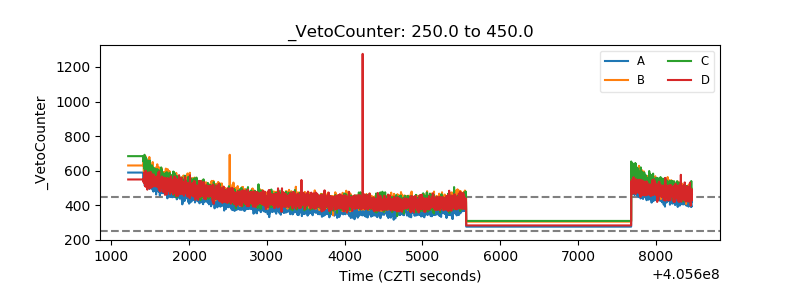 |