| Param | Original file | Final file |
|---|---|---|
| Filename | modeM0/AS1A12_018T01_9000005386_38463cztM0_level2.fits | modeM0/AS1A12_018T01_9000005386_38463cztM0_level2_quad_clean.evt |
| Size (bytes) | 352,572,480 | 90,938,880 |
| Size | 336.2 MB | 86.7 MB |
| Events in quadrant A | 2,773,823 | 630,725 |
| Events in quadrant B | 2,982,818 | 624,037 |
| Events in quadrant C | 2,520,164 | 603,734 |
| Events in quadrant D | 4,379,537 | 540,089 |
| Mode SS | |||
|---|---|---|---|
| Quadrant | BADHDUFLAG | Total packets | Discarded packets |
| A | 0 | 102 | 0 |
| B | 0 | 102 | 0 |
| C | 0 | 102 | 0 |
| D | 0 | 102 | 0 |
| Mode M9 | |||
|---|---|---|---|
| Quadrant | BADHDUFLAG | Total packets | Discarded packets |
| A | 0 | 25 | 0 |
| B | 0 | 25 | 0 |
| C | 0 | 25 | 0 |
| D | 0 | 26 | 0 |
| Mode M0 | |||
|---|---|---|---|
| Quadrant | BADHDUFLAG | Total packets | Discarded packets |
| A | 0 | 11257 | 3 |
| B | 0 | 12167 | 2 |
| C | 0 | 10420 | 2 |
| D | 0 | 16461 | 2 |
| Quadrant | Total seconds | Saturated seconds | Saturation percentage |
|---|---|---|---|
| A | 5071 | 26 | 0.512719% |
| B | 5071 | 164 | 3.234076% |
| C | 5071 | 11 | 0.216920% |
| D | 5071 | 329 | 6.487872% |
Noise dominated data is calculated using 1-second bins in cleaned event files. If a bin has >2000 counts, and if more than 50% of those come from <1% of pixels, then it is considered to be noise-dominated and hence unusable.
| Quadrant | # 1 sec bins | Bins with >0 counts | Bins with >2000 counts | High rate bins dominated by noise | Noise dominated (total time) | Noise dominated (detector-on time) | Marked lightcurve |
|---|---|---|---|---|---|---|---|
| A | 7224 | 5072 | 8 | 8 | 0.11% | 0.16% | 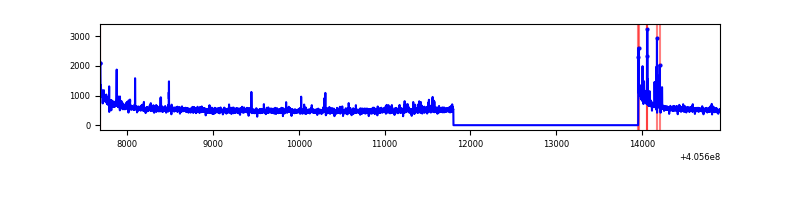 |
| B | 7224 | 5072 | 125 | 125 | 1.73% | 2.46% | 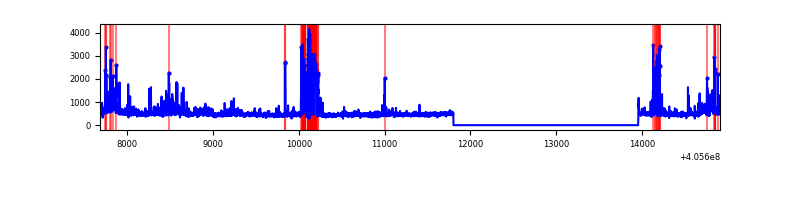 |
| C | 7224 | 5072 | 7 | 7 | 0.10% | 0.14% | 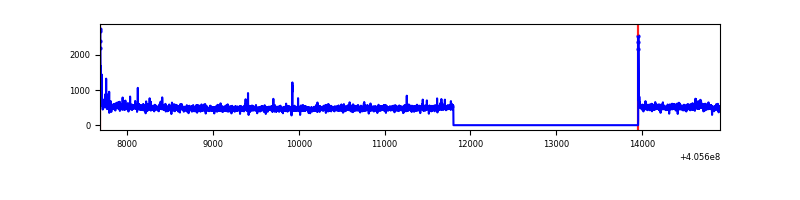 |
| D | 7224 | 5072 | 260 | 260 | 3.60% | 5.13% | 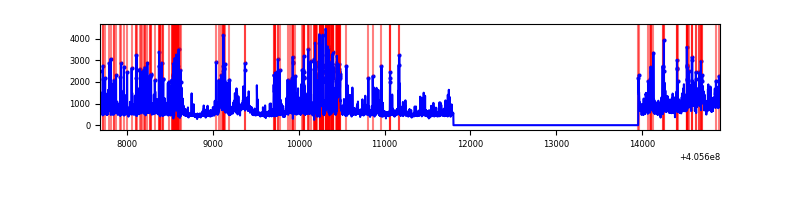 |
Top three noisy pixels from each quadrant. If the there are fewer than three noisy pixels in the level2.evt file, extra rows are filled as -1
| Pixel properties | Quadrant properties | ||||||
|---|---|---|---|---|---|---|---|
| Quadrant | DetID | PixID | Counts | Sigma | Mean | Median | Sigma |
| A | 10 | 83 | 399528 | 3390.33 | 584 | 574 | 117.7 |
| A | 9 | 143 | 56198 | 472.7 | 584 | 574 | 117.7 |
| A | 12 | 189 | 23697 | 196.5 | 584 | 574 | 117.7 |
| B | 5 | 184 | 472240 | 4360.22 | 573 | 557 | 108.2 |
| B | 4 | 232 | 80335 | 737.47 | 573 | 557 | 108.2 |
| B | 0 | 183 | 78051 | 716.35 | 573 | 557 | 108.2 |
| C | 15 | 214 | 213488 | 1619.63 | 570 | 575 | 131.5 |
| C | 0 | 10 | 36192 | 270.94 | 570 | 575 | 131.5 |
| C | 1 | 23 | 17986 | 132.45 | 570 | 575 | 131.5 |
| D | 13 | 249 | 917945 | 6807.37 | 563 | 547 | 134.8 |
| D | 12 | 235 | 738026 | 5472.32 | 563 | 547 | 134.8 |
| D | 12 | 227 | 140037 | 1035.06 | 563 | 547 | 134.8 |
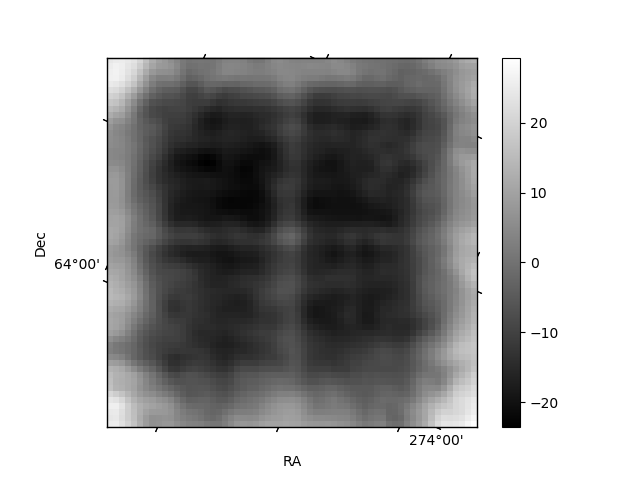
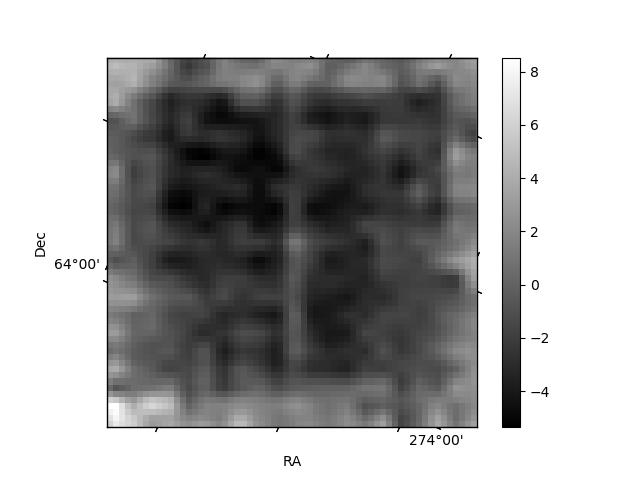
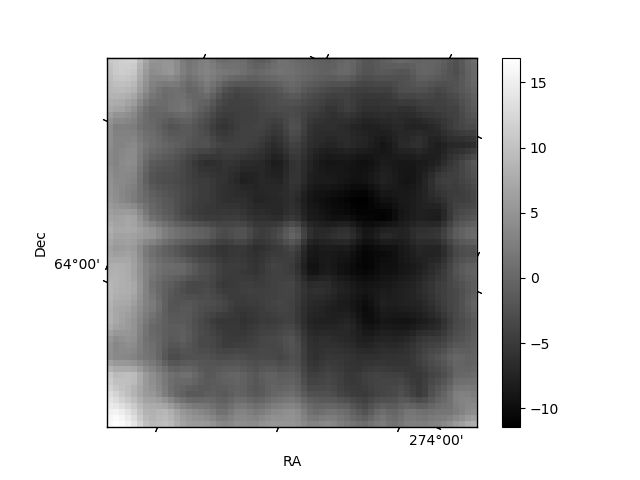
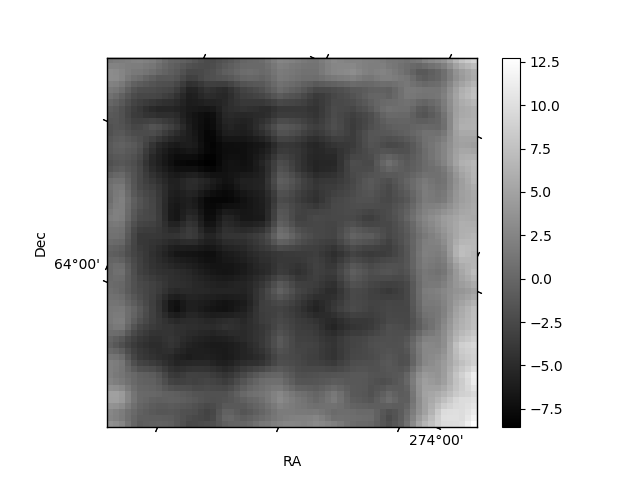
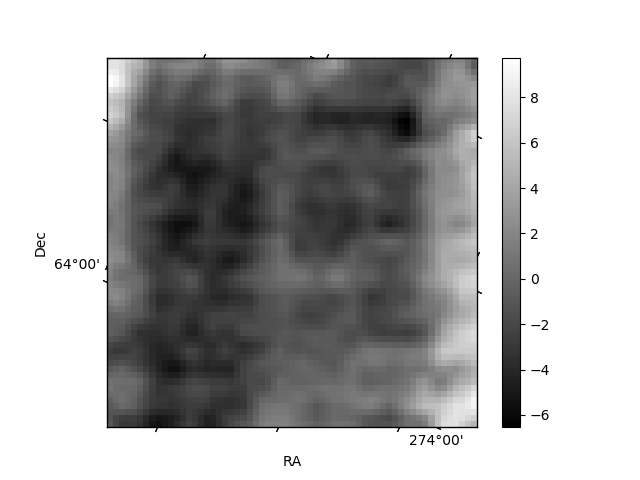
Histogram calculated using DETX and DETY for each event in the final _common_clean file
| Quadrant A | 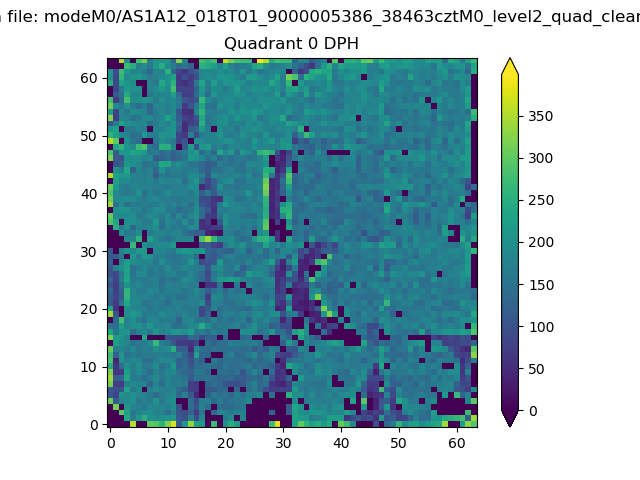 |
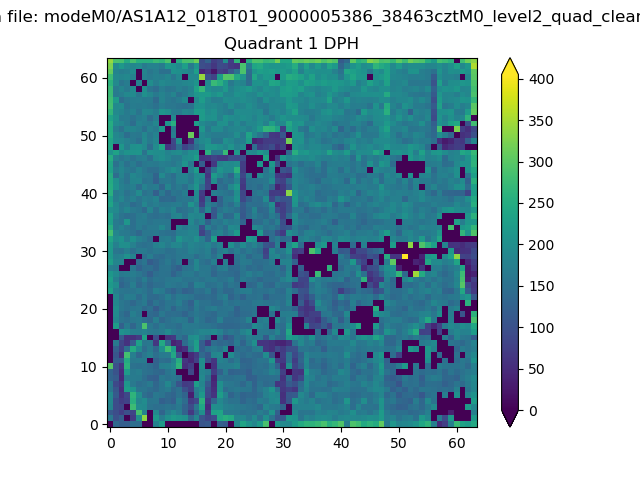 |
Quadrant B |
|---|---|---|---|
| Quadrant D | 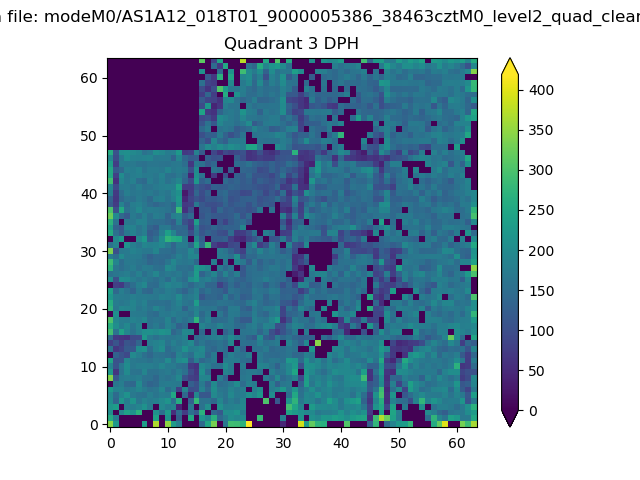 |
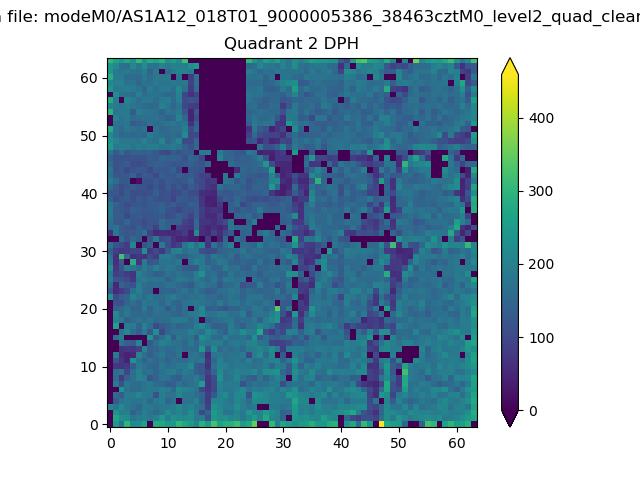 |
Quadrant C |
| Plot type | Count rate plots | Images |
|---|---|---|
| Comparison with Poisson distribution Blue bars denote a histogram of data divided into 1 sec bins. Red curve is a Poisson curve with rate = median count rate of data. |
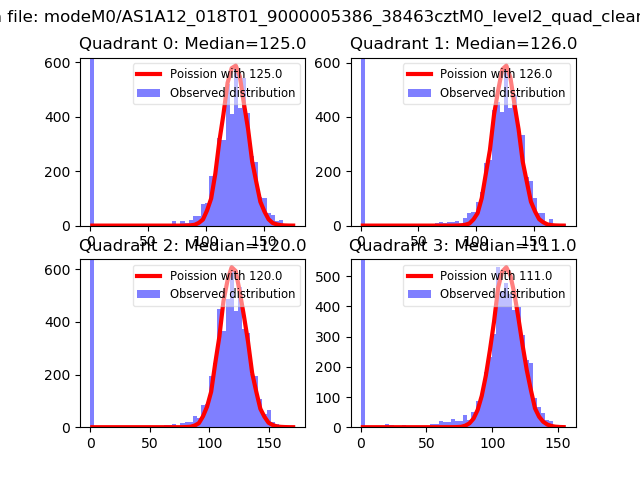 |
 |
| Quadrant-wise count rates Data is divided into 100 sec bins |
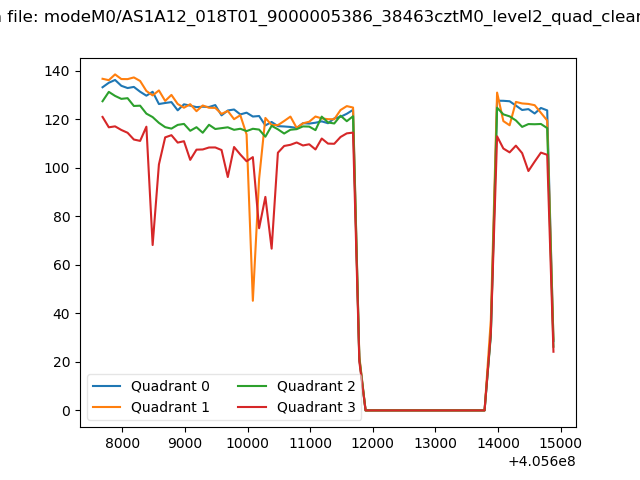 |
|
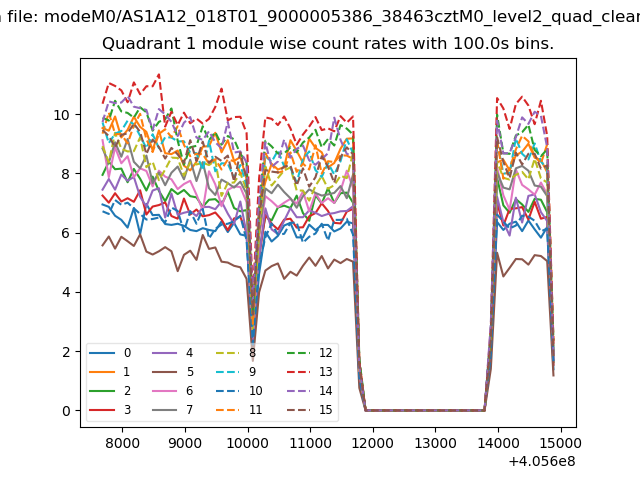
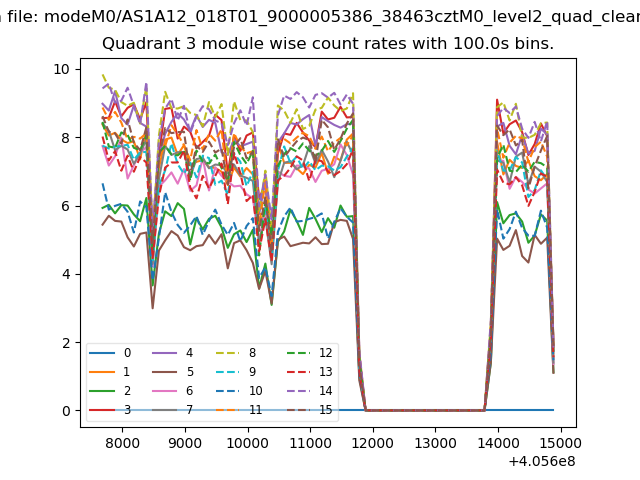
| Module-wise count rates for Quadrant A Data is divided into 100 sec bins |
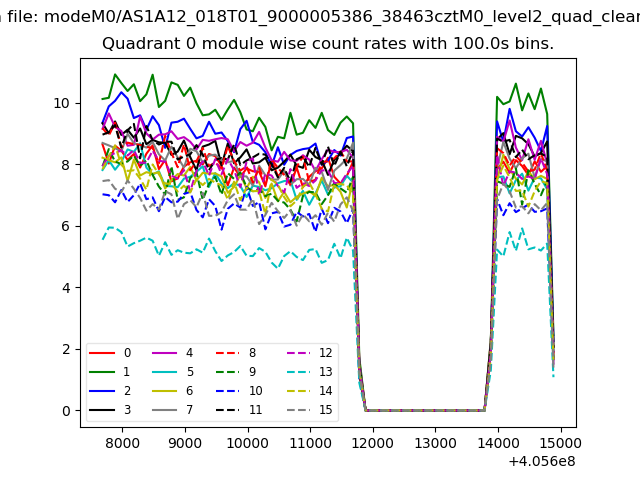 |
 |
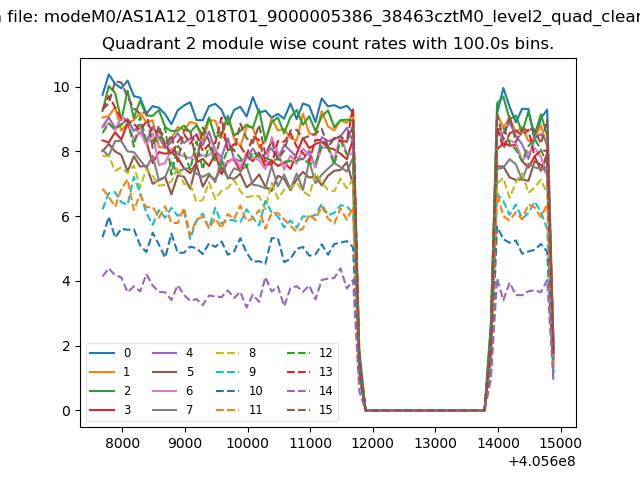
| Module-wise count rates for Quadrant B Data is divided into 100 sec bins |
 |
 |
| Module-wise count rates for Quadrant C Data is divided into 100 sec bins |
 |
 |
| Module-wise count rates for Quadrant D Data is divided into 100 sec bins |
 |
 |
| Parameter | Plot |
|---|---|
| CZT HV Monitor | 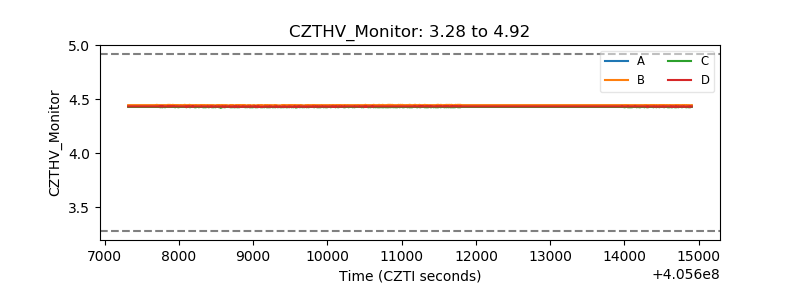 |
| D_VDD | 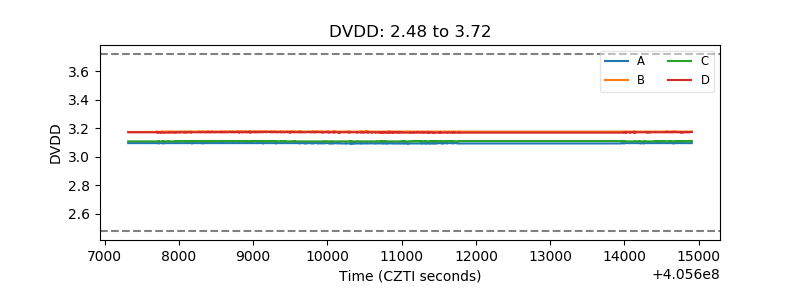 |
| Temperature 1 | 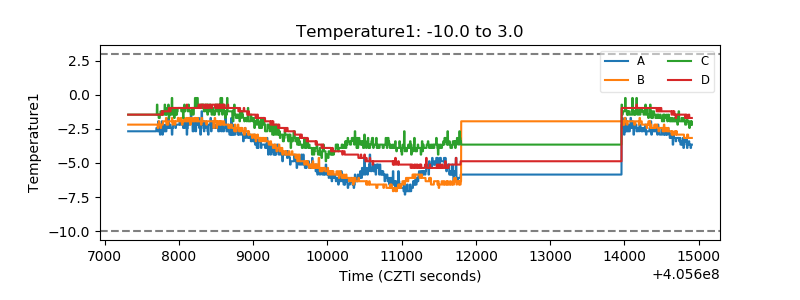 |
| Veto HV Monitor | 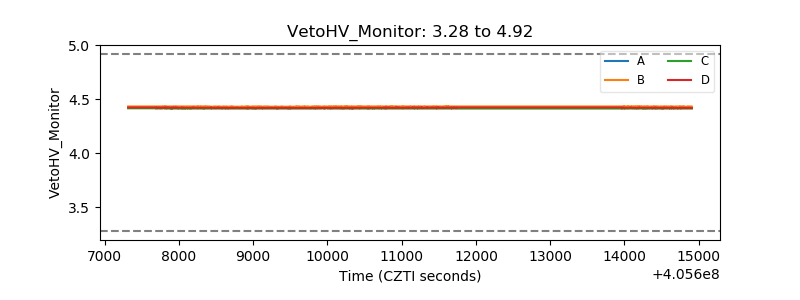 |
| Veto LLD | 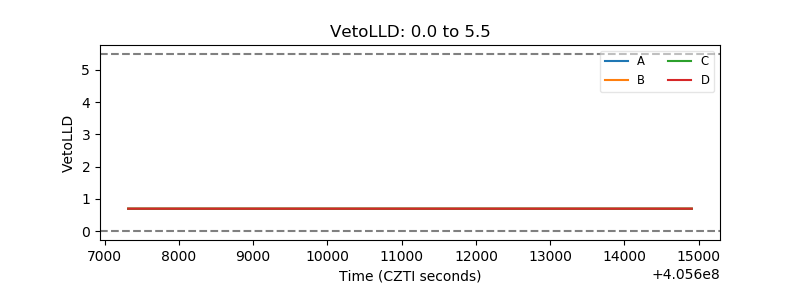 |
| Alpha Counter | 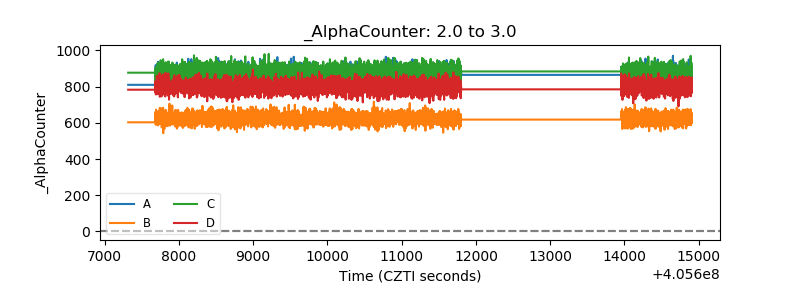 |
| _CPM_Rate | 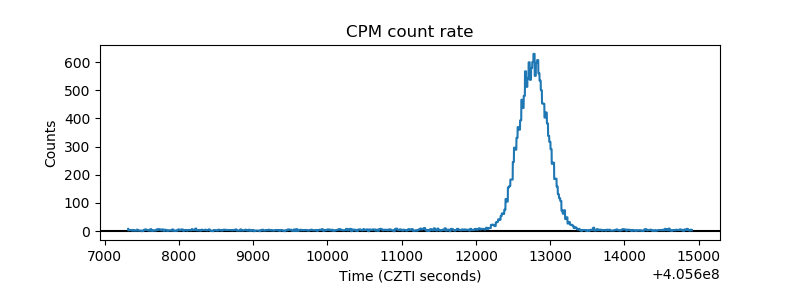 |
| CZT Counter | 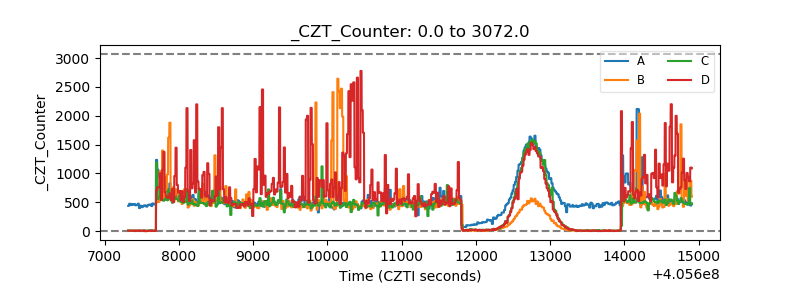 |
| +2.5 Volts monitor | 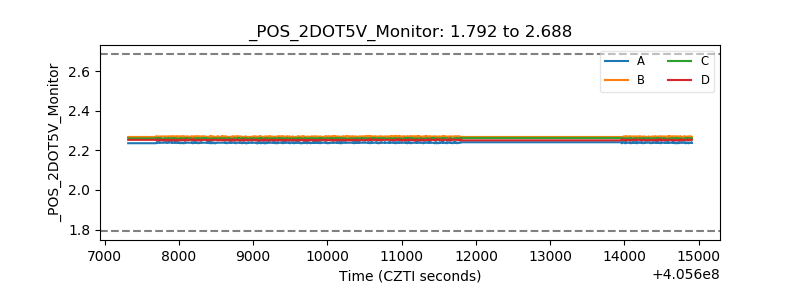 |
| +5 Volts monitor | 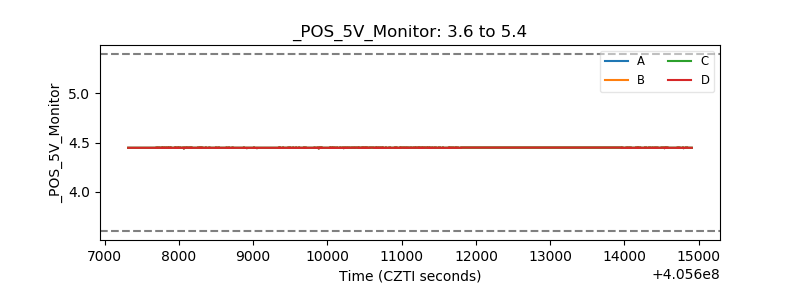 |
| _ROLL_ROT | 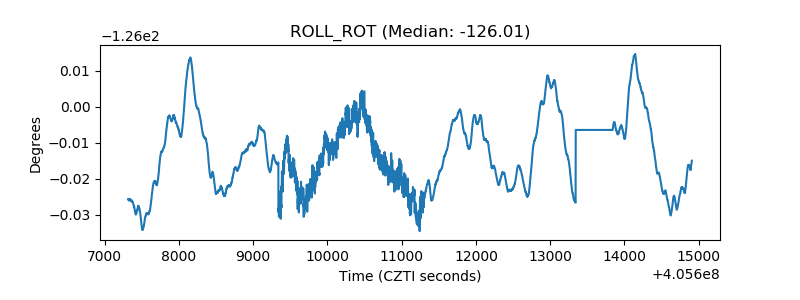 |
| _Roll_DEC | 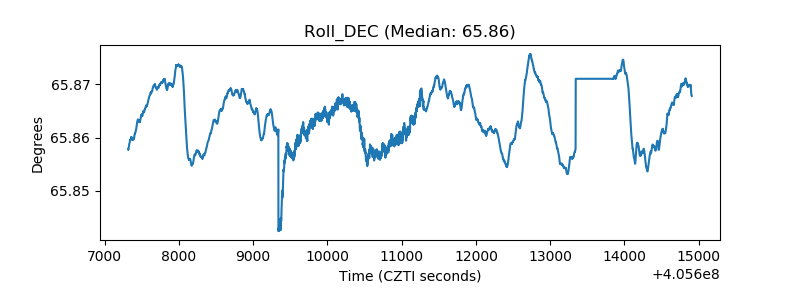 |
| _Roll_RA | 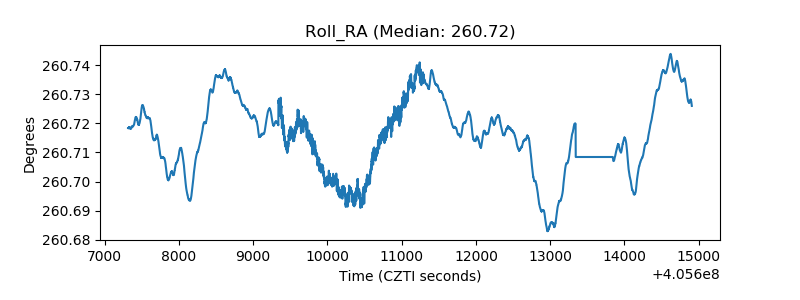 |
| Veto Counter | 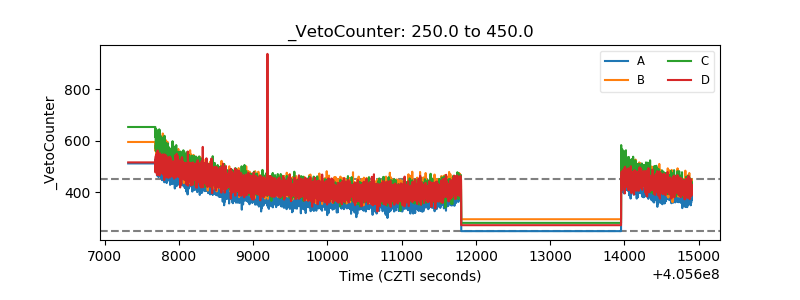 |