| Param | Original file | Final file |
|---|---|---|
| Filename | modeM0/AS1A12_018T01_9000005386_38464cztM0_level2.fits | modeM0/AS1A12_018T01_9000005386_38464cztM0_level2_quad_clean.evt |
| Size (bytes) | 459,420,480 | 83,096,640 |
| Size | 438.1 MB | 79.2 MB |
| Events in quadrant A | 2,870,980 | 610,413 |
| Events in quadrant B | 2,746,569 | 613,928 |
| Events in quadrant C | 2,553,967 | 587,480 |
| Events in quadrant D | 8,433,898 | 343,557 |
| Mode SS | |||
|---|---|---|---|
| Quadrant | BADHDUFLAG | Total packets | Discarded packets |
| A | 0 | 104 | 0 |
| B | 0 | 104 | 0 |
| C | 0 | 104 | 0 |
| D | 0 | 104 | 0 |
| Mode M9 | |||
|---|---|---|---|
| Quadrant | BADHDUFLAG | Total packets | Discarded packets |
| A | 0 | 21 | 0 |
| B | 0 | 21 | 0 |
| C | 0 | 21 | 0 |
| D | 0 | 22 | 0 |
| Mode M0 | |||
|---|---|---|---|
| Quadrant | BADHDUFLAG | Total packets | Discarded packets |
| A | 0 | 11627 | 3 |
| B | 0 | 11520 | 2 |
| C | 0 | 10636 | 2 |
| D | 0 | 28558 | 2 |
| Quadrant | Total seconds | Saturated seconds | Saturation percentage |
|---|---|---|---|
| A | 5151 | 45 | 0.873617% |
| B | 5151 | 56 | 1.087168% |
| C | 5151 | 13 | 0.252378% |
| D | 5151 | 2095 | 40.671714% |
Noise dominated data is calculated using 1-second bins in cleaned event files. If a bin has >2000 counts, and if more than 50% of those come from <1% of pixels, then it is considered to be noise-dominated and hence unusable.
| Quadrant | # 1 sec bins | Bins with >0 counts | Bins with >2000 counts | High rate bins dominated by noise | Noise dominated (total time) | Noise dominated (detector-on time) | Marked lightcurve |
|---|---|---|---|---|---|---|---|
| A | 7215 | 5152 | 32 | 32 | 0.44% | 0.62% | 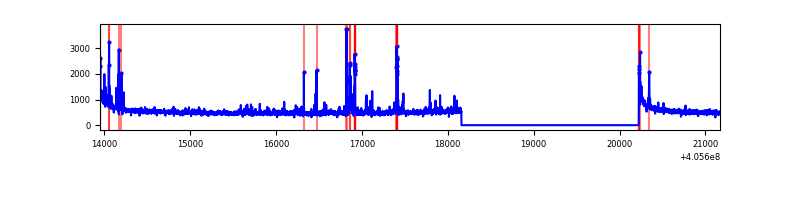 |
| B | 7215 | 5152 | 37 | 37 | 0.51% | 0.72% | 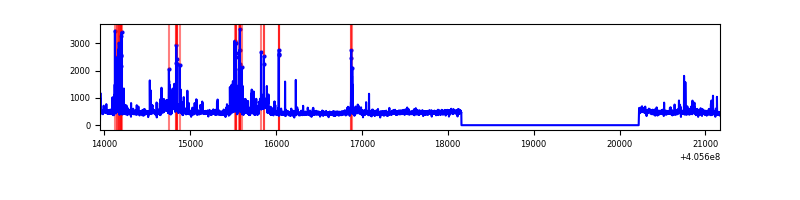 |
| C | 7215 | 5152 | 7 | 7 | 0.10% | 0.14% | 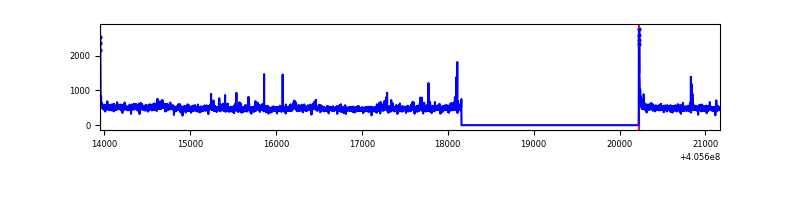 |
| D | 7215 | 5152 | 2040 | 2040 | 28.27% | 39.60% | 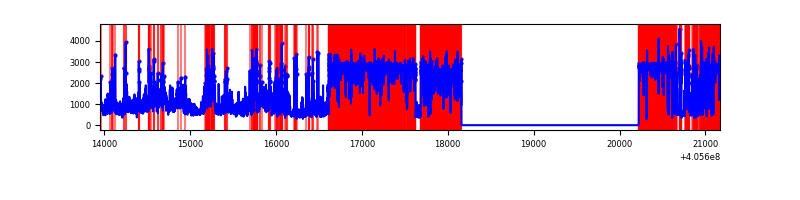 |
Top three noisy pixels from each quadrant. If the there are fewer than three noisy pixels in the level2.evt file, extra rows are filled as -1
| Pixel properties | Quadrant properties | ||||||
|---|---|---|---|---|---|---|---|
| Quadrant | DetID | PixID | Counts | Sigma | Mean | Median | Sigma |
| A | 10 | 83 | 398282 | 3421.93 | 573 | 561 | 116.2 |
| A | 12 | 189 | 111869 | 957.68 | 573 | 561 | 116.2 |
| A | 9 | 143 | 101369 | 867.34 | 573 | 561 | 116.2 |
| B | 5 | 184 | 258283 | 2375.03 | 570 | 554 | 108.5 |
| B | 4 | 232 | 66938 | 611.74 | 570 | 554 | 108.5 |
| B | 0 | 230 | 38520 | 349.86 | 570 | 554 | 108.5 |
| C | 15 | 214 | 216979 | 1650.61 | 566 | 569 | 131.1 |
| C | 1 | 23 | 41318 | 310.8 | 566 | 569 | 131.1 |
| C | 0 | 10 | 34318 | 257.41 | 566 | 569 | 131.1 |
| D | 12 | 227 | 5260870 | 47453.39 | 455 | 442 | 110.9 |
| D | 12 | 235 | 791790 | 7138.61 | 455 | 442 | 110.9 |
| D | 13 | 249 | 355935 | 3206.84 | 455 | 442 | 110.9 |
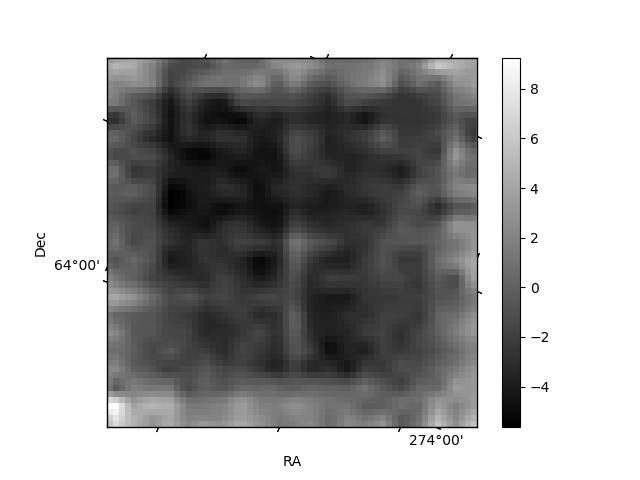
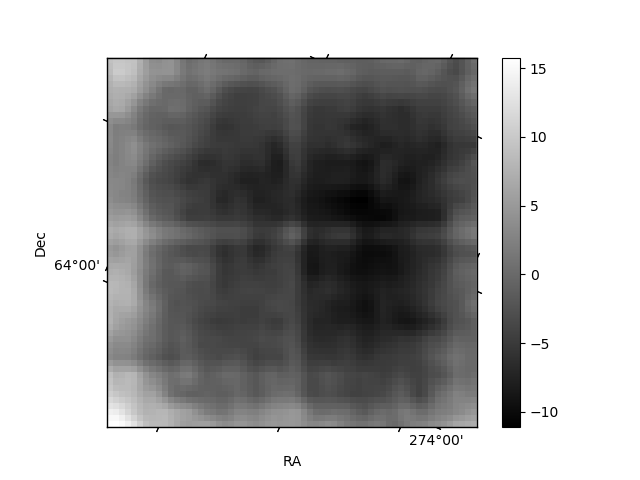
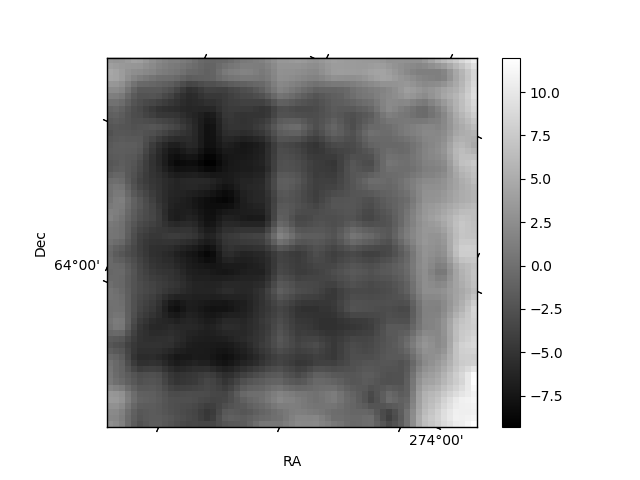
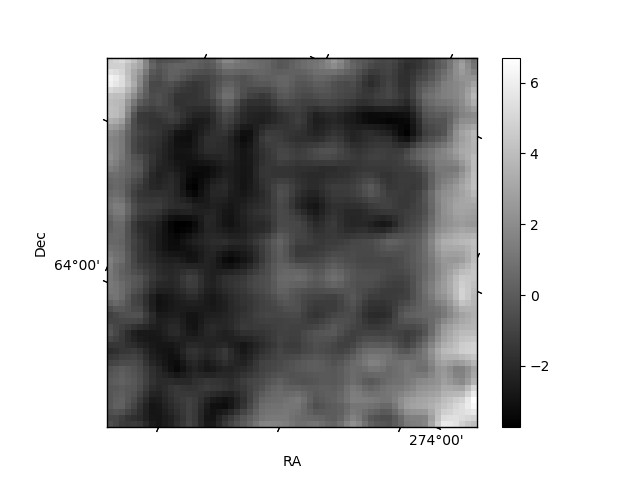
Histogram calculated using DETX and DETY for each event in the final _common_clean file
| Quadrant A | 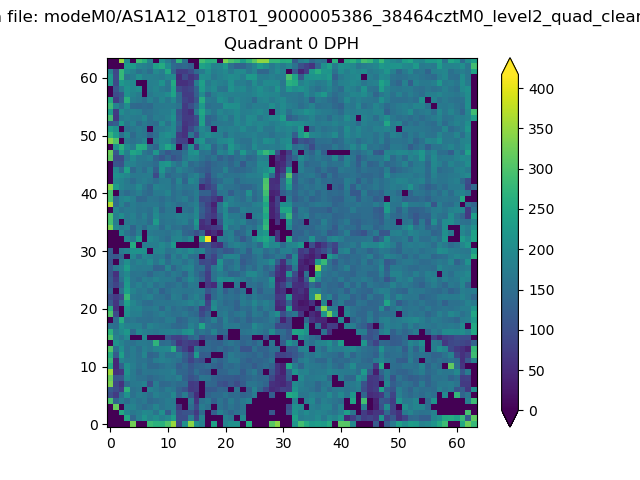 |
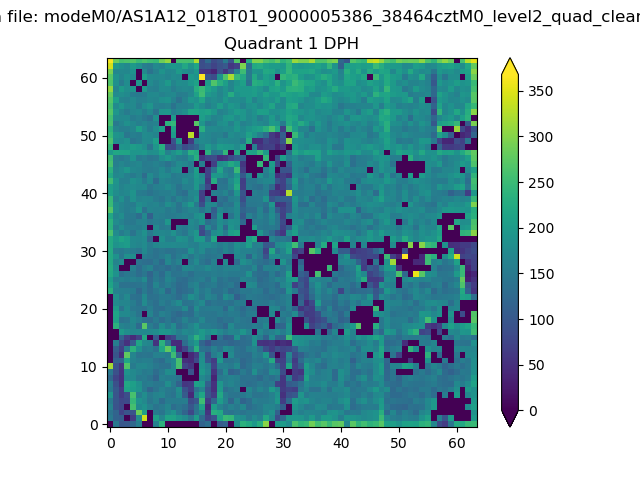 |
Quadrant B |
|---|---|---|---|
| Quadrant D | 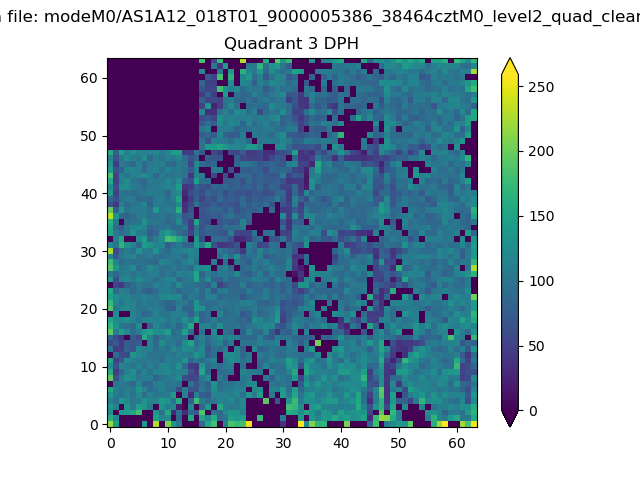 |
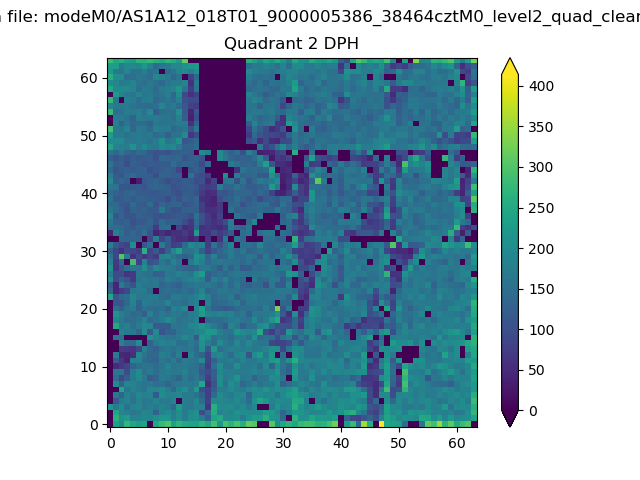 |
Quadrant C |
| Plot type | Count rate plots | Images |
|---|---|---|
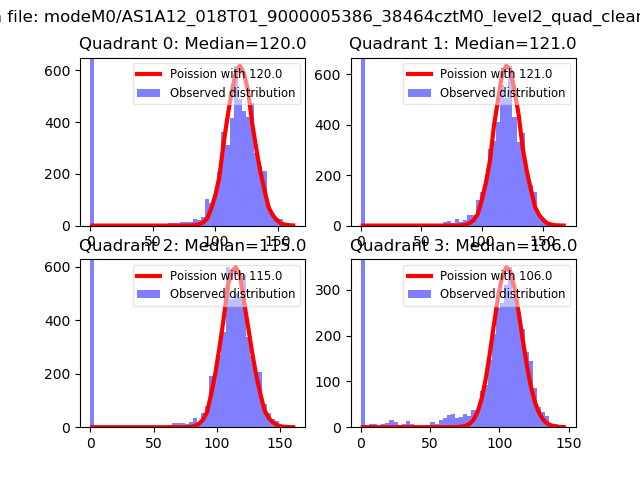
| Comparison with Poisson distribution Blue bars denote a histogram of data divided into 1 sec bins. Red curve is a Poisson curve with rate = median count rate of data. |
 |
 |
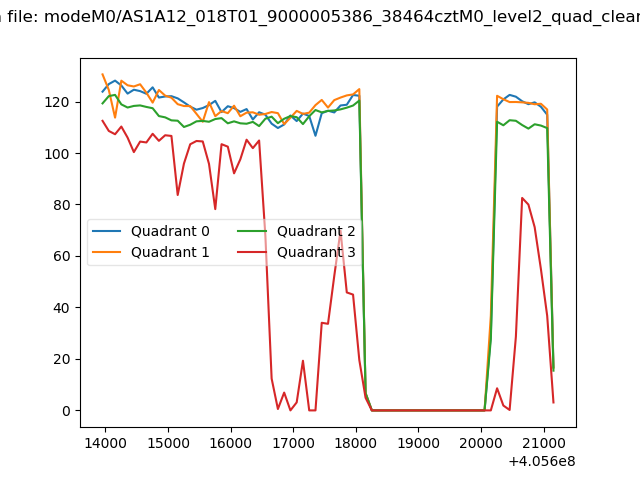
| Quadrant-wise count rates Data is divided into 100 sec bins |
 |
|
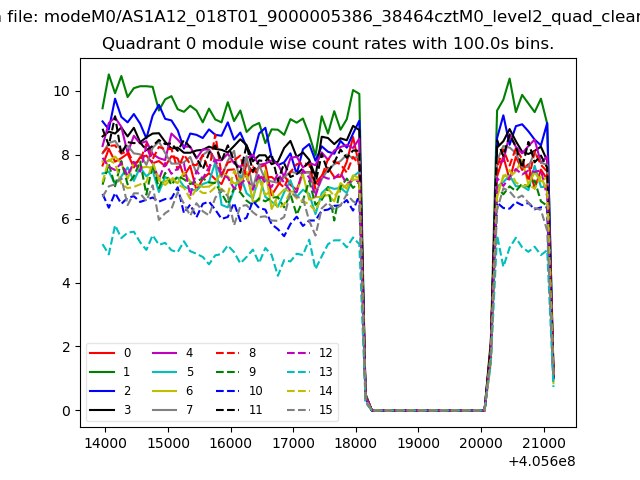
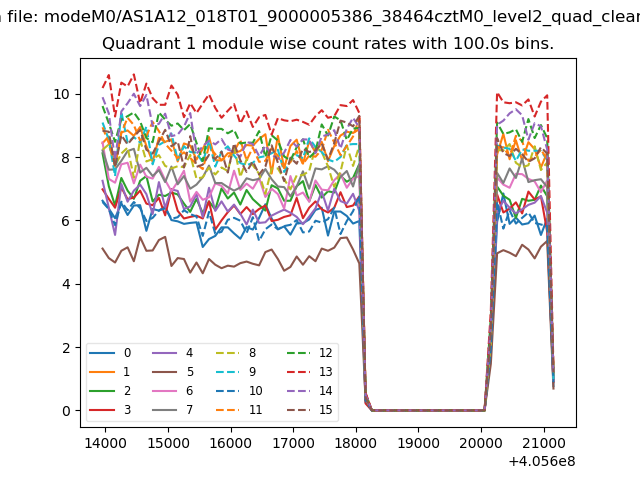
| Module-wise count rates for Quadrant A Data is divided into 100 sec bins |
 |
 |
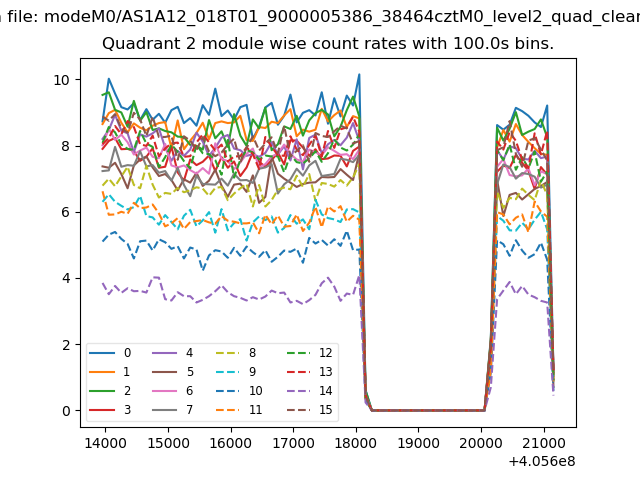
| Module-wise count rates for Quadrant B Data is divided into 100 sec bins |
 |
 |
| Module-wise count rates for Quadrant C Data is divided into 100 sec bins |
 |
 |
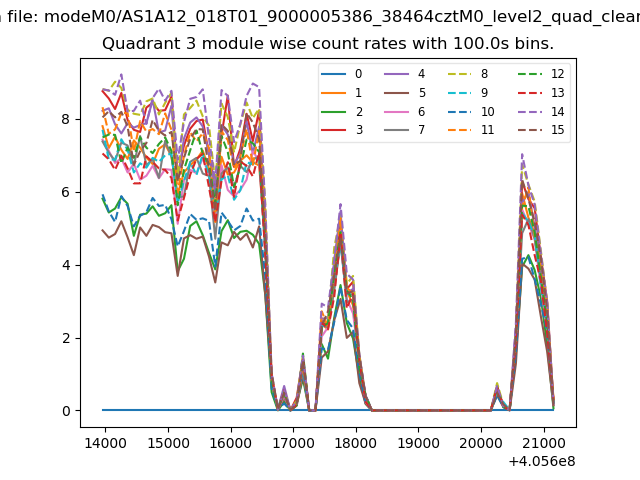
| Module-wise count rates for Quadrant D Data is divided into 100 sec bins |
 |
 |
| Parameter | Plot |
|---|---|
| CZT HV Monitor | 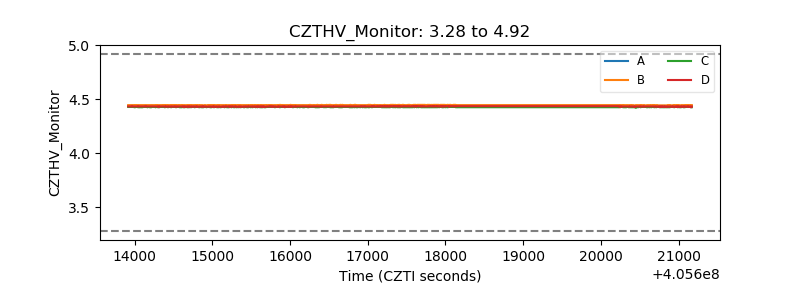 |
| D_VDD | 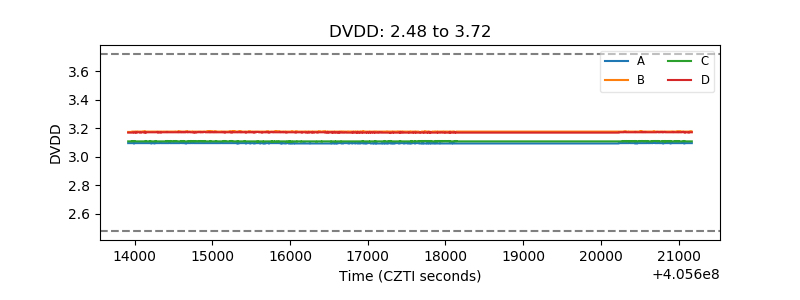 |
| Temperature 1 | 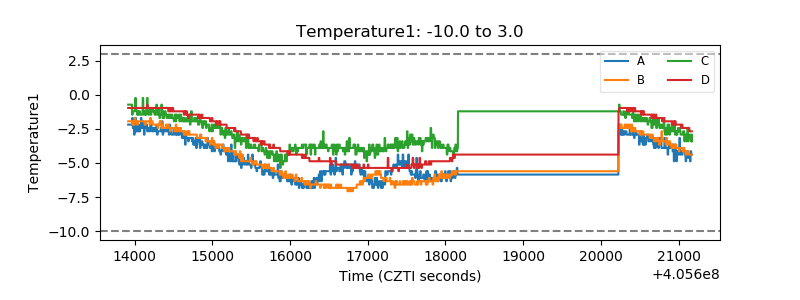 |
| Veto HV Monitor | 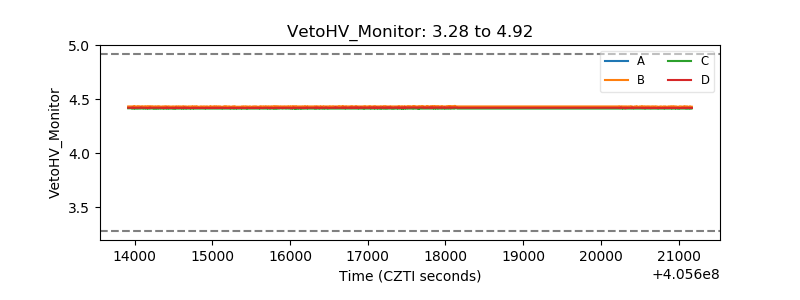 |
| Veto LLD | 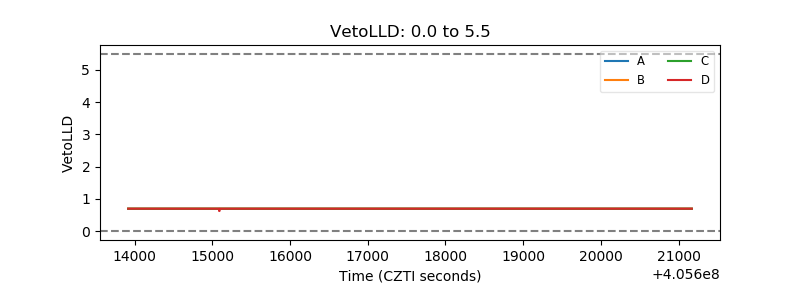 |
| Alpha Counter | 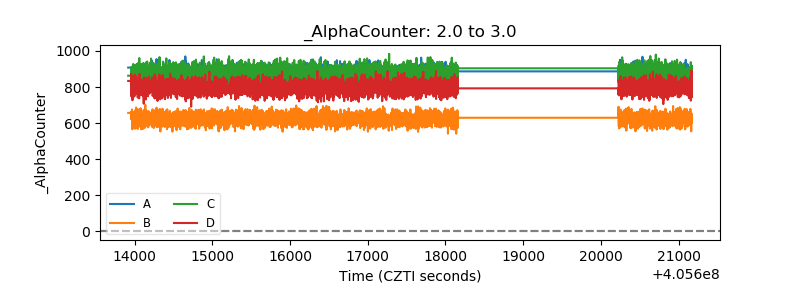 |
| _CPM_Rate | 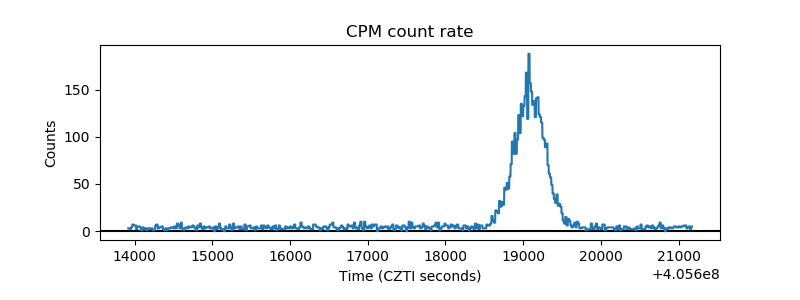 |
| CZT Counter | 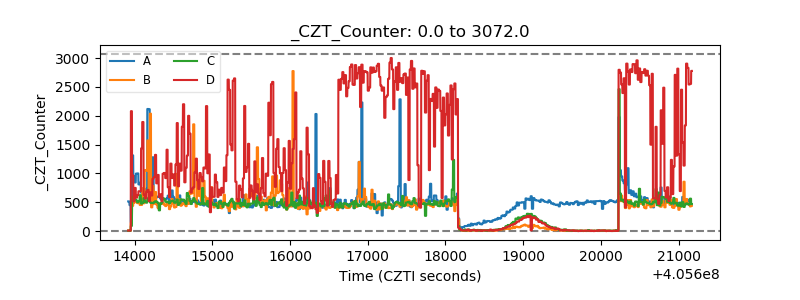 |
| +2.5 Volts monitor | 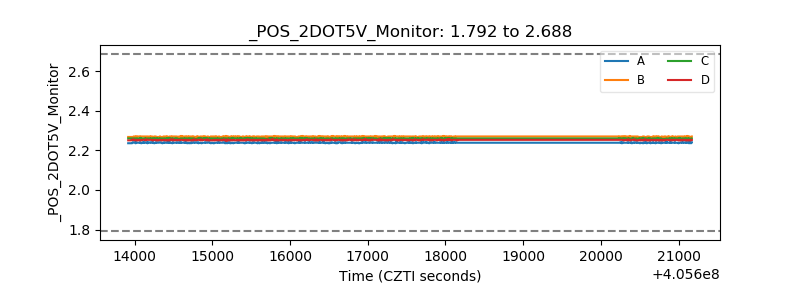 |
| +5 Volts monitor |  |
| _ROLL_ROT | 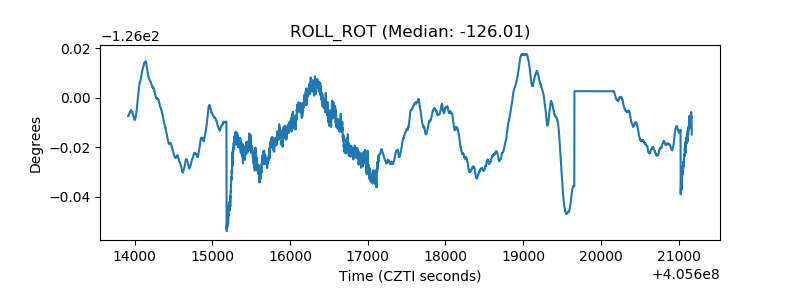 |
| _Roll_DEC | 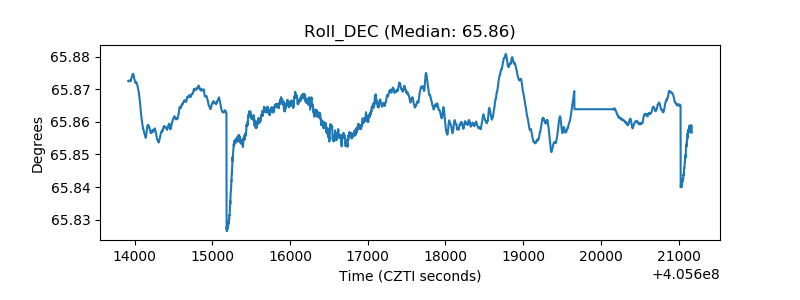 |
| _Roll_RA | 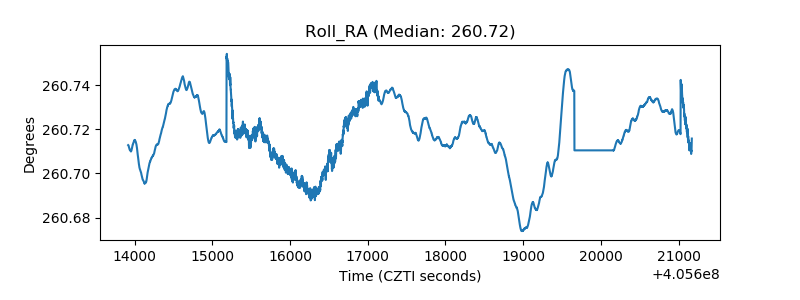 |
| Veto Counter | 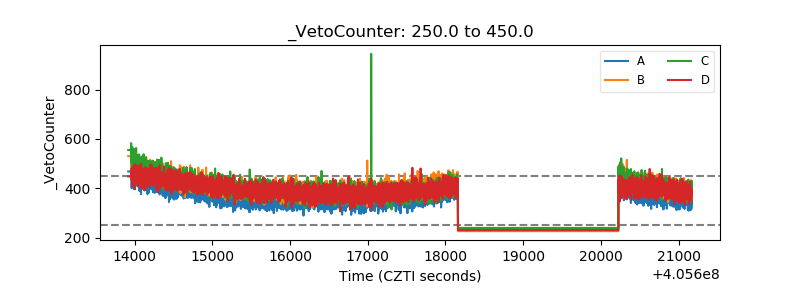 |