| Param | Original file | Final file |
|---|---|---|
| Filename | modeM0/AS1A12_018T01_9000005386_38465cztM0_level2.fits | modeM0/AS1A12_018T01_9000005386_38465cztM0_level2_quad_clean.evt |
| Size (bytes) | 449,732,160 | 82,517,760 |
| Size | 428.9 MB | 78.7 MB |
| Events in quadrant A | 2,812,703 | 603,123 |
| Events in quadrant B | 2,509,653 | 608,255 |
| Events in quadrant C | 2,531,941 | 580,608 |
| Events in quadrant D | 8,383,028 | 337,792 |
| Mode SS | |||
|---|---|---|---|
| Quadrant | BADHDUFLAG | Total packets | Discarded packets |
| A | 0 | 106 | 0 |
| B | 0 | 106 | 0 |
| C | 0 | 106 | 0 |
| D | 0 | 106 | 0 |
| Mode M9 | |||
|---|---|---|---|
| Quadrant | BADHDUFLAG | Total packets | Discarded packets |
| A | 0 | 18 | 0 |
| B | 0 | 18 | 0 |
| C | 0 | 18 | 0 |
| D | 0 | 19 | 0 |
| Mode M0 | |||
|---|---|---|---|
| Quadrant | BADHDUFLAG | Total packets | Discarded packets |
| A | 0 | 11610 | 3 |
| B | 0 | 10988 | 2 |
| C | 0 | 10796 | 2 |
| D | 0 | 28480 | 2 |
| Quadrant | Total seconds | Saturated seconds | Saturation percentage |
|---|---|---|---|
| A | 5270 | 31 | 0.588235% |
| B | 5270 | 15 | 0.284630% |
| C | 5270 | 15 | 0.284630% |
| D | 5270 | 2198 | 41.707780% |
Noise dominated data is calculated using 1-second bins in cleaned event files. If a bin has >2000 counts, and if more than 50% of those come from <1% of pixels, then it is considered to be noise-dominated and hence unusable.
| Quadrant | # 1 sec bins | Bins with >0 counts | Bins with >2000 counts | High rate bins dominated by noise | Noise dominated (total time) | Noise dominated (detector-on time) | Marked lightcurve |
|---|---|---|---|---|---|---|---|
| A | 7063 | 5271 | 17 | 17 | 0.24% | 0.32% | 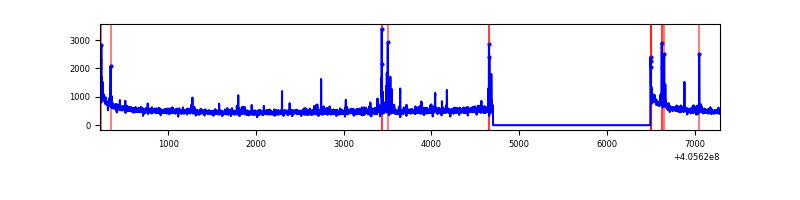 |
| B | 7063 | 5271 | 4 | 4 | 0.06% | 0.08% | 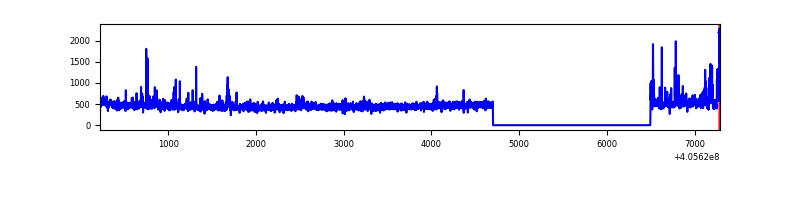 |
| C | 7063 | 5271 | 10 | 10 | 0.14% | 0.19% | 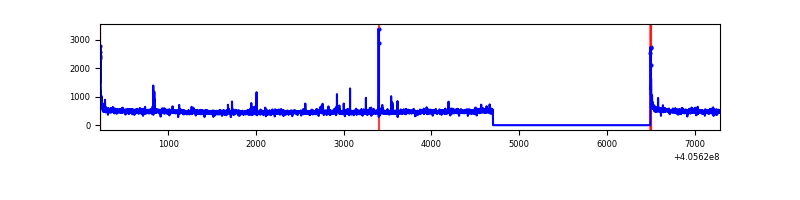 |
| D | 7062 | 5269 | 2139 | 2139 | 30.29% | 40.60% | 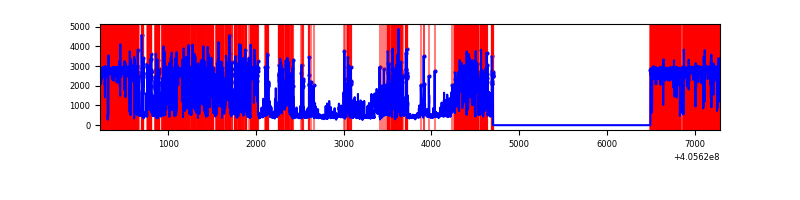 |
Top three noisy pixels from each quadrant. If the there are fewer than three noisy pixels in the level2.evt file, extra rows are filled as -1
| Pixel properties | Quadrant properties | ||||||
|---|---|---|---|---|---|---|---|
| Quadrant | DetID | PixID | Counts | Sigma | Mean | Median | Sigma |
| A | 10 | 83 | 396443 | 3359.33 | 578 | 566 | 117.8 |
| A | 9 | 143 | 84501 | 712.25 | 578 | 566 | 117.8 |
| A | 12 | 189 | 49888 | 418.54 | 578 | 566 | 117.8 |
| B | 5 | 184 | 139030 | 1243.81 | 578 | 560 | 111.3 |
| B | 0 | 155 | 27613 | 243.0 | 578 | 560 | 111.3 |
| B | 0 | 230 | 20327 | 177.56 | 578 | 560 | 111.3 |
| C | 15 | 214 | 220886 | 1659.22 | 568 | 572 | 132.8 |
| C | 0 | 10 | 40828 | 303.17 | 568 | 572 | 132.8 |
| C | 14 | 254 | 35310 | 261.62 | 568 | 572 | 132.8 |
| D | 12 | 227 | 5524489 | 51842.19 | 435 | 422 | 106.6 |
| D | 2 | 16 | 425172 | 3986.19 | 435 | 422 | 106.6 |
| D | 13 | 249 | 237492 | 2224.85 | 435 | 422 | 106.6 |
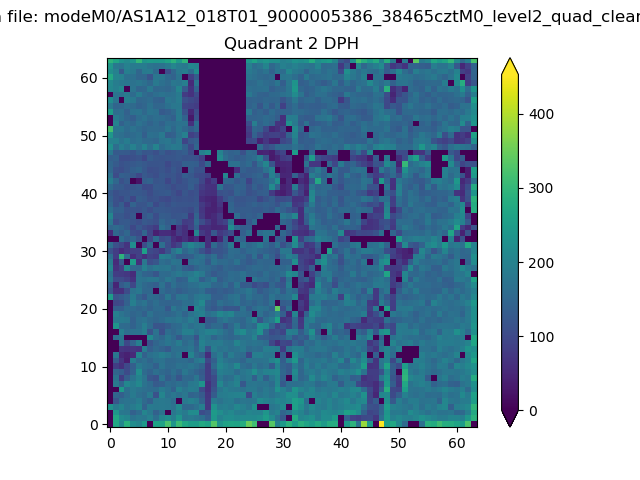
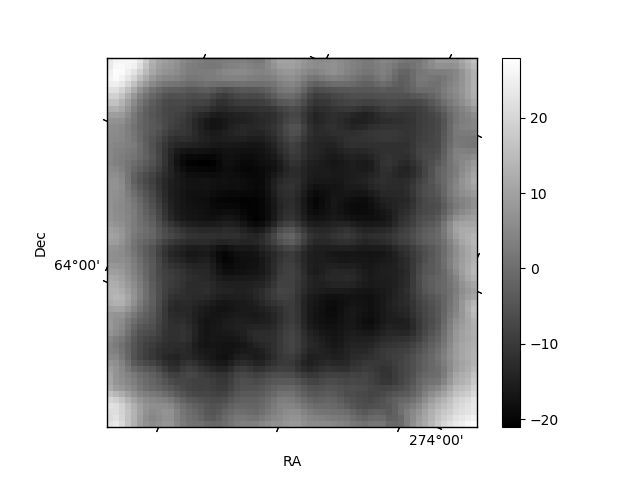
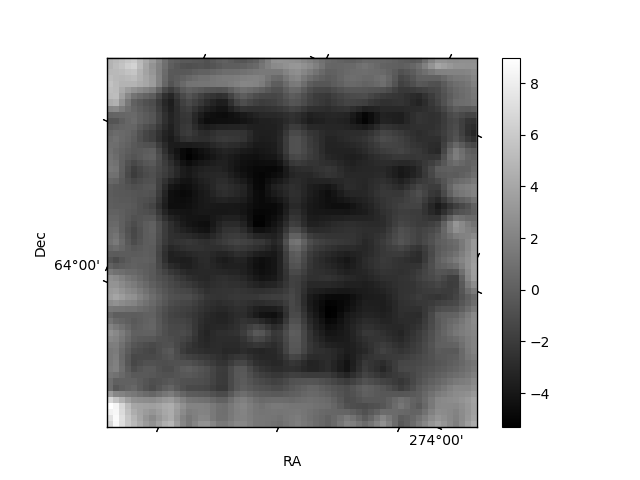
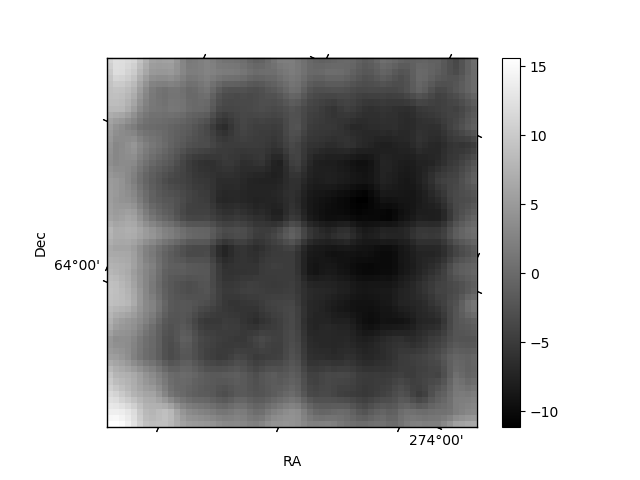
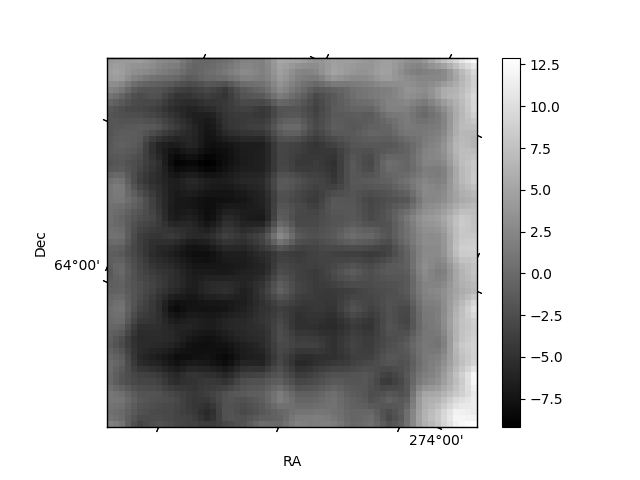
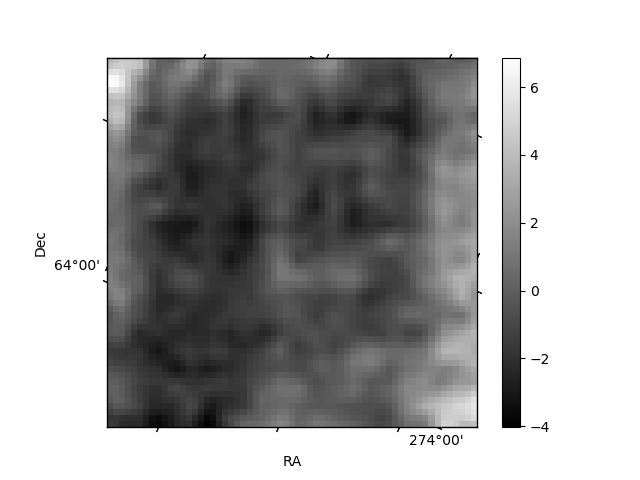
Histogram calculated using DETX and DETY for each event in the final _common_clean file
| Quadrant A | 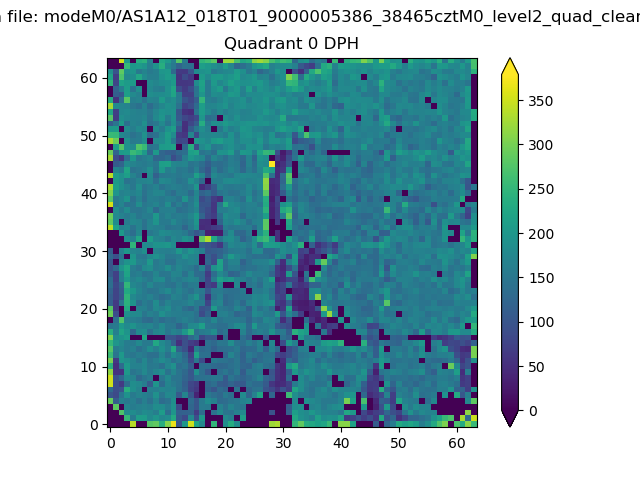 |
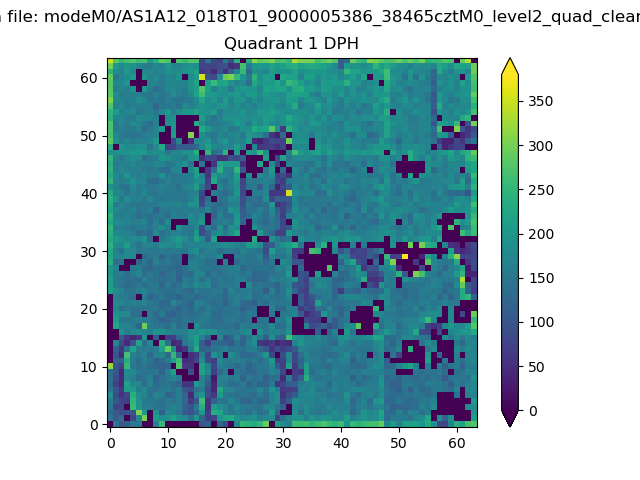 |
Quadrant B |
|---|---|---|---|
| Quadrant D | 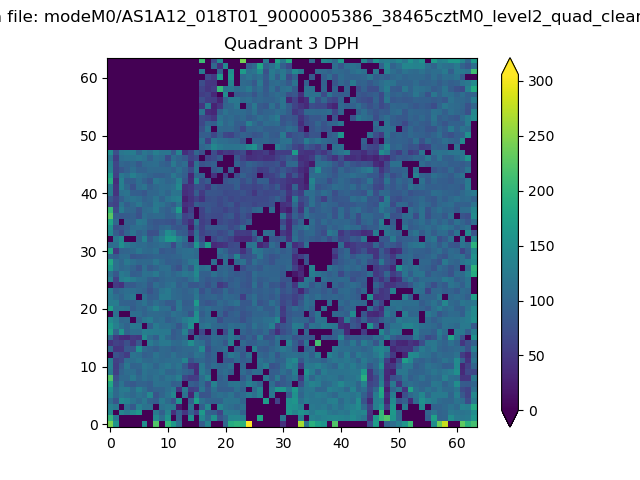 |
 |
Quadrant C |
| Plot type | Count rate plots | Images |
|---|---|---|
| Comparison with Poisson distribution Blue bars denote a histogram of data divided into 1 sec bins. Red curve is a Poisson curve with rate = median count rate of data. |
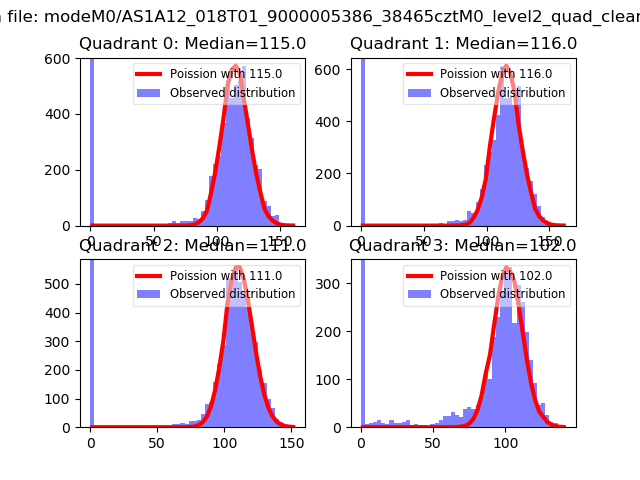 |
 |
| Quadrant-wise count rates Data is divided into 100 sec bins |
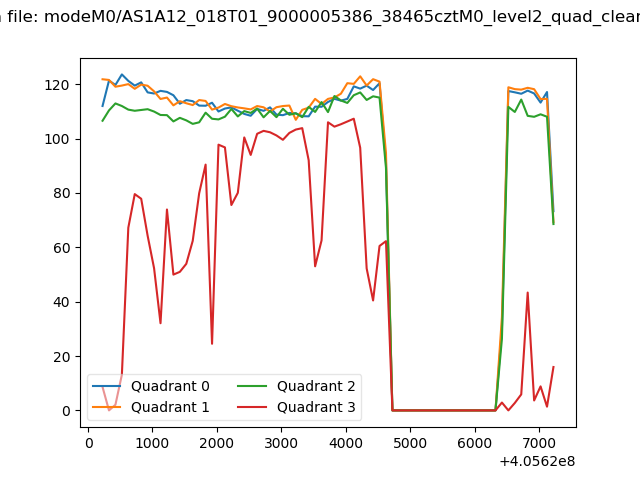 |
|
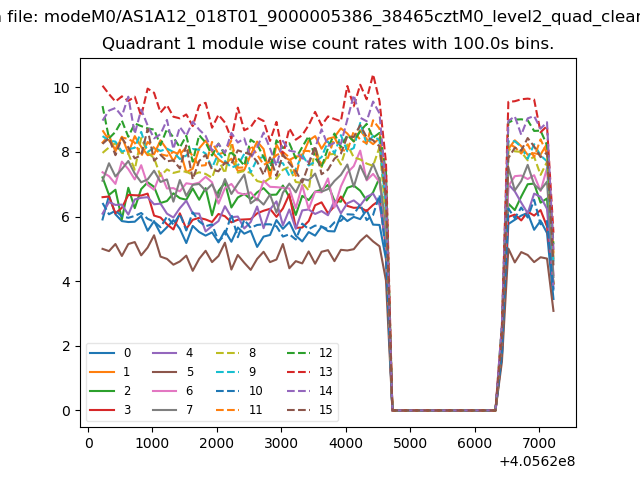
| Module-wise count rates for Quadrant A Data is divided into 100 sec bins |
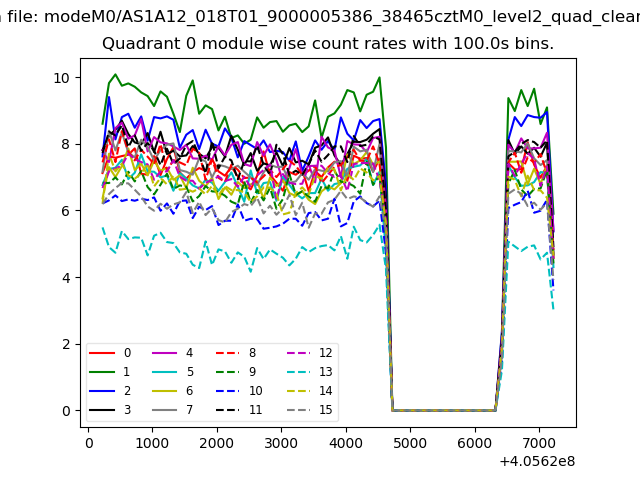 |
 |
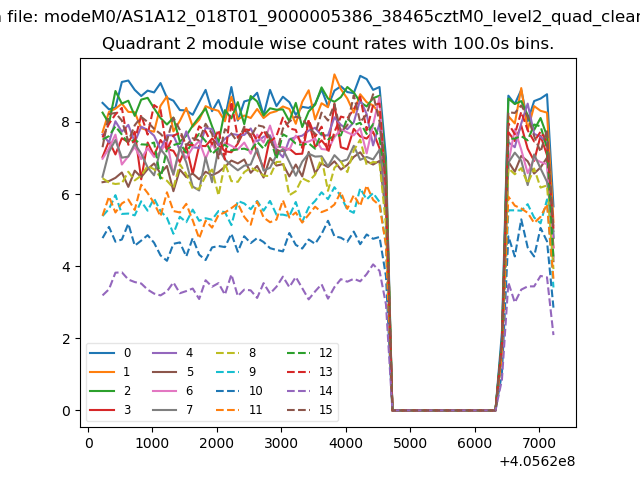
| Module-wise count rates for Quadrant B Data is divided into 100 sec bins |
 |
 |
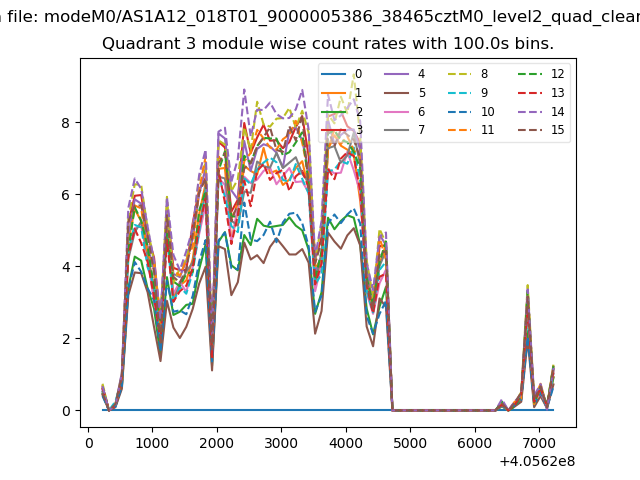
| Module-wise count rates for Quadrant C Data is divided into 100 sec bins |
 |
 |
| Module-wise count rates for Quadrant D Data is divided into 100 sec bins |
 |
 |
| Parameter | Plot |
|---|---|
| CZT HV Monitor | 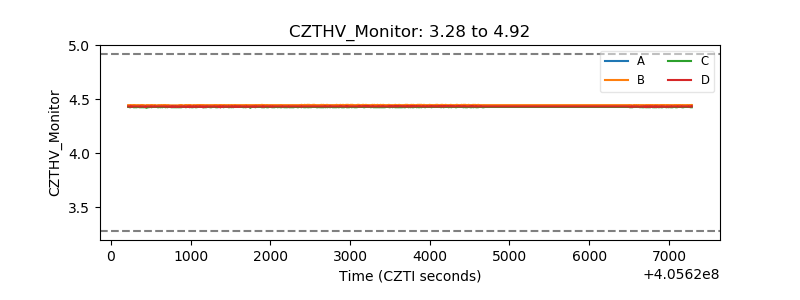 |
| D_VDD | 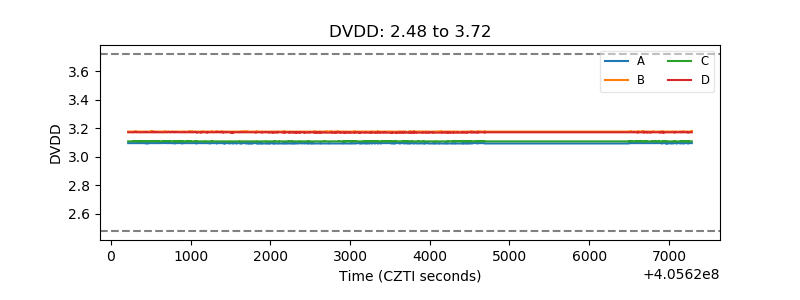 |
| Temperature 1 | 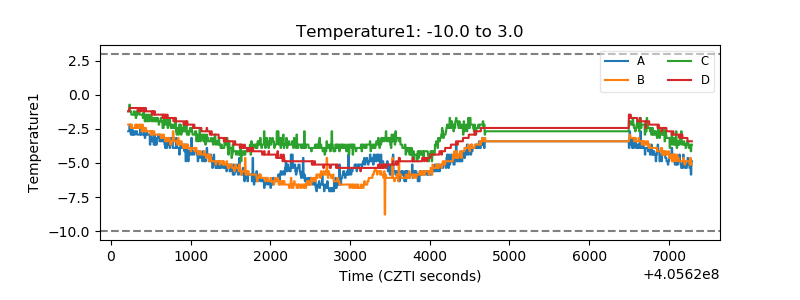 |
| Veto HV Monitor | 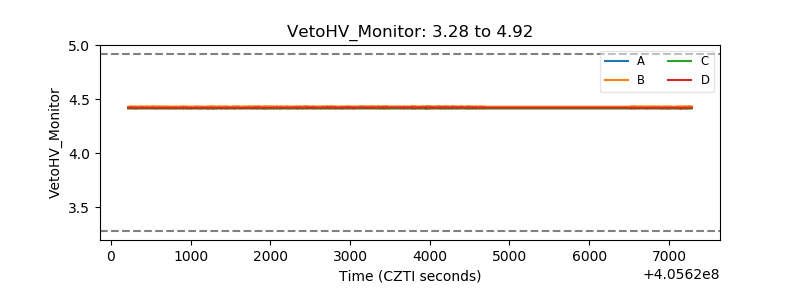 |
| Veto LLD | 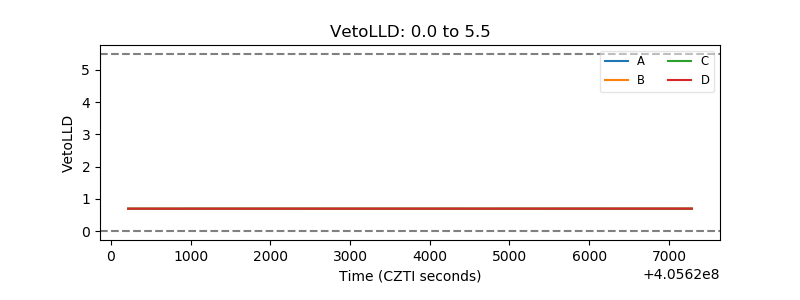 |
| Alpha Counter | 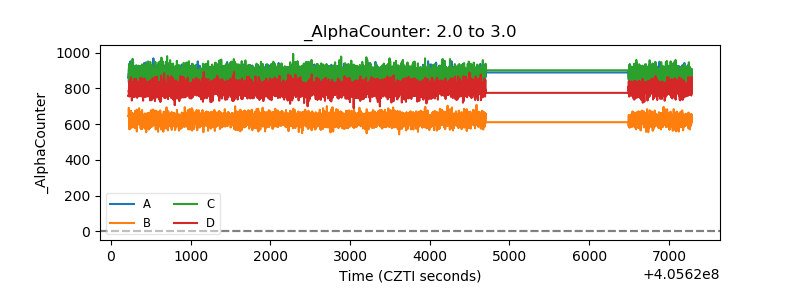 |
| _CPM_Rate | 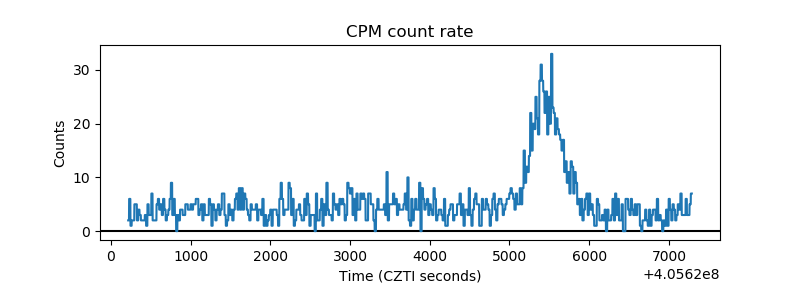 |
| CZT Counter | 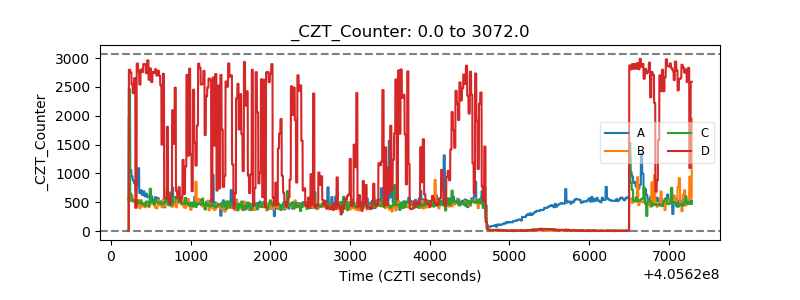 |
| +2.5 Volts monitor | 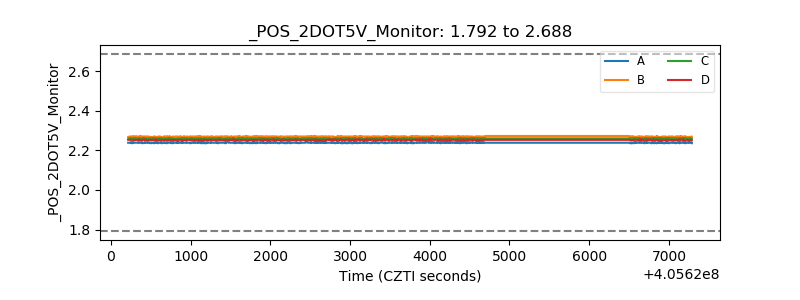 |
| +5 Volts monitor | 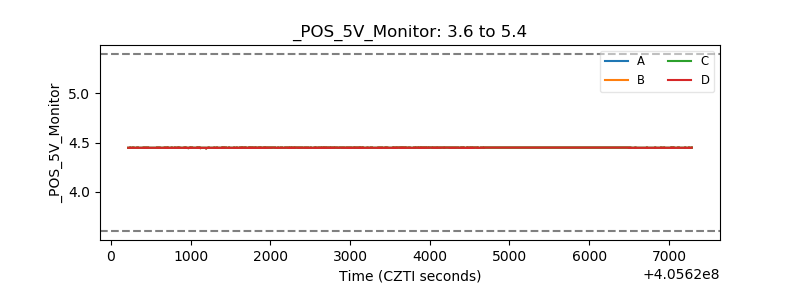 |
| _ROLL_ROT | 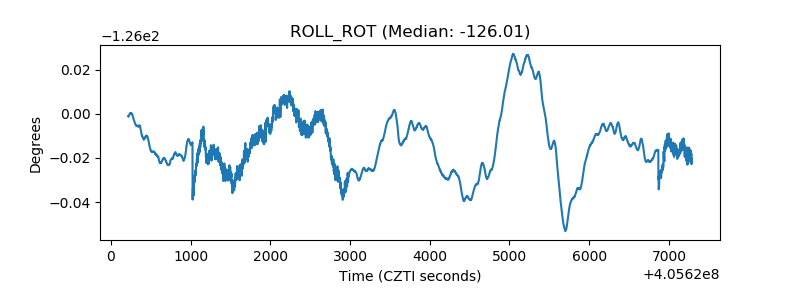 |
| _Roll_DEC | 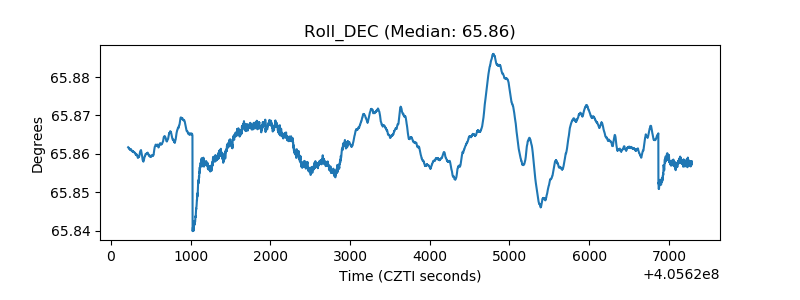 |
| _Roll_RA | 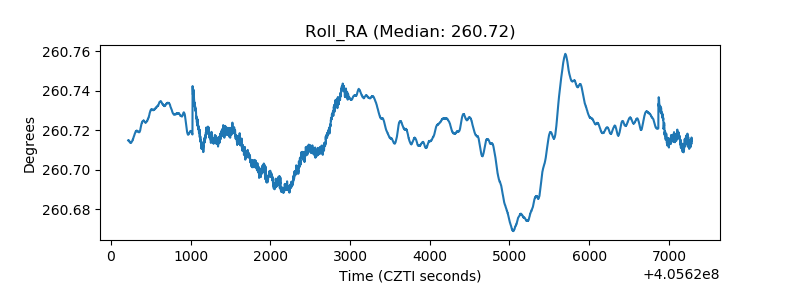 |
| Veto Counter | 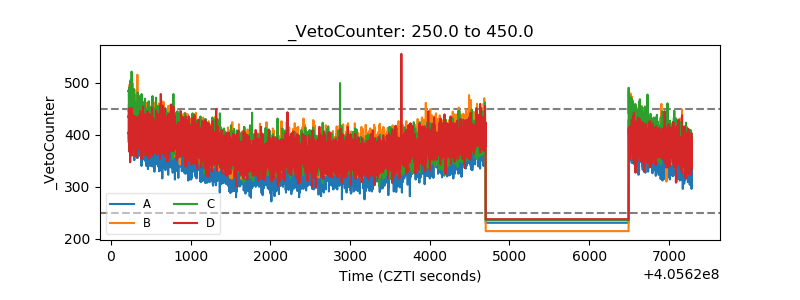 |