| Param | Original file | Final file |
|---|---|---|
| Filename | modeM0/AS1A12_018T01_9000005386_38466cztM0_level2.fits | modeM0/AS1A12_018T01_9000005386_38466cztM0_level2_quad_clean.evt |
| Size (bytes) | 443,471,040 | 88,853,760 |
| Size | 422.9 MB | 84.7 MB |
| Events in quadrant A | 3,004,141 | 632,363 |
| Events in quadrant B | 2,934,053 | 641,223 |
| Events in quadrant C | 2,725,074 | 612,642 |
| Events in quadrant D | 7,314,687 | 410,854 |
| Mode SS | |||
|---|---|---|---|
| Quadrant | BADHDUFLAG | Total packets | Discarded packets |
| A | 0 | 114 | 0 |
| B | 0 | 114 | 0 |
| C | 0 | 114 | 0 |
| D | 0 | 114 | 0 |
| Mode M9 | |||
|---|---|---|---|
| Quadrant | BADHDUFLAG | Total packets | Discarded packets |
| A | 0 | 24 | 0 |
| B | 0 | 24 | 0 |
| C | 0 | 24 | 0 |
| D | 0 | 25 | 0 |
| Mode M0 | |||
|---|---|---|---|
| Quadrant | BADHDUFLAG | Total packets | Discarded packets |
| A | 0 | 12387 | 3 |
| B | 0 | 12458 | 2 |
| C | 0 | 11624 | 2 |
| D | 0 | 25555 | 2 |
| Quadrant | Total seconds | Saturated seconds | Saturation percentage |
|---|---|---|---|
| A | 5626 | 39 | 0.693210% |
| B | 5626 | 68 | 1.208674% |
| C | 5626 | 27 | 0.479915% |
| D | 5626 | 1724 | 30.643441% |
Noise dominated data is calculated using 1-second bins in cleaned event files. If a bin has >2000 counts, and if more than 50% of those come from <1% of pixels, then it is considered to be noise-dominated and hence unusable.
| Quadrant | # 1 sec bins | Bins with >0 counts | Bins with >2000 counts | High rate bins dominated by noise | Noise dominated (total time) | Noise dominated (detector-on time) | Marked lightcurve |
|---|---|---|---|---|---|---|---|
| A | 7059 | 5627 | 30 | 30 | 0.42% | 0.53% | 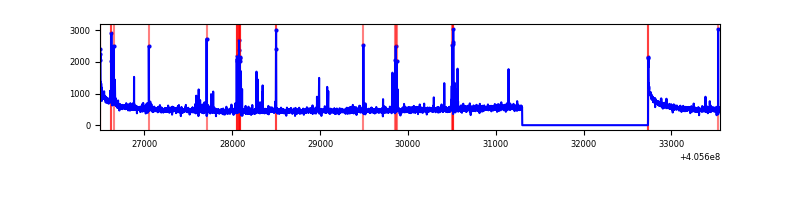 |
| B | 7059 | 5627 | 49 | 49 | 0.69% | 0.87% | 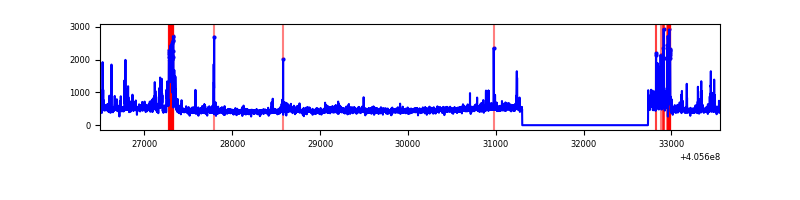 |
| C | 7059 | 5627 | 22 | 22 | 0.31% | 0.39% | 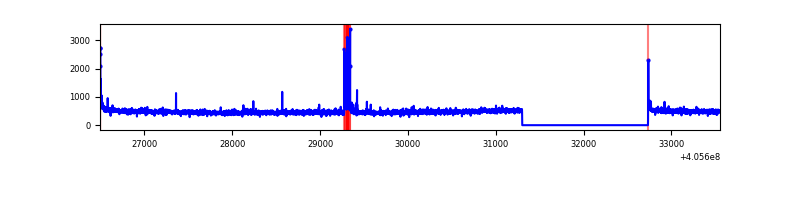 |
| D | 7059 | 5626 | 1658 | 1658 | 23.49% | 29.47% | 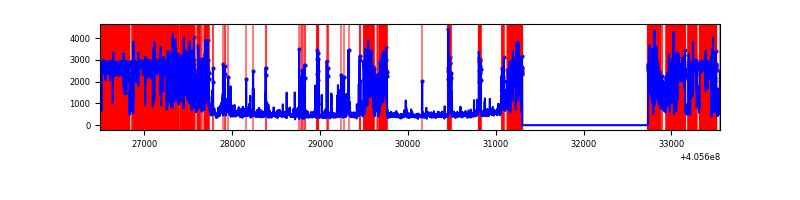 |
Top three noisy pixels from each quadrant. If the there are fewer than three noisy pixels in the level2.evt file, extra rows are filled as -1
| Pixel properties | Quadrant properties | ||||||
|---|---|---|---|---|---|---|---|
| Quadrant | DetID | PixID | Counts | Sigma | Mean | Median | Sigma |
| A | 10 | 83 | 409392 | 3233.34 | 621 | 608 | 126.4 |
| A | 9 | 143 | 94169 | 740.03 | 621 | 608 | 126.4 |
| A | 10 | 248 | 36076 | 280.54 | 621 | 608 | 126.4 |
| B | 5 | 184 | 324907 | 2730.99 | 615 | 597 | 118.8 |
| B | 5 | 200 | 32680 | 270.17 | 615 | 597 | 118.8 |
| B | 0 | 229 | 30402 | 250.99 | 615 | 597 | 118.8 |
| C | 15 | 214 | 235076 | 1653.13 | 606 | 610 | 141.8 |
| C | 14 | 254 | 85093 | 595.66 | 606 | 610 | 141.8 |
| C | 0 | 10 | 30606 | 211.49 | 606 | 610 | 141.8 |
| D | 12 | 227 | 4497835 | 36675.34 | 503 | 489 | 122.6 |
| D | 12 | 235 | 433571 | 3531.73 | 503 | 489 | 122.6 |
| D | 2 | 16 | 128075 | 1040.45 | 503 | 489 | 122.6 |
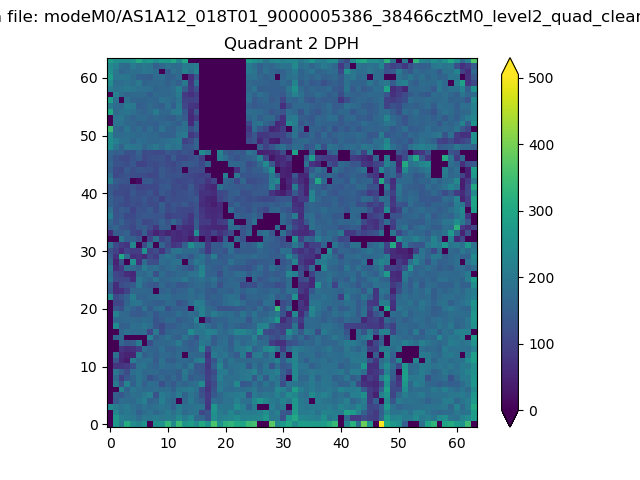
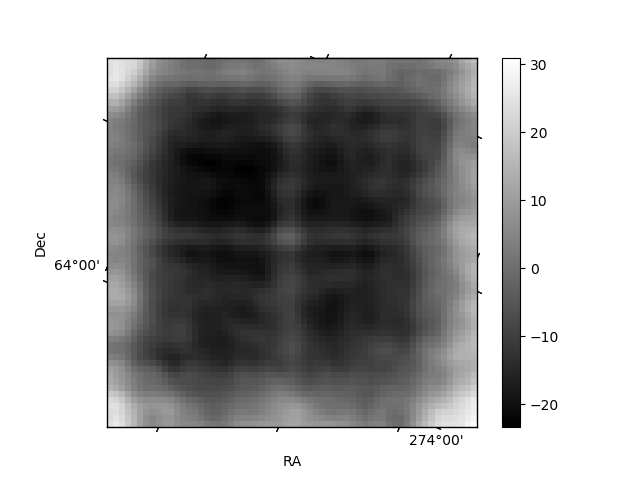
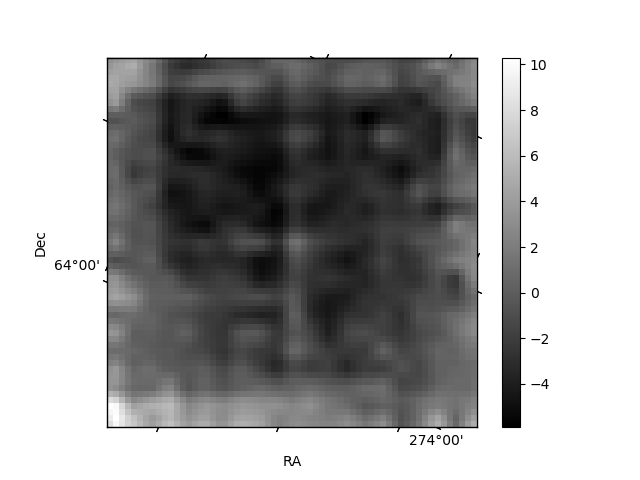
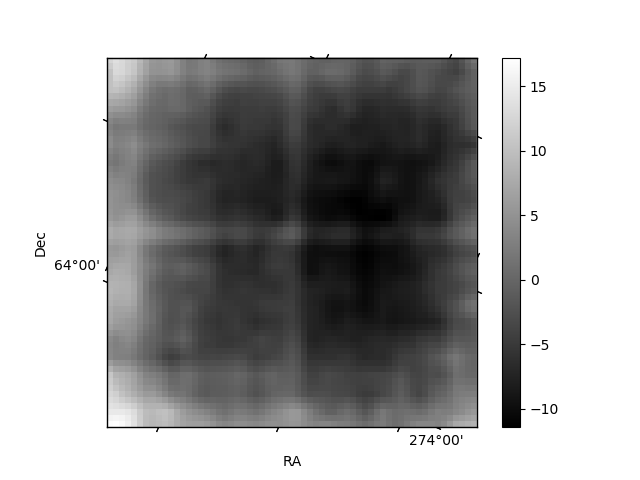
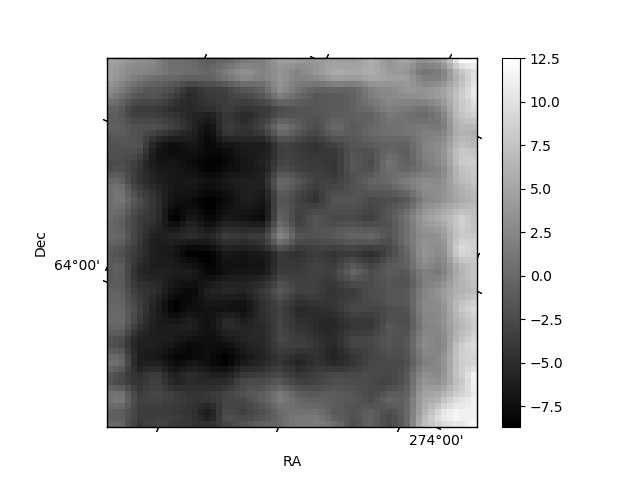
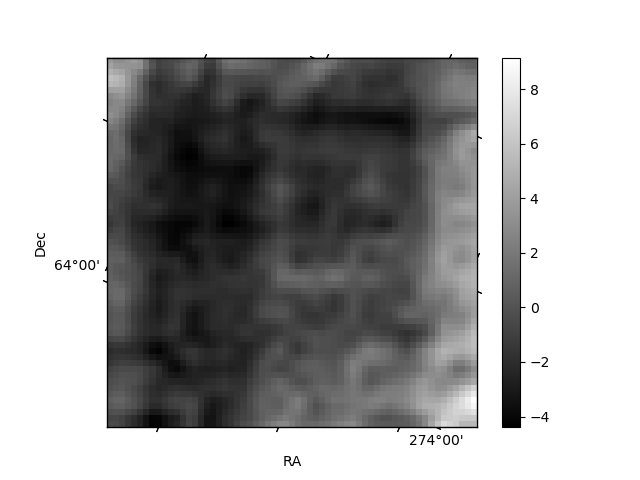
Histogram calculated using DETX and DETY for each event in the final _common_clean file
| Quadrant A | 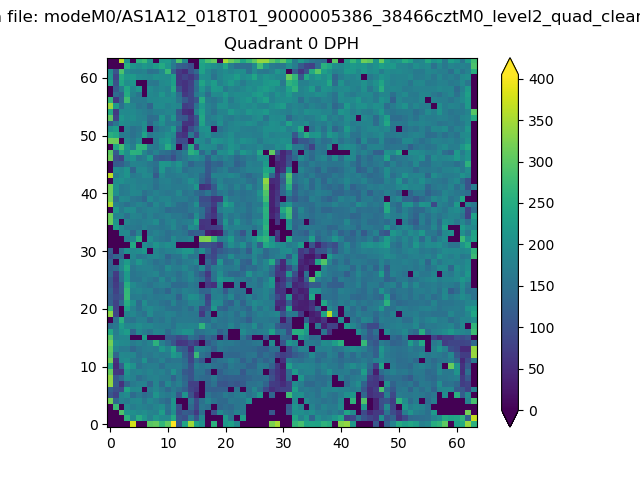 |
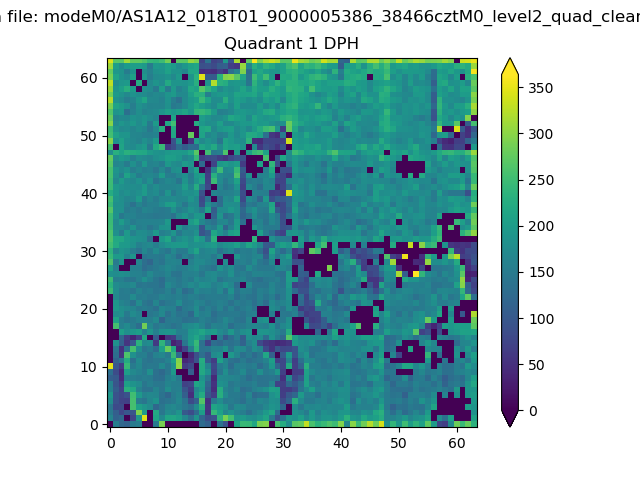 |
Quadrant B |
|---|---|---|---|
| Quadrant D | 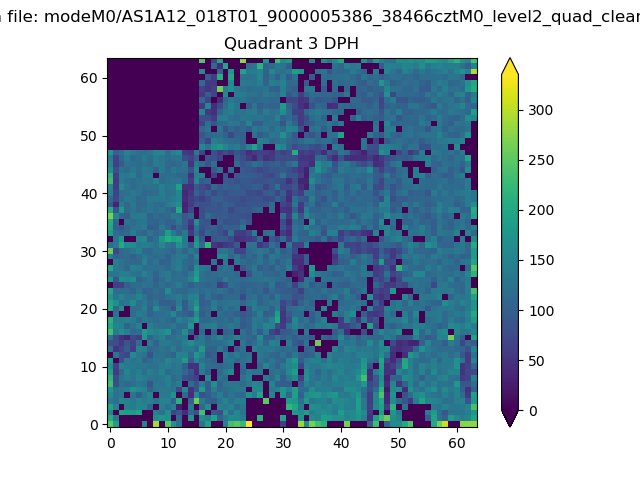 |
 |
Quadrant C |
| Plot type | Count rate plots | Images |
|---|---|---|
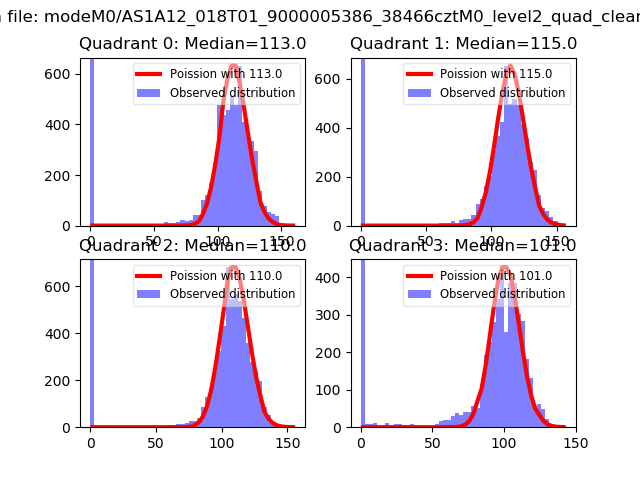
| Comparison with Poisson distribution Blue bars denote a histogram of data divided into 1 sec bins. Red curve is a Poisson curve with rate = median count rate of data. |
 |
 |
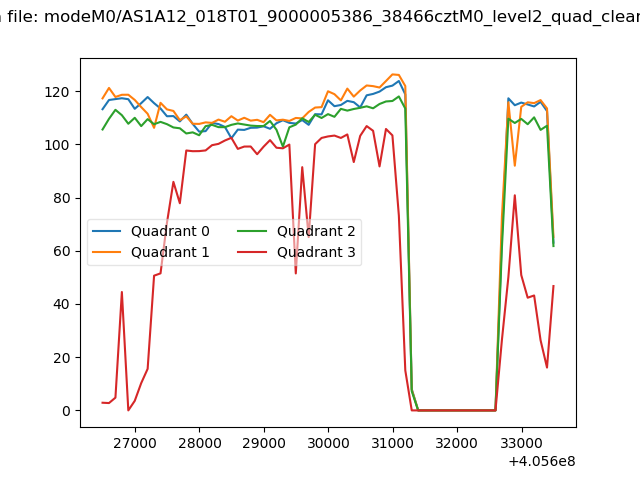
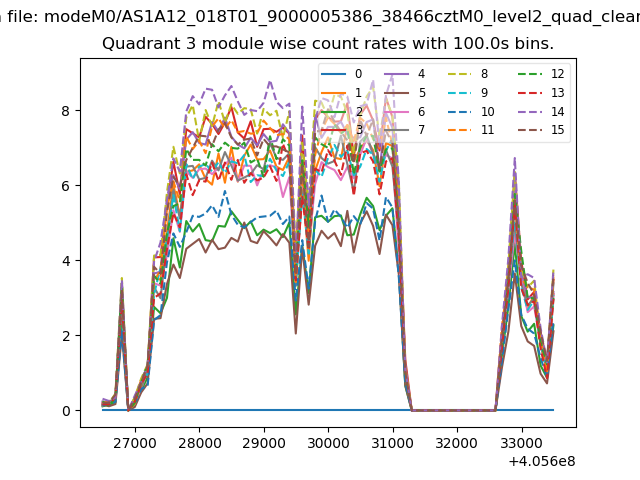
| Quadrant-wise count rates Data is divided into 100 sec bins |
 |
|
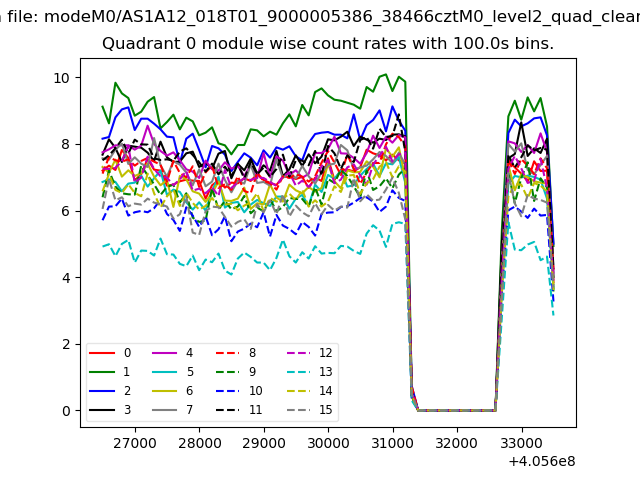
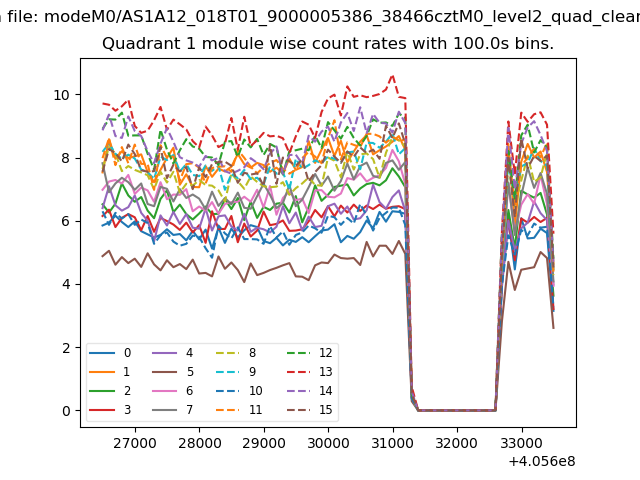
| Module-wise count rates for Quadrant A Data is divided into 100 sec bins |
 |
 |
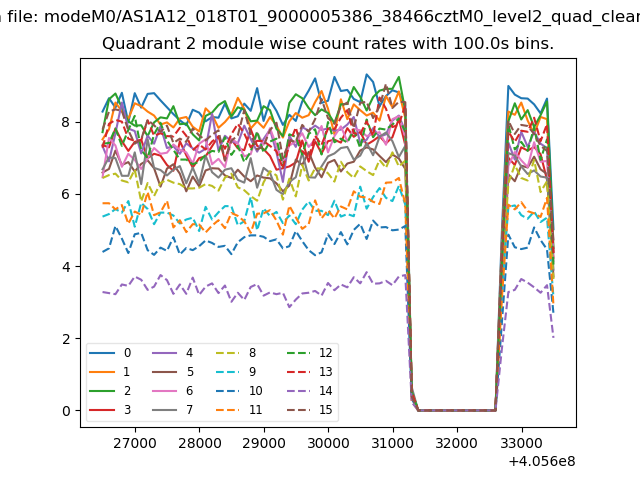
| Module-wise count rates for Quadrant B Data is divided into 100 sec bins |
 |
 |
| Module-wise count rates for Quadrant C Data is divided into 100 sec bins |
 |
 |
| Module-wise count rates for Quadrant D Data is divided into 100 sec bins |
 |
 |
| Parameter | Plot |
|---|---|
| CZT HV Monitor |  |
| D_VDD | 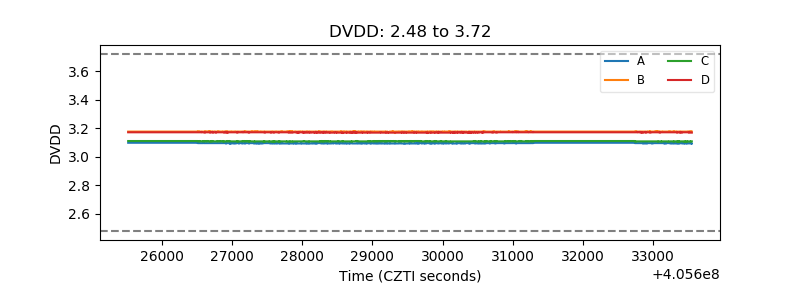 |
| Temperature 1 | 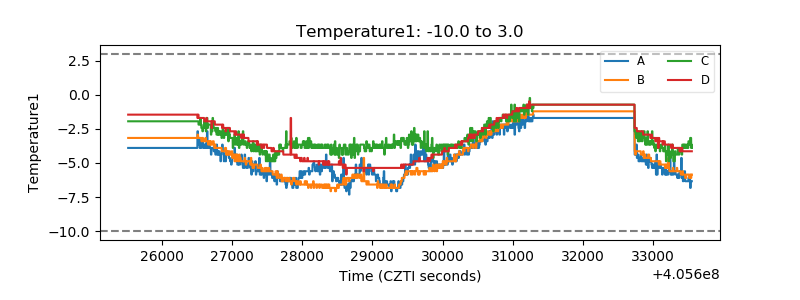 |
| Veto HV Monitor | 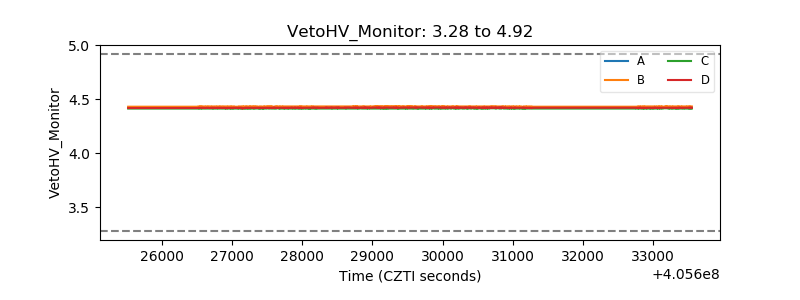 |
| Veto LLD | 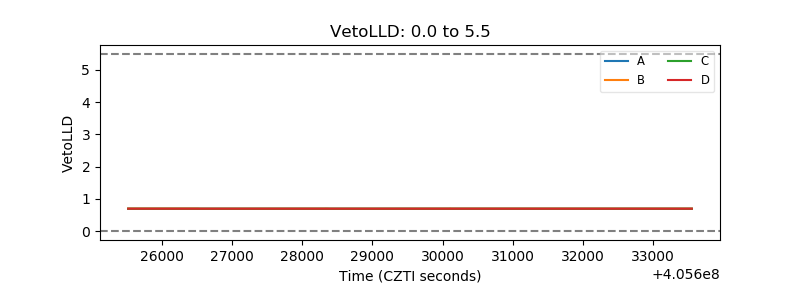 |
| Alpha Counter | 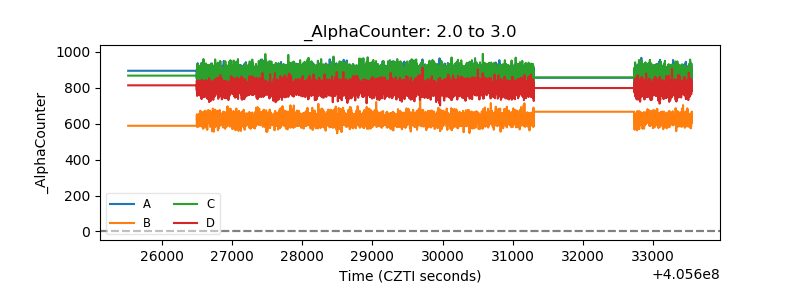 |
| _CPM_Rate | 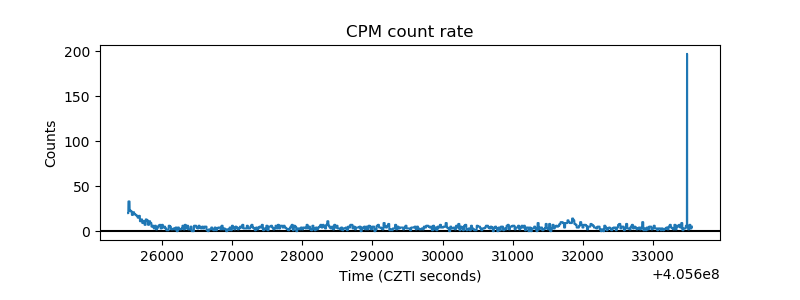 |
| CZT Counter | 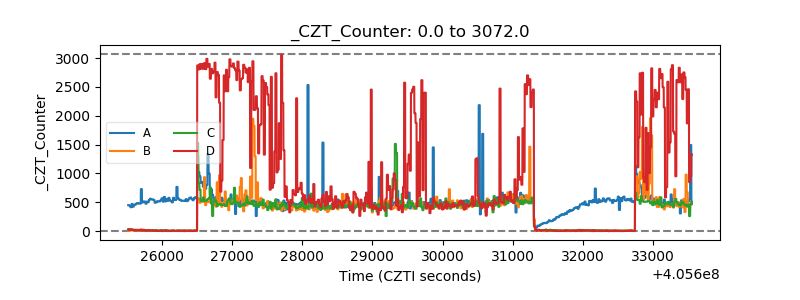 |
| +2.5 Volts monitor | 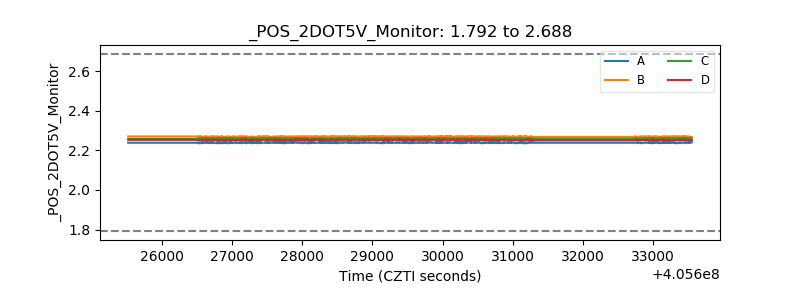 |
| +5 Volts monitor |  |
| _ROLL_ROT | 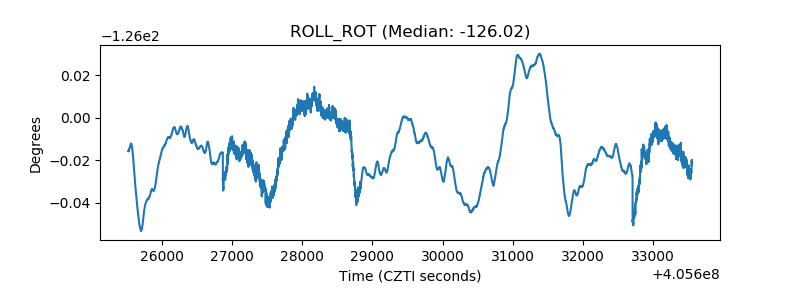 |
| _Roll_DEC | 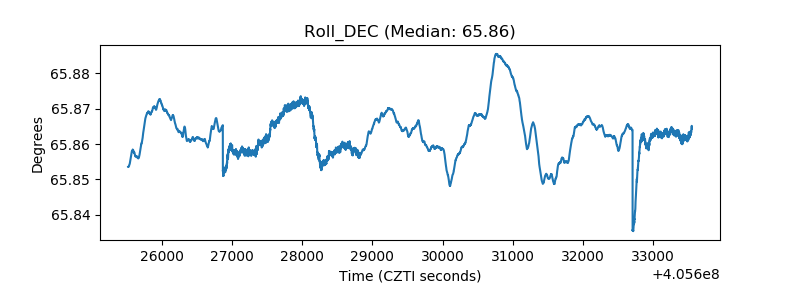 |
| _Roll_RA | 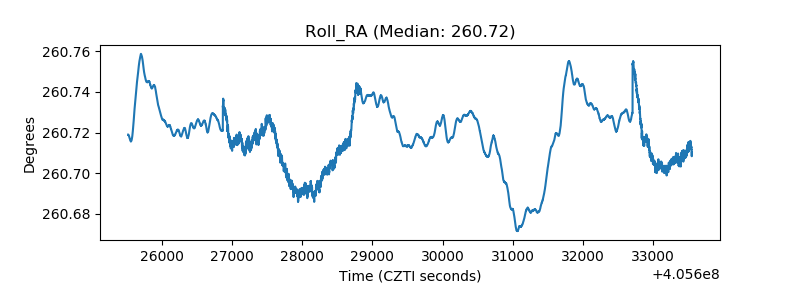 |
| Veto Counter | 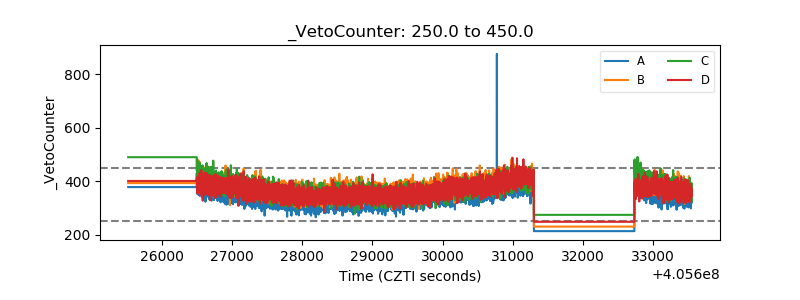 |