| Param | Original file | Final file |
|---|---|---|
| Filename | modeM0/AS1A12_018T01_9000005386_38467cztM0_level2.fits | modeM0/AS1A12_018T01_9000005386_38467cztM0_level2_quad_clean.evt |
| Size (bytes) | 459,360,000 | 95,083,200 |
| Size | 438.1 MB | 90.7 MB |
| Events in quadrant A | 3,041,079 | 666,524 |
| Events in quadrant B | 3,426,941 | 672,590 |
| Events in quadrant C | 2,832,177 | 651,611 |
| Events in quadrant D | 7,236,668 | 468,577 |
| Mode SS | |||
|---|---|---|---|
| Quadrant | BADHDUFLAG | Total packets | Discarded packets |
| A | 0 | 122 | 0 |
| B | 0 | 122 | 0 |
| C | 0 | 122 | 0 |
| D | 0 | 122 | 0 |
| Mode M9 | |||
|---|---|---|---|
| Quadrant | BADHDUFLAG | Total packets | Discarded packets |
| A | 0 | 23 | 0 |
| B | 0 | 23 | 0 |
| C | 0 | 23 | 0 |
| D | 0 | 24 | 0 |
| Mode M0 | |||
|---|---|---|---|
| Quadrant | BADHDUFLAG | Total packets | Discarded packets |
| A | 0 | 12809 | 3 |
| B | 0 | 14084 | 2 |
| C | 0 | 12195 | 2 |
| D | 0 | 25590 | 2 |
| Quadrant | Total seconds | Saturated seconds | Saturation percentage |
|---|---|---|---|
| A | 6005 | 19 | 0.316403% |
| B | 6005 | 92 | 1.532057% |
| C | 6005 | 8 | 0.133222% |
| D | 6005 | 1522 | 25.345545% |
Noise dominated data is calculated using 1-second bins in cleaned event files. If a bin has >2000 counts, and if more than 50% of those come from <1% of pixels, then it is considered to be noise-dominated and hence unusable.
| Quadrant | # 1 sec bins | Bins with >0 counts | Bins with >2000 counts | High rate bins dominated by noise | Noise dominated (total time) | Noise dominated (detector-on time) | Marked lightcurve |
|---|---|---|---|---|---|---|---|
| A | 7318 | 6006 | 9 | 9 | 0.12% | 0.15% | 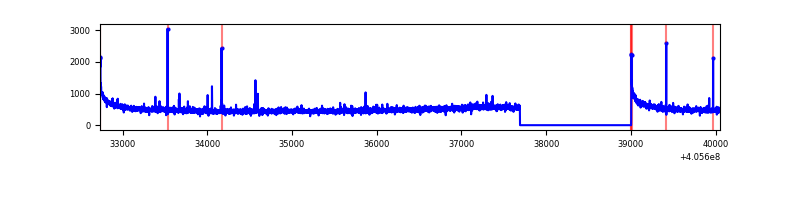 |
| B | 7318 | 6006 | 68 | 68 | 0.93% | 1.13% | 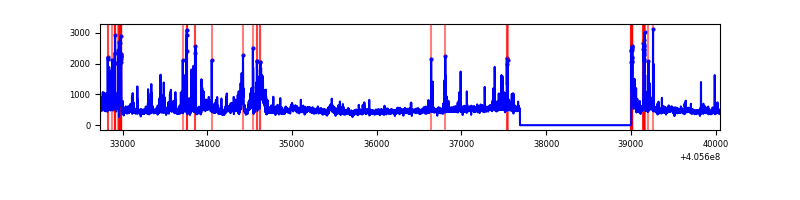 |
| C | 7318 | 6006 | 2 | 2 | 0.03% | 0.03% | 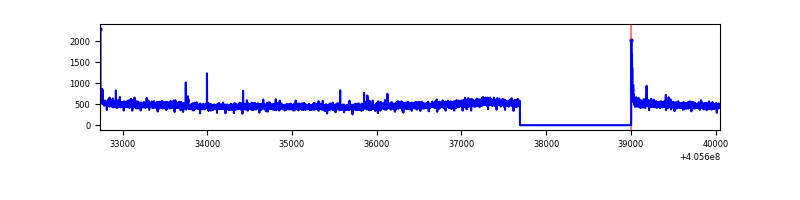 |
| D | 7318 | 6005 | 1374 | 1374 | 18.78% | 22.88% | 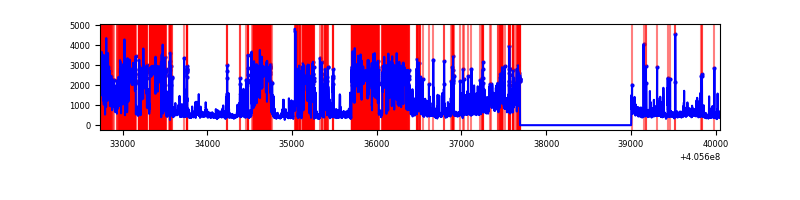 |
Top three noisy pixels from each quadrant. If the there are fewer than three noisy pixels in the level2.evt file, extra rows are filled as -1
| Pixel properties | Quadrant properties | ||||||
|---|---|---|---|---|---|---|---|
| Quadrant | DetID | PixID | Counts | Sigma | Mean | Median | Sigma |
| A | 10 | 83 | 424268 | 3139.56 | 664 | 651 | 134.9 |
| A | 9 | 143 | 29629 | 214.76 | 664 | 651 | 134.9 |
| A | 13 | 6 | 18372 | 131.34 | 664 | 651 | 134.9 |
| B | 5 | 184 | 432366 | 3402.42 | 657 | 640 | 126.9 |
| B | 5 | 200 | 173385 | 1361.4 | 657 | 640 | 126.9 |
| B | 4 | 171 | 55344 | 431.12 | 657 | 640 | 126.9 |
| C | 15 | 214 | 252723 | 1669.7 | 649 | 654 | 151.0 |
| C | 0 | 10 | 27753 | 179.5 | 649 | 654 | 151.0 |
| C | 14 | 254 | 10973 | 68.35 | 649 | 654 | 151.0 |
| D | 10 | 118 | 1710399 | 12258.99 | 576 | 560 | 139.5 |
| D | 12 | 227 | 1271842 | 9114.68 | 576 | 560 | 139.5 |
| D | 2 | 250 | 864956 | 6197.44 | 576 | 560 | 139.5 |
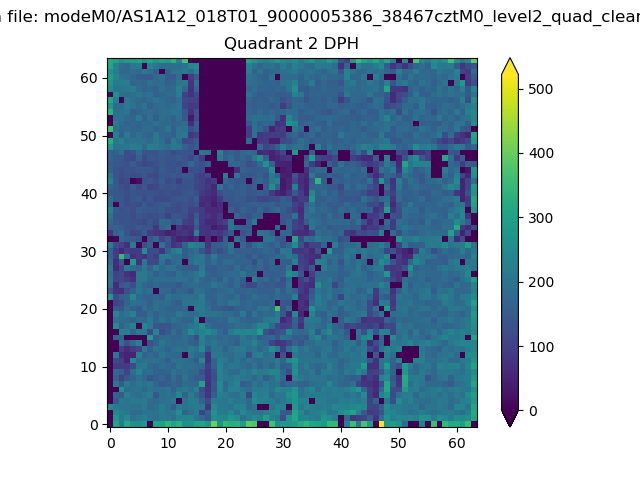
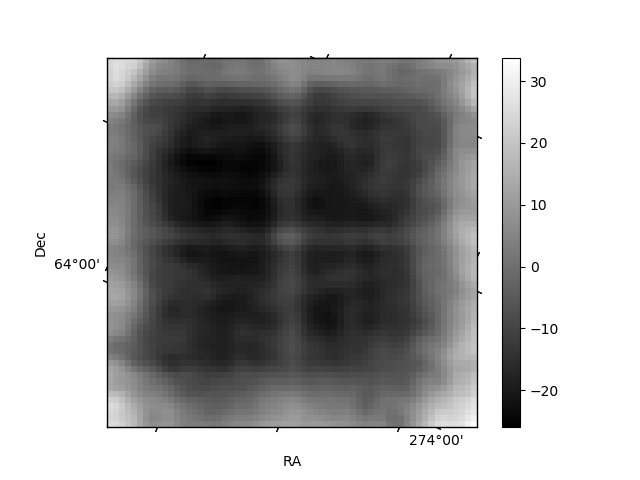
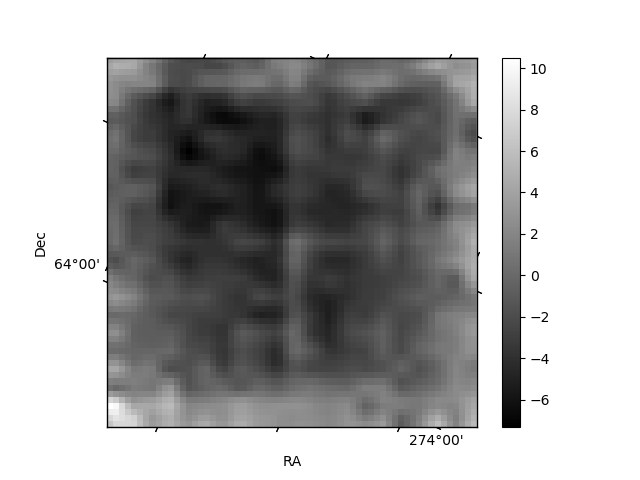
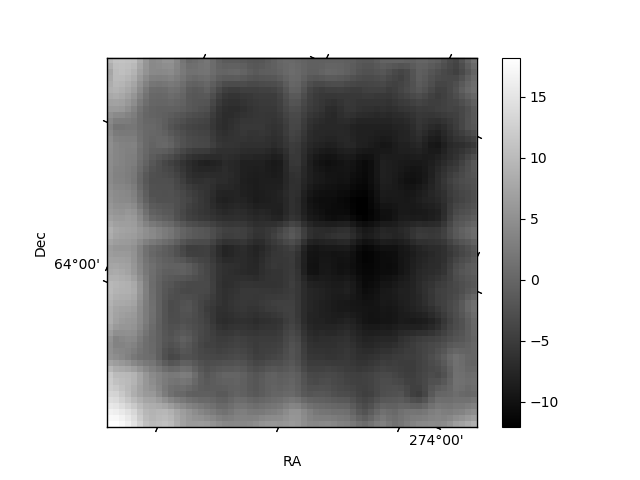
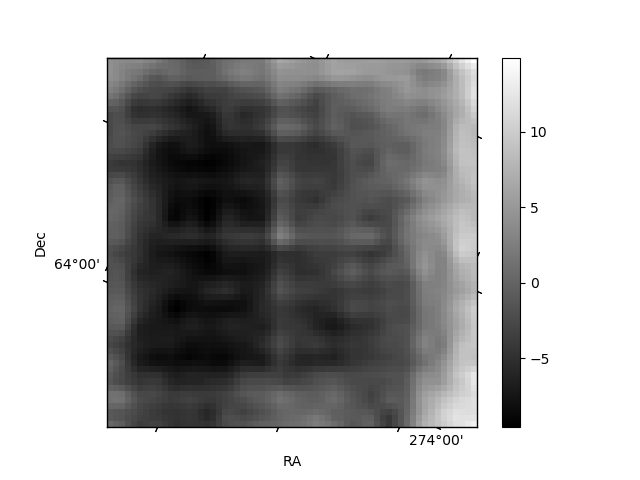
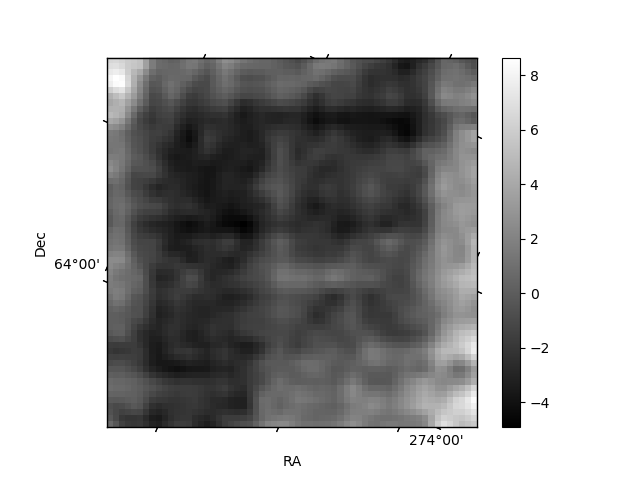
Histogram calculated using DETX and DETY for each event in the final _common_clean file
| Quadrant A | 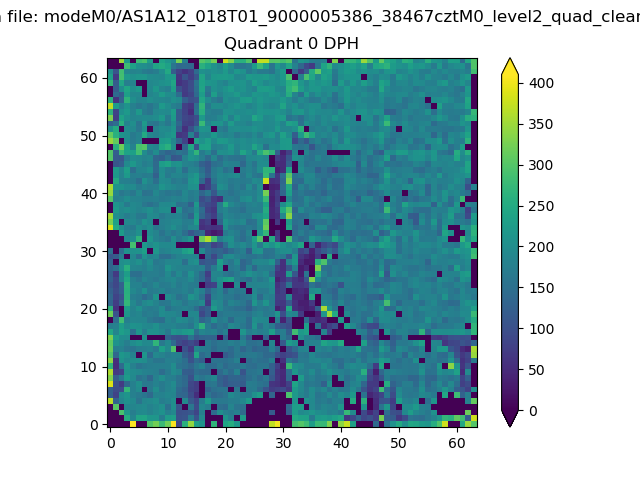 |
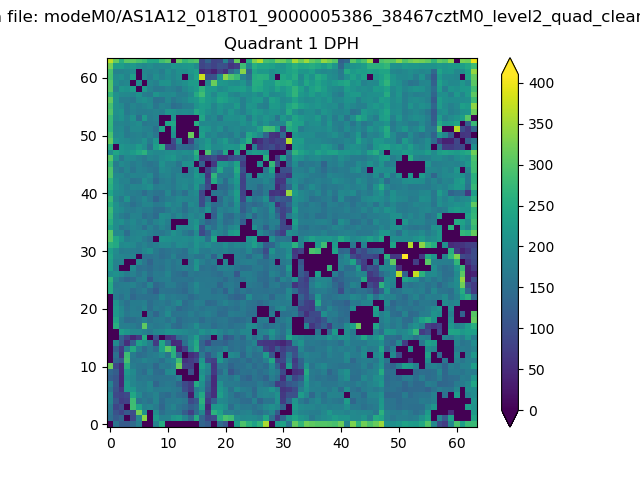 |
Quadrant B |
|---|---|---|---|
| Quadrant D | 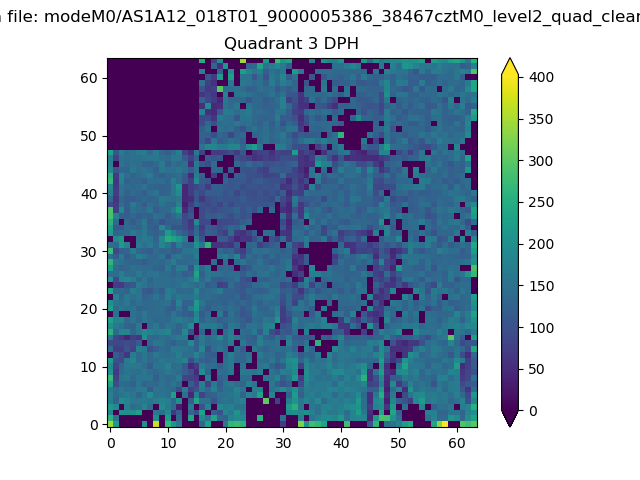 |
 |
Quadrant C |
| Plot type | Count rate plots | Images |
|---|---|---|
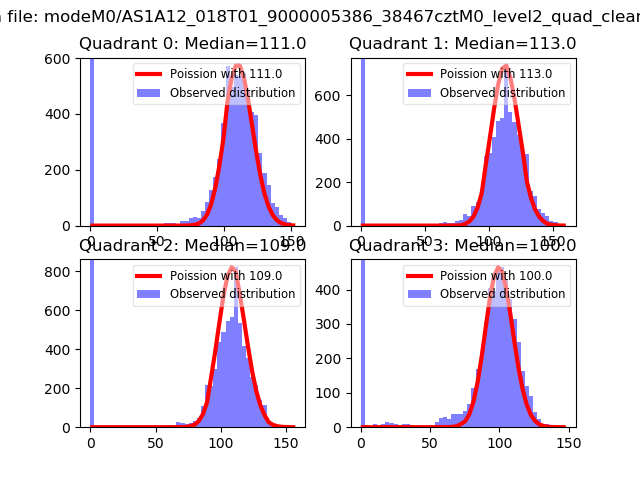
| Comparison with Poisson distribution Blue bars denote a histogram of data divided into 1 sec bins. Red curve is a Poisson curve with rate = median count rate of data. |
 |
 |
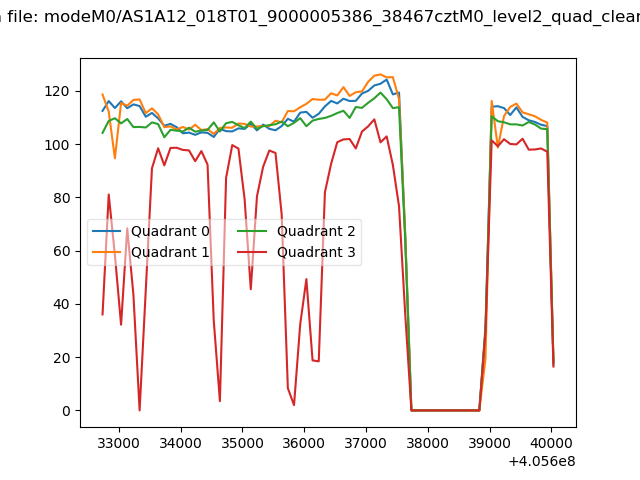
| Quadrant-wise count rates Data is divided into 100 sec bins |
 |
|
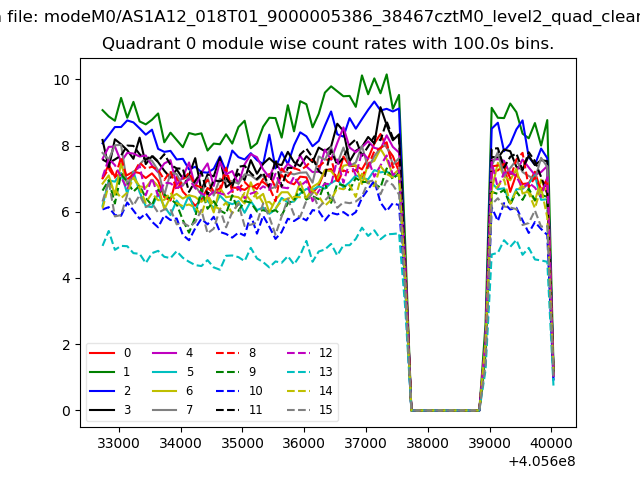
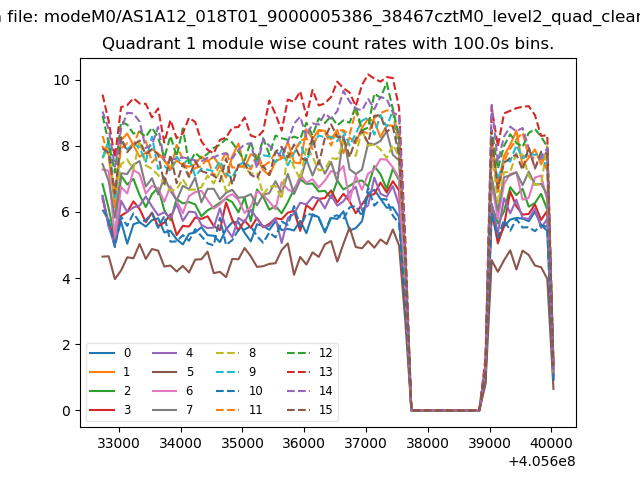
| Module-wise count rates for Quadrant A Data is divided into 100 sec bins |
 |
 |
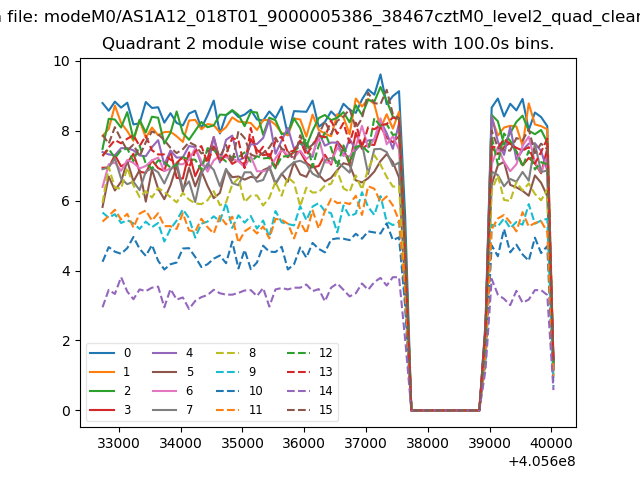
| Module-wise count rates for Quadrant B Data is divided into 100 sec bins |
 |
 |
| Module-wise count rates for Quadrant C Data is divided into 100 sec bins |
 |
 |
| Module-wise count rates for Quadrant D Data is divided into 100 sec bins |
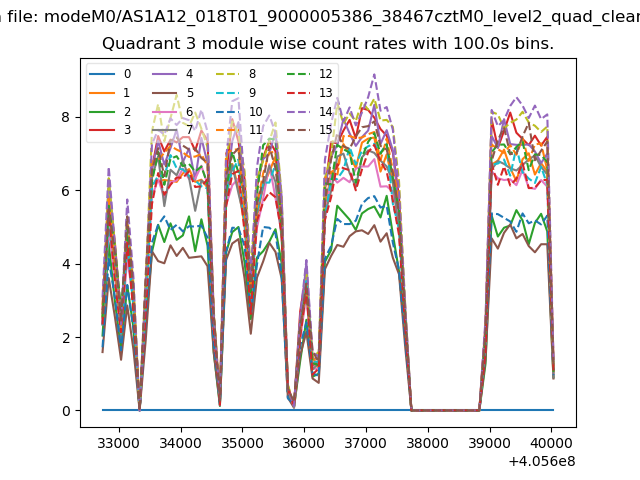 |
 |
| Parameter | Plot |
|---|---|
| CZT HV Monitor | 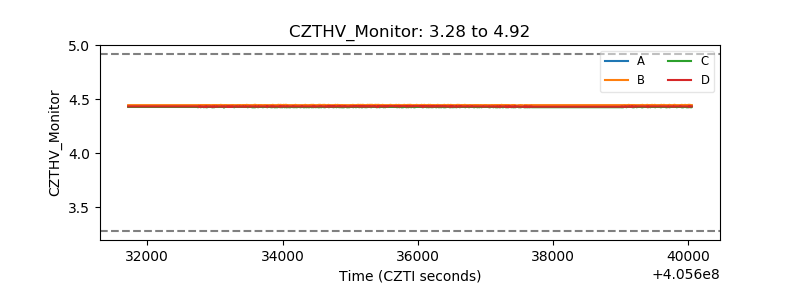 |
| D_VDD | 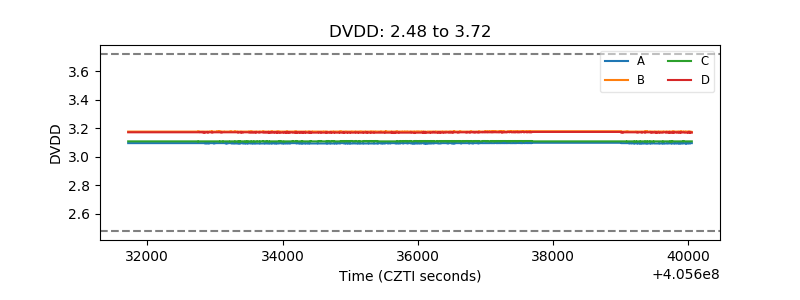 |
| Temperature 1 | 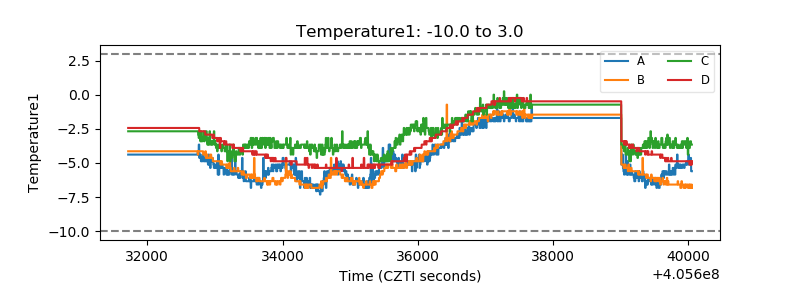 |
| Veto HV Monitor | 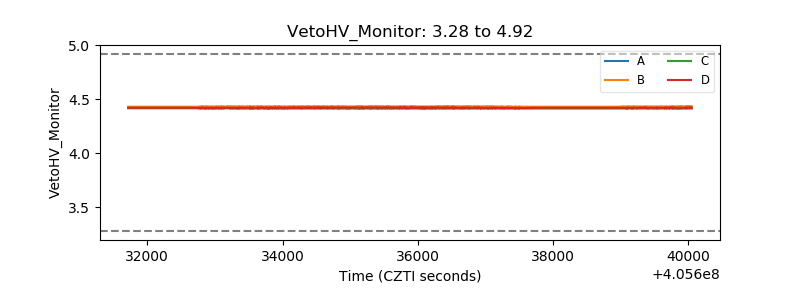 |
| Veto LLD | 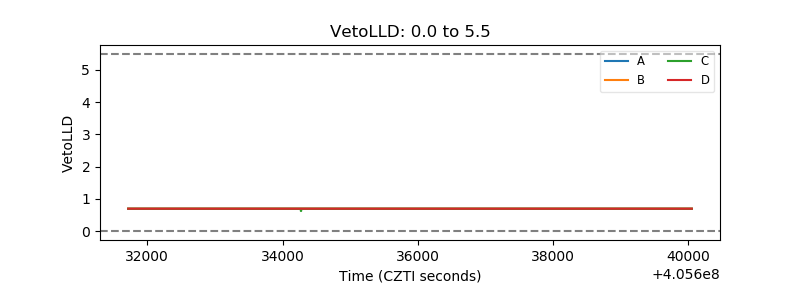 |
| Alpha Counter | 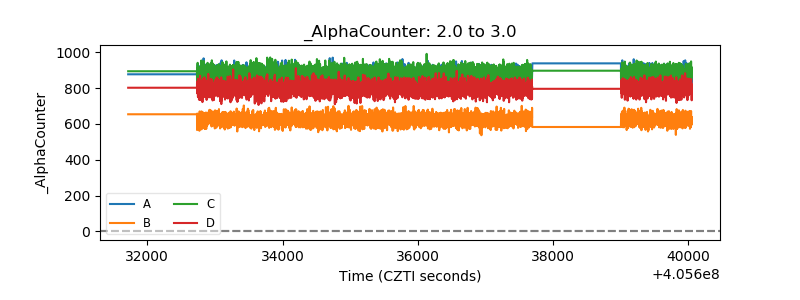 |
| _CPM_Rate | 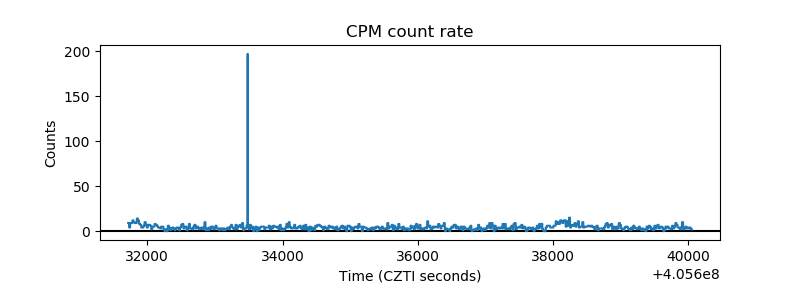 |
| CZT Counter | 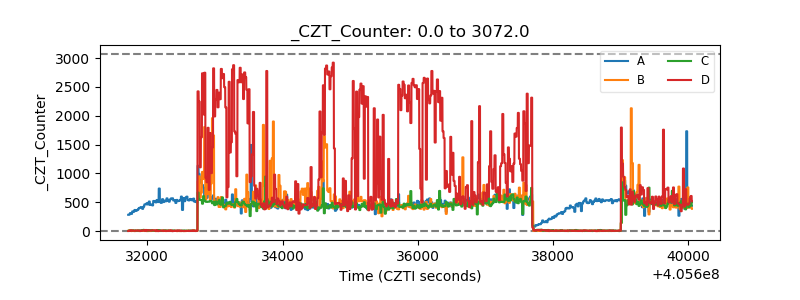 |
| +2.5 Volts monitor | 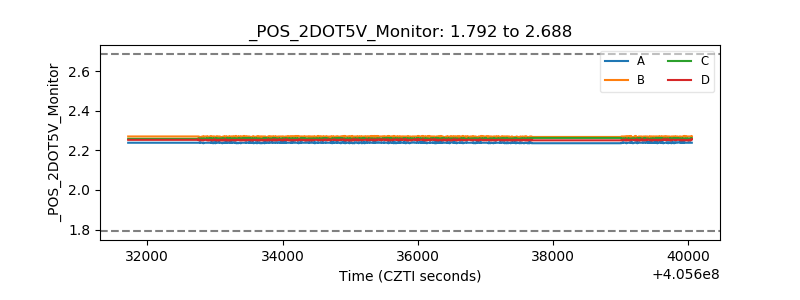 |
| +5 Volts monitor | 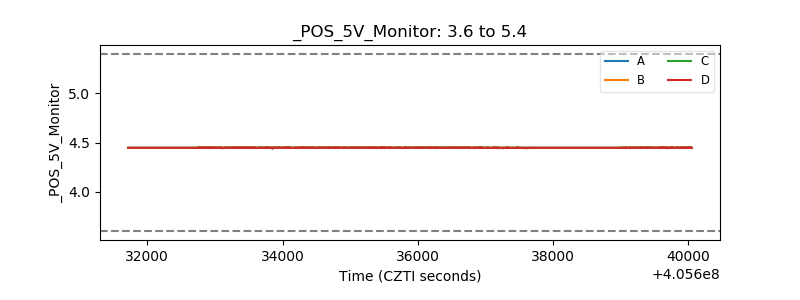 |
| _ROLL_ROT | 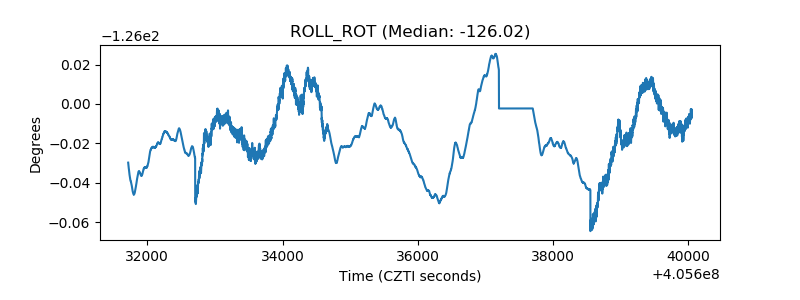 |
| _Roll_DEC | 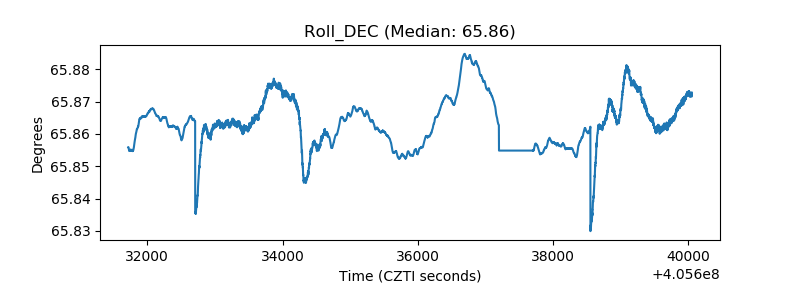 |
| _Roll_RA | 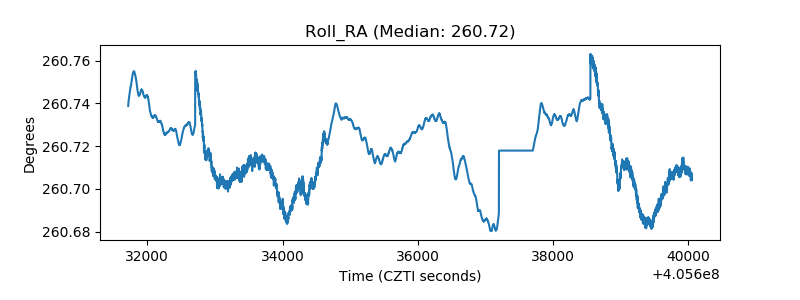 |
| Veto Counter | 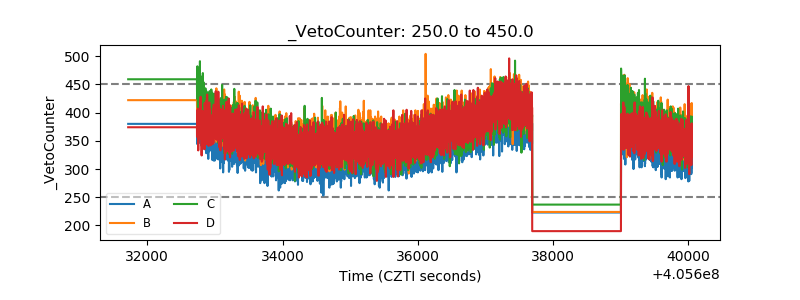 |