| Param | Original file | Final file |
|---|---|---|
| Filename | modeM0/AS1A12_018T01_9000005386_38468cztM0_level2.fits | modeM0/AS1A12_018T01_9000005386_38468cztM0_level2_quad_clean.evt |
| Size (bytes) | 319,832,640 | 88,254,720 |
| Size | 305.0 MB | 84.2 MB |
| Events in quadrant A | 2,759,667 | 593,132 |
| Events in quadrant B | 2,782,906 | 598,878 |
| Events in quadrant C | 2,564,022 | 578,678 |
| Events in quadrant D | 3,316,635 | 527,561 |
| Mode SS | |||
|---|---|---|---|
| Quadrant | BADHDUFLAG | Total packets | Discarded packets |
| A | 0 | 110 | 0 |
| B | 0 | 110 | 0 |
| C | 0 | 110 | 0 |
| D | 0 | 110 | 0 |
| Mode M9 | |||
|---|---|---|---|
| Quadrant | BADHDUFLAG | Total packets | Discarded packets |
| A | 0 | 25 | 0 |
| B | 0 | 25 | 0 |
| C | 0 | 25 | 0 |
| D | 0 | 25 | 0 |
| Mode M0 | |||
|---|---|---|---|
| Quadrant | BADHDUFLAG | Total packets | Discarded packets |
| A | 0 | 11539 | 3 |
| B | 0 | 11966 | 2 |
| C | 0 | 11021 | 2 |
| D | 0 | 13562 | 2 |
| Quadrant | Total seconds | Saturated seconds | Saturation percentage |
|---|---|---|---|
| A | 5337 | 17 | 0.318531% |
| B | 5337 | 73 | 1.367810% |
| C | 5337 | 17 | 0.318531% |
| D | 5337 | 128 | 2.398351% |
Noise dominated data is calculated using 1-second bins in cleaned event files. If a bin has >2000 counts, and if more than 50% of those come from <1% of pixels, then it is considered to be noise-dominated and hence unusable.
| Quadrant | # 1 sec bins | Bins with >0 counts | Bins with >2000 counts | High rate bins dominated by noise | Noise dominated (total time) | Noise dominated (detector-on time) | Marked lightcurve |
|---|---|---|---|---|---|---|---|
| A | 6620 | 5338 | 9 | 9 | 0.14% | 0.17% | 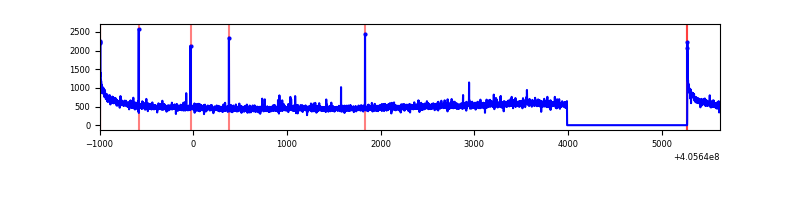 |
| B | 6620 | 5338 | 43 | 43 | 0.65% | 0.81% | 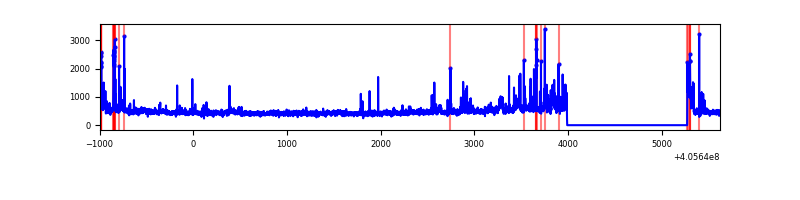 |
| C | 6620 | 5338 | 14 | 14 | 0.21% | 0.26% | 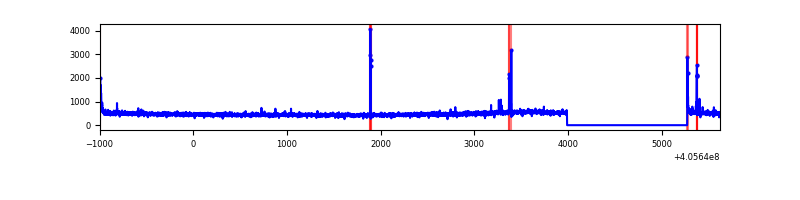 |
| D | 6620 | 5337 | 89 | 89 | 1.34% | 1.67% | 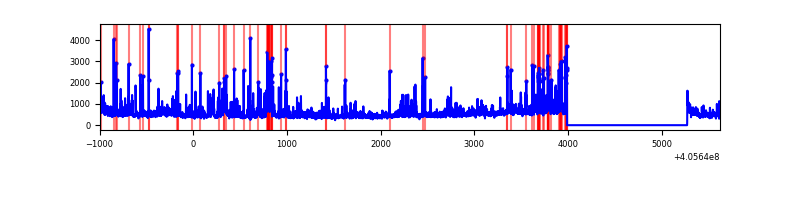 |
Top three noisy pixels from each quadrant. If the there are fewer than three noisy pixels in the level2.evt file, extra rows are filled as -1
| Pixel properties | Quadrant properties | ||||||
|---|---|---|---|---|---|---|---|
| Quadrant | DetID | PixID | Counts | Sigma | Mean | Median | Sigma |
| A | 10 | 83 | 388367 | 3181.03 | 594 | 581 | 121.9 |
| A | 13 | 6 | 44606 | 361.14 | 594 | 581 | 121.9 |
| A | 9 | 143 | 25947 | 208.08 | 594 | 581 | 121.9 |
| B | 5 | 184 | 190309 | 1668.5 | 588 | 571 | 113.7 |
| B | 4 | 171 | 114718 | 1003.77 | 588 | 571 | 113.7 |
| B | 5 | 200 | 70285 | 613.04 | 588 | 571 | 113.7 |
| C | 15 | 214 | 222963 | 1633.63 | 580 | 583 | 136.1 |
| C | 14 | 254 | 32544 | 234.79 | 580 | 583 | 136.1 |
| C | 0 | 10 | 26495 | 190.35 | 580 | 583 | 136.1 |
| D | 2 | 250 | 268280 | 1926.22 | 573 | 557 | 139.0 |
| D | 13 | 200 | 148970 | 1067.8 | 573 | 557 | 139.0 |
| D | 2 | 16 | 134772 | 965.65 | 573 | 557 | 139.0 |
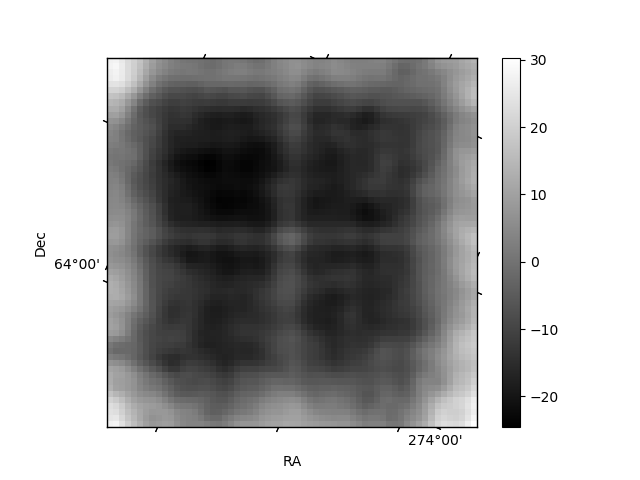
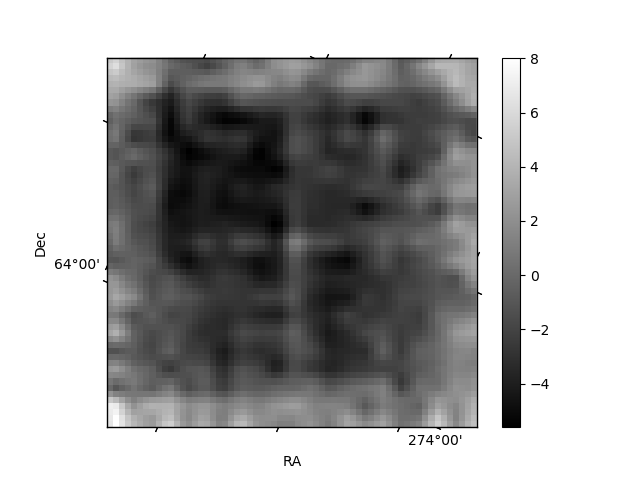
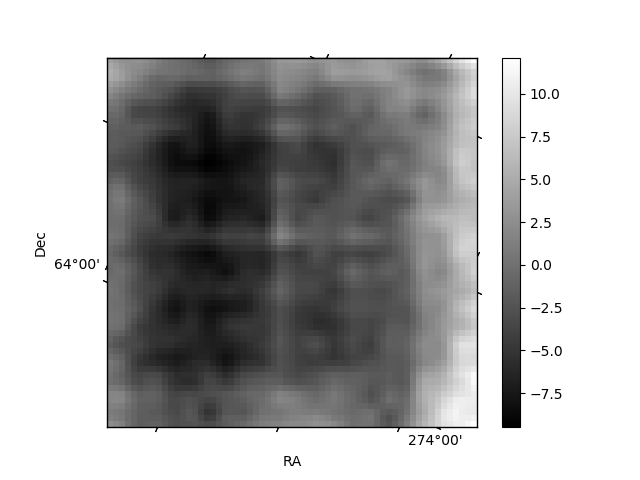
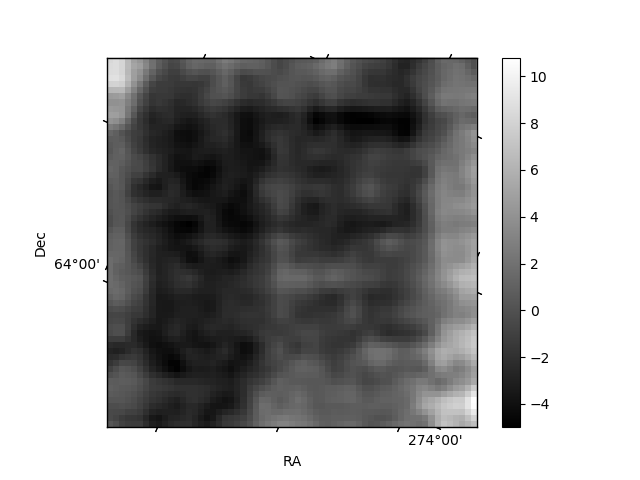
Histogram calculated using DETX and DETY for each event in the final _common_clean file
| Quadrant A | 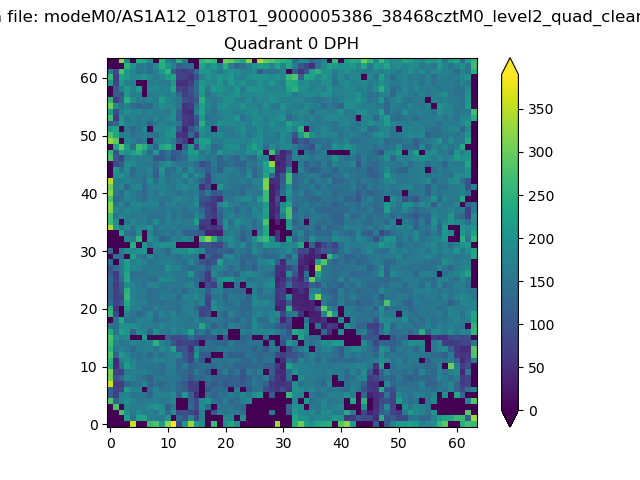 |
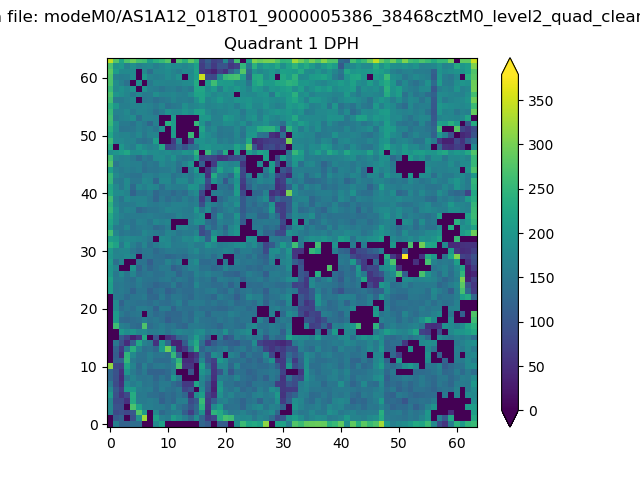 |
Quadrant B |
|---|---|---|---|
| Quadrant D | 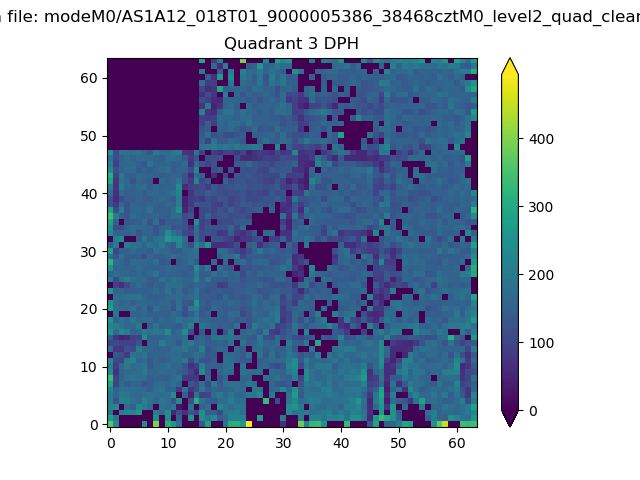 |
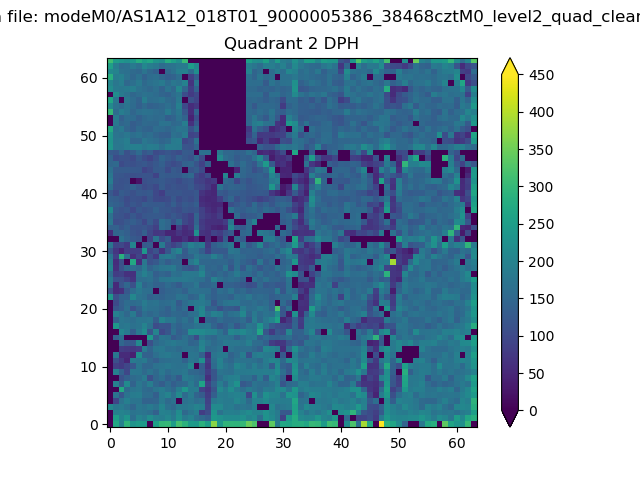 |
Quadrant C |
| Plot type | Count rate plots | Images |
|---|---|---|
| Comparison with Poisson distribution Blue bars denote a histogram of data divided into 1 sec bins. Red curve is a Poisson curve with rate = median count rate of data. |
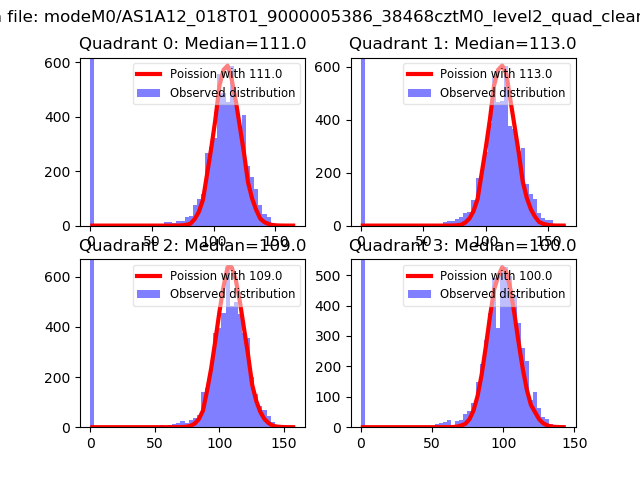 |
 |
| Quadrant-wise count rates Data is divided into 100 sec bins |
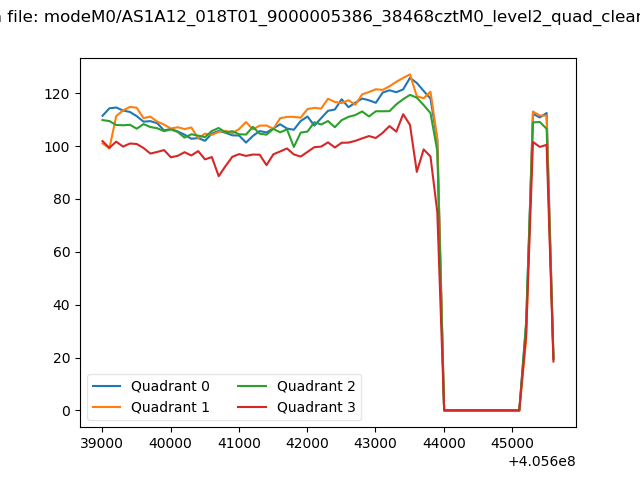 |
|
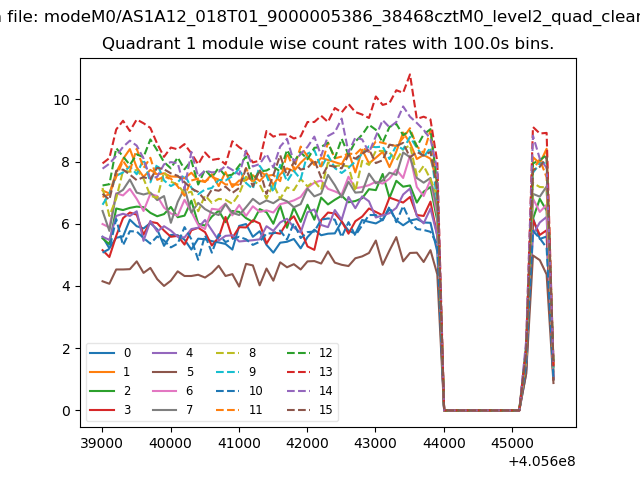
| Module-wise count rates for Quadrant A Data is divided into 100 sec bins |
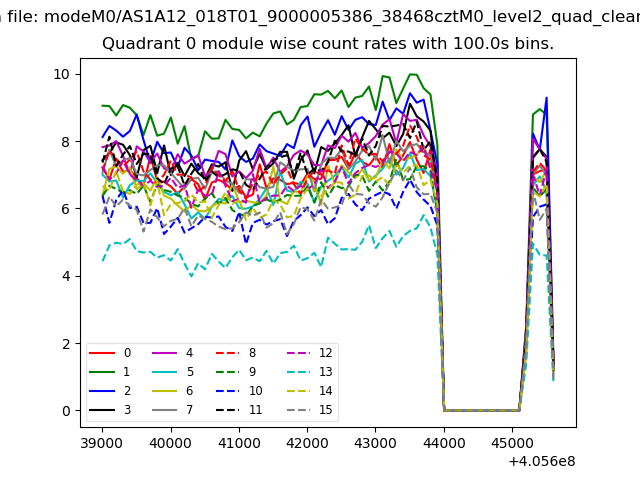 |
 |
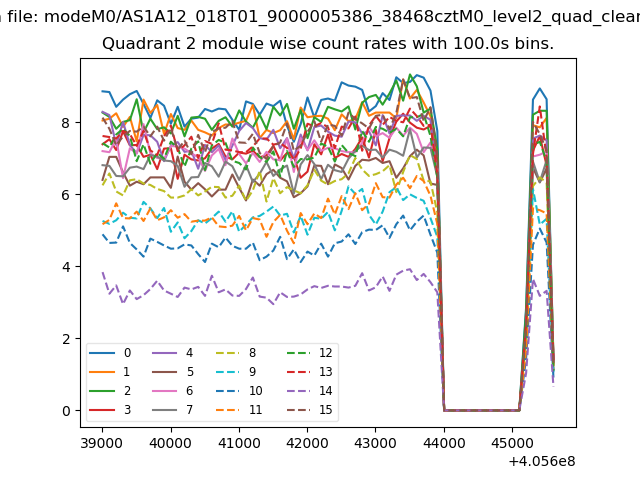
| Module-wise count rates for Quadrant B Data is divided into 100 sec bins |
 |
 |
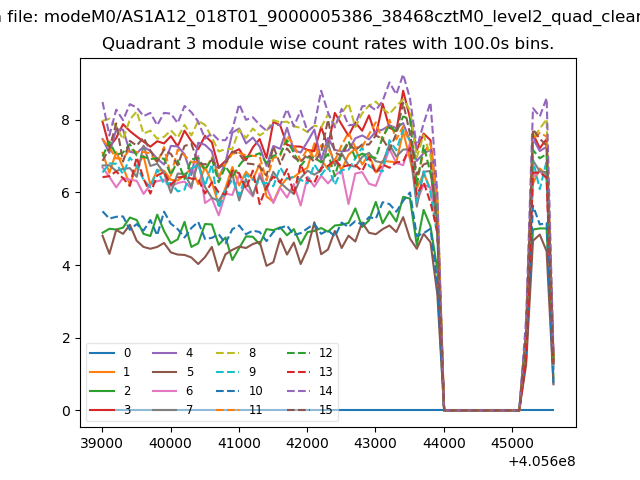
| Module-wise count rates for Quadrant C Data is divided into 100 sec bins |
 |
 |
| Module-wise count rates for Quadrant D Data is divided into 100 sec bins |
 |
 |
| Parameter | Plot |
|---|---|
| CZT HV Monitor | 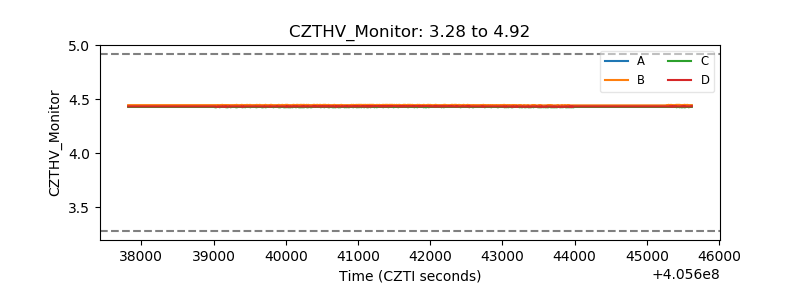 |
| D_VDD | 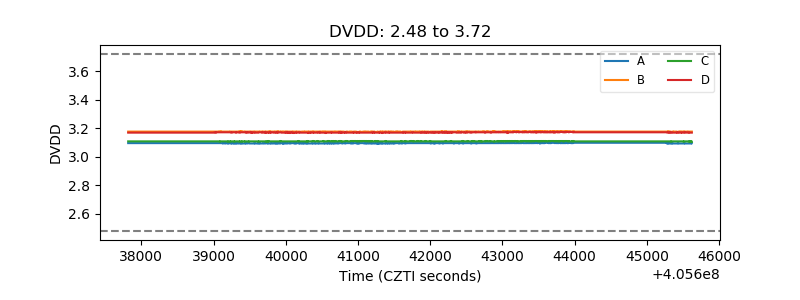 |
| Temperature 1 | 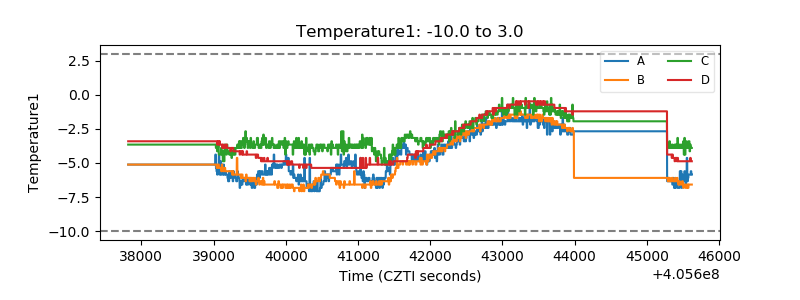 |
| Veto HV Monitor | 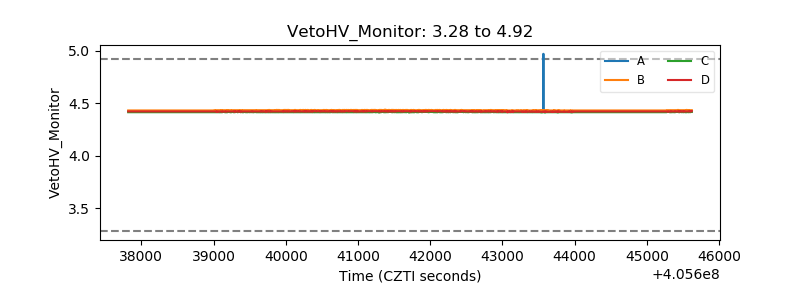 |
| Veto LLD | 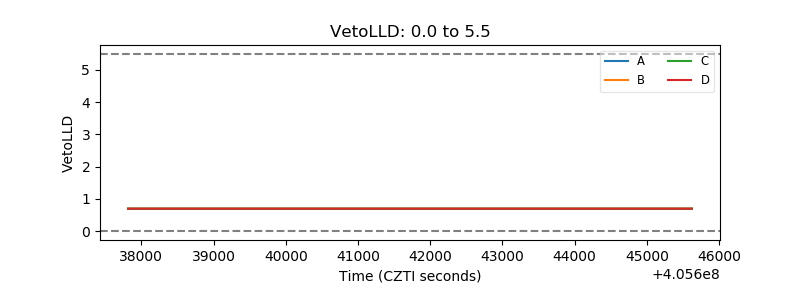 |
| Alpha Counter | 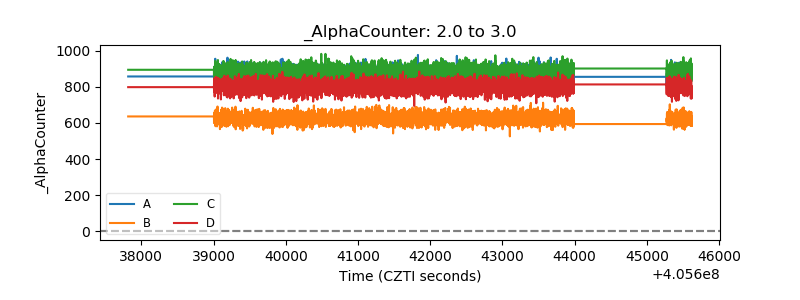 |
| _CPM_Rate | 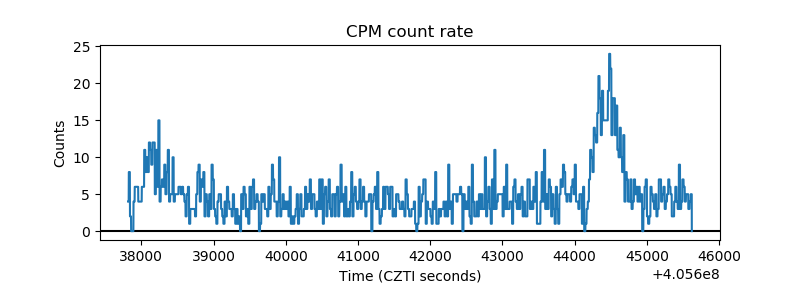 |
| CZT Counter | 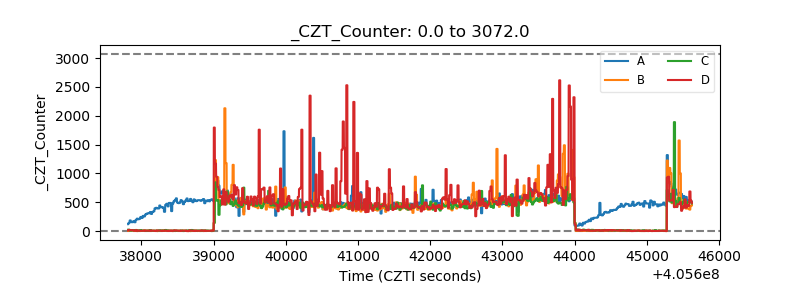 |
| +2.5 Volts monitor | 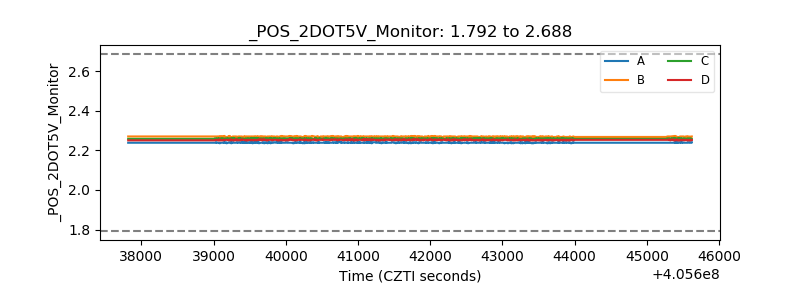 |
| +5 Volts monitor | 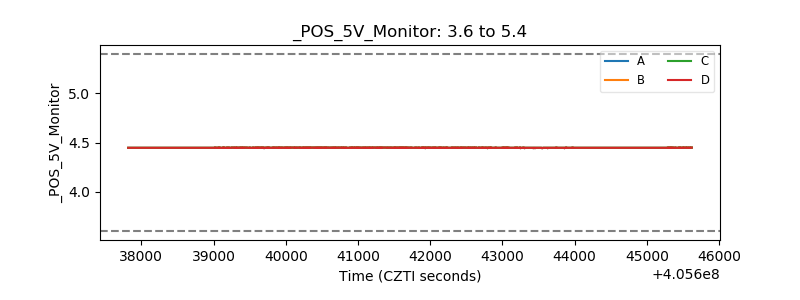 |
| _ROLL_ROT | 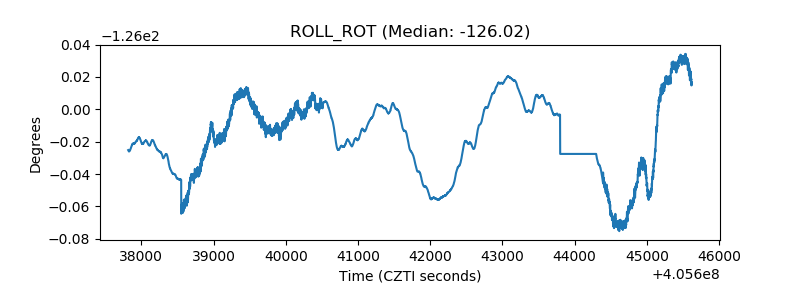 |
| _Roll_DEC | 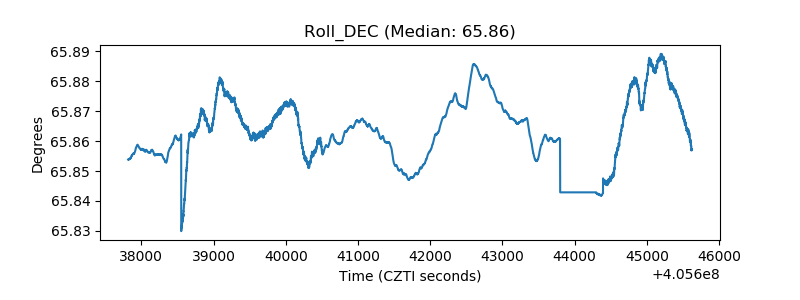 |
| _Roll_RA | 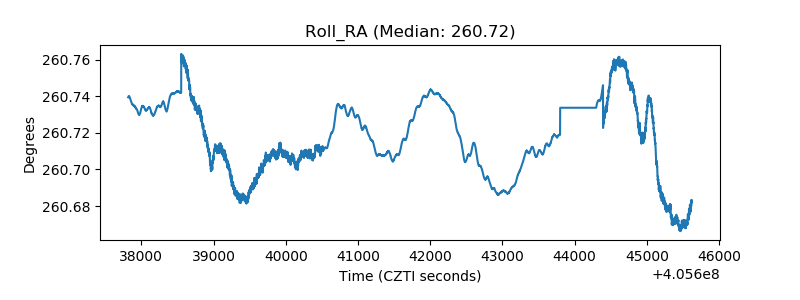 |
| Veto Counter | 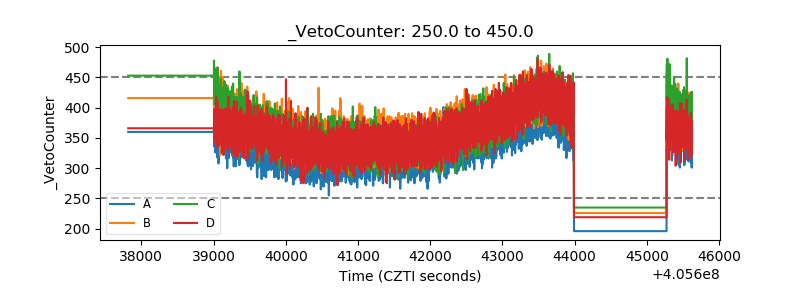 |