| Param | Original file | Final file |
|---|---|---|
| Filename | modeM0/AS1A12_018T01_9000005386_38470cztM0_level2.fits | modeM0/AS1A12_018T01_9000005386_38470cztM0_level2_quad_clean.evt |
| Size (bytes) | 663,865,920 | 175,458,240 |
| Size | 633.1 MB | 167.3 MB |
| Events in quadrant A | 5,626,853 | 1,179,737 |
| Events in quadrant B | 6,062,927 | 1,185,435 |
| Events in quadrant C | 5,389,075 | 1,152,722 |
| Events in quadrant D | 6,661,872 | 1,050,358 |
| Mode SS | |||
|---|---|---|---|
| Quadrant | BADHDUFLAG | Total packets | Discarded packets |
| A | 0 | 220 | 0 |
| B | 0 | 220 | 0 |
| C | 0 | 220 | 0 |
| D | 0 | 220 | 0 |
| Mode M9 | |||
|---|---|---|---|
| Quadrant | BADHDUFLAG | Total packets | Discarded packets |
| A | 0 | 37 | 0 |
| B | 0 | 37 | 0 |
| C | 0 | 37 | 0 |
| D | 0 | 38 | 0 |
| Mode M0 | |||
|---|---|---|---|
| Quadrant | BADHDUFLAG | Total packets | Discarded packets |
| A | 0 | 23290 | 4 |
| B | 0 | 25458 | 3 |
| C | 0 | 22858 | 3 |
| D | 0 | 27314 | 3 |
| Quadrant | Total seconds | Saturated seconds | Saturation percentage |
|---|---|---|---|
| A | 10744 | 44 | 0.409531% |
| B | 10744 | 273 | 2.540953% |
| C | 10744 | 80 | 0.744602% |
| D | 10744 | 264 | 2.457185% |
Noise dominated data is calculated using 1-second bins in cleaned event files. If a bin has >2000 counts, and if more than 50% of those come from <1% of pixels, then it is considered to be noise-dominated and hence unusable.
| Quadrant | # 1 sec bins | Bins with >0 counts | Bins with >2000 counts | High rate bins dominated by noise | Noise dominated (total time) | Noise dominated (detector-on time) | Marked lightcurve |
|---|---|---|---|---|---|---|---|
| A | 13579 | 10746 | 28 | 28 | 0.21% | 0.26% | 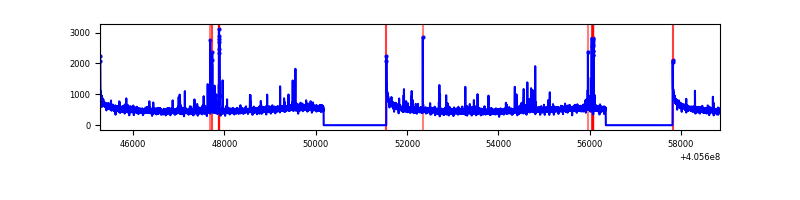 |
| B | 13579 | 10746 | 153 | 153 | 1.13% | 1.42% | 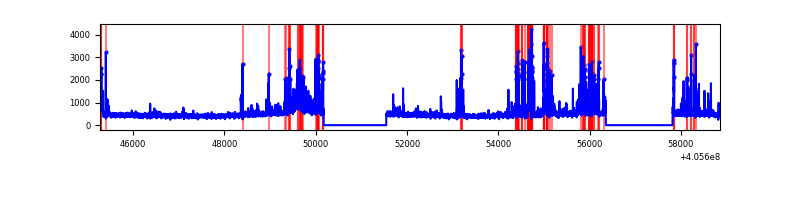 |
| C | 13579 | 10746 | 51 | 51 | 0.38% | 0.47% | 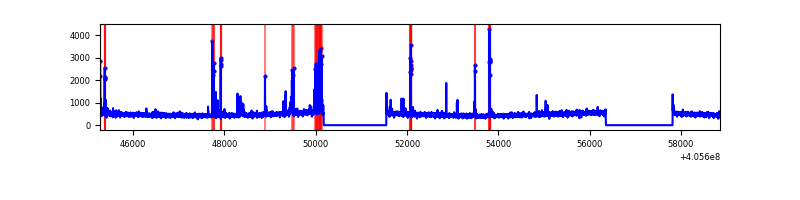 |
| D | 13579 | 10746 | 221 | 221 | 1.63% | 2.06% | 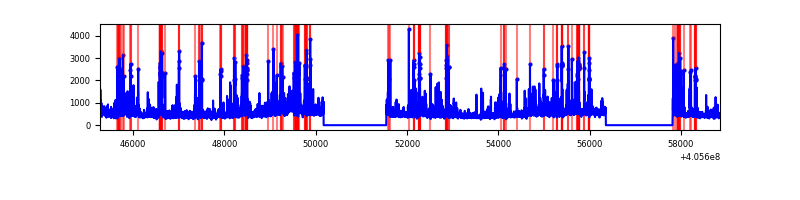 |
Top three noisy pixels from each quadrant. If the there are fewer than three noisy pixels in the level2.evt file, extra rows are filled as -1
| Pixel properties | Quadrant properties | ||||||
|---|---|---|---|---|---|---|---|
| Quadrant | DetID | PixID | Counts | Sigma | Mean | Median | Sigma |
| A | 10 | 83 | 720784 | 2969.85 | 1197 | 1173 | 242.3 |
| A | 9 | 143 | 175921 | 721.19 | 1197 | 1173 | 242.3 |
| A | 12 | 189 | 74721 | 303.53 | 1197 | 1173 | 242.3 |
| B | 8 | 3 | 690025 | 3031.85 | 1178 | 1144 | 227.2 |
| B | 5 | 184 | 294543 | 1291.29 | 1178 | 1144 | 227.2 |
| B | 4 | 171 | 196464 | 859.63 | 1178 | 1144 | 227.2 |
| C | 15 | 214 | 451967 | 1679.73 | 1159 | 1167 | 268.4 |
| C | 14 | 254 | 326525 | 1212.32 | 1159 | 1167 | 268.4 |
| C | 3 | 110 | 33453 | 120.3 | 1159 | 1167 | 268.4 |
| D | 2 | 250 | 470753 | 1675.45 | 1152 | 1121 | 280.3 |
| D | 2 | 153 | 334200 | 1188.28 | 1152 | 1121 | 280.3 |
| D | 13 | 200 | 332677 | 1182.85 | 1152 | 1121 | 280.3 |
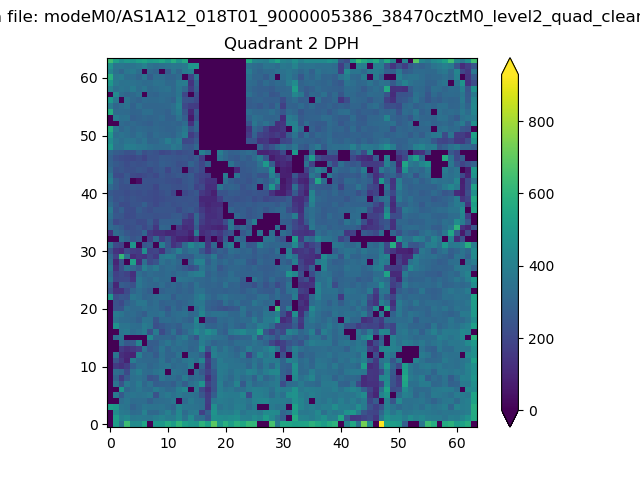
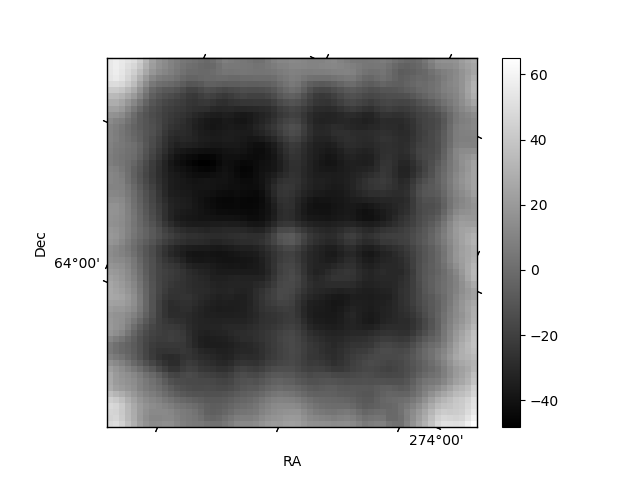
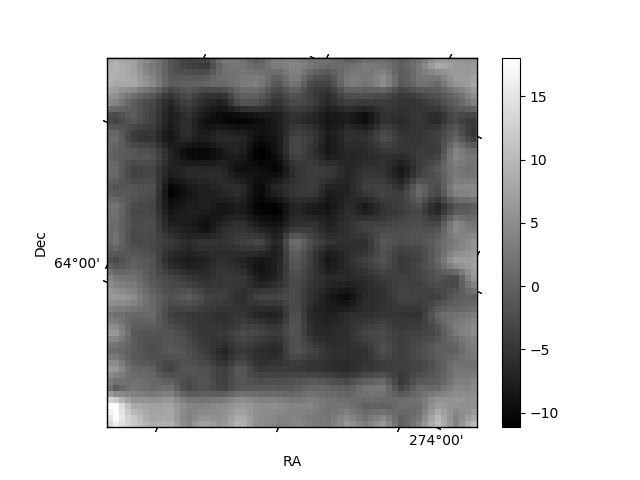
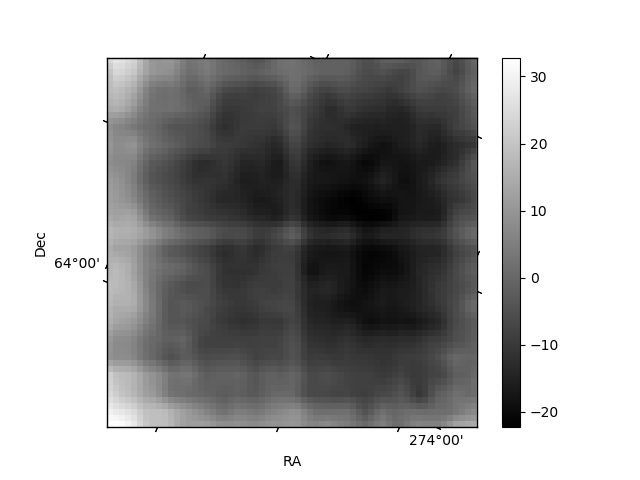
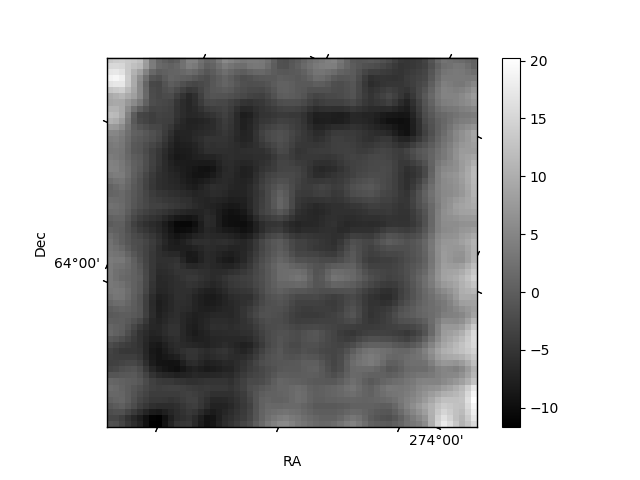
Histogram calculated using DETX and DETY for each event in the final _common_clean file
| Quadrant A | 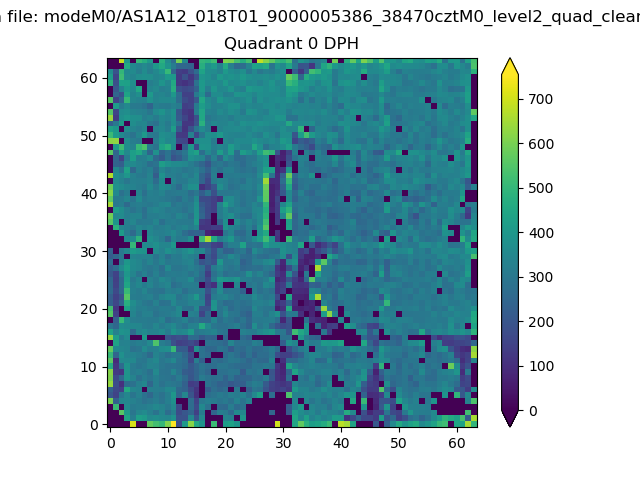 |
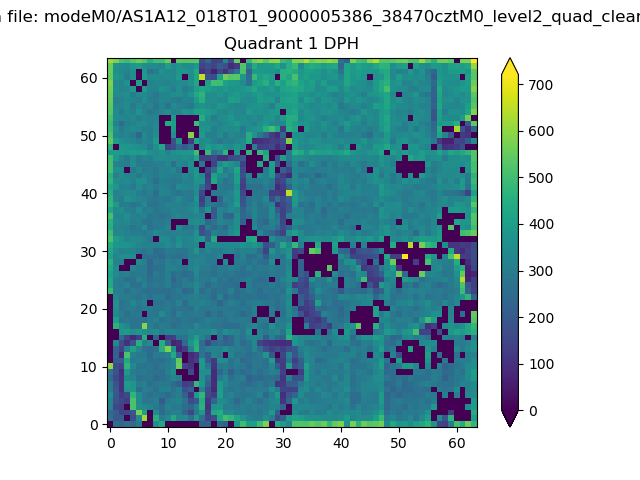 |
Quadrant B |
|---|---|---|---|
| Quadrant D | 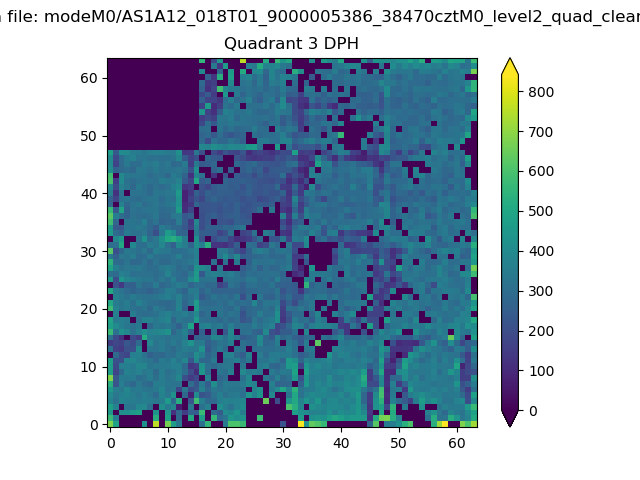 |
 |
Quadrant C |
| Plot type | Count rate plots | Images |
|---|---|---|
| Comparison with Poisson distribution Blue bars denote a histogram of data divided into 1 sec bins. Red curve is a Poisson curve with rate = median count rate of data. |
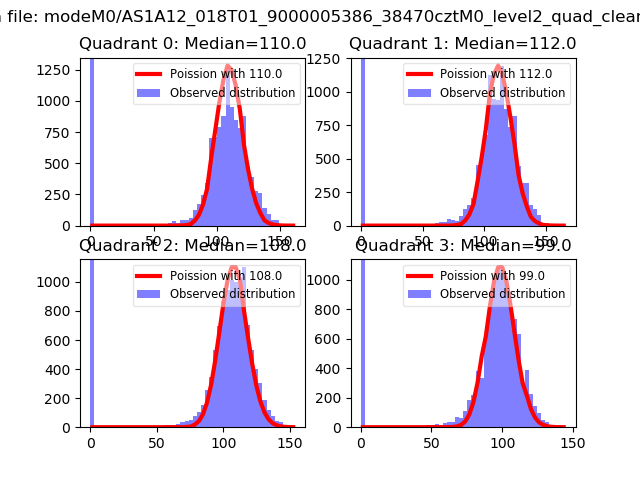 |
 |
| Quadrant-wise count rates Data is divided into 100 sec bins |
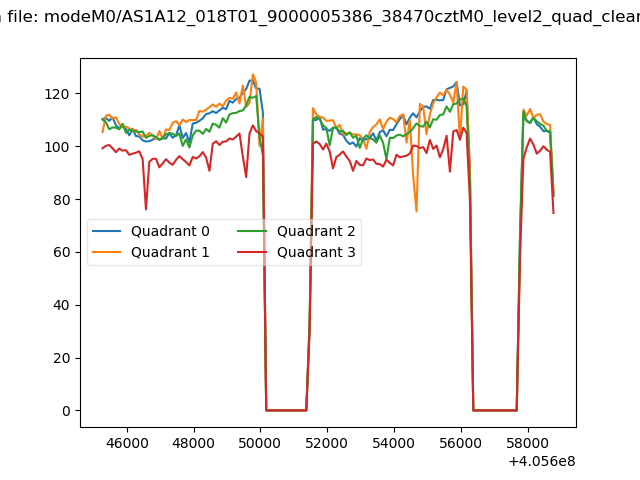 |
|
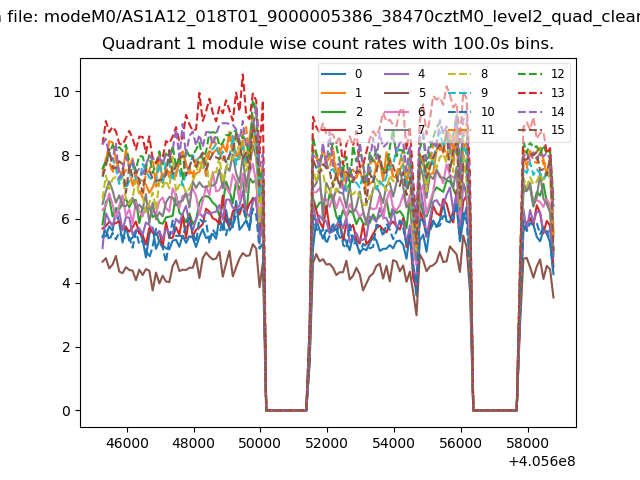
| Module-wise count rates for Quadrant A Data is divided into 100 sec bins |
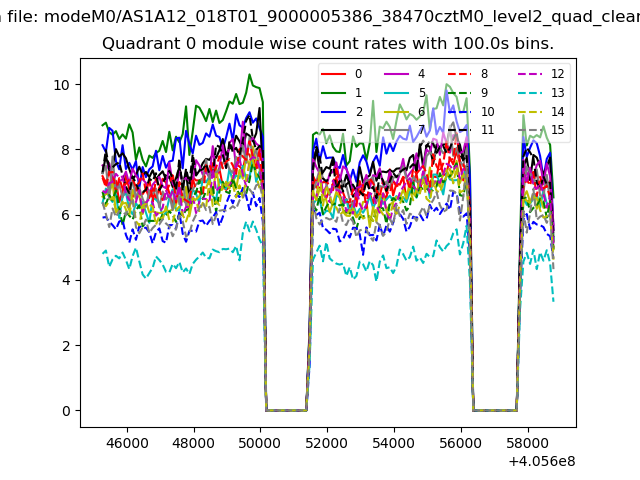 |
 |
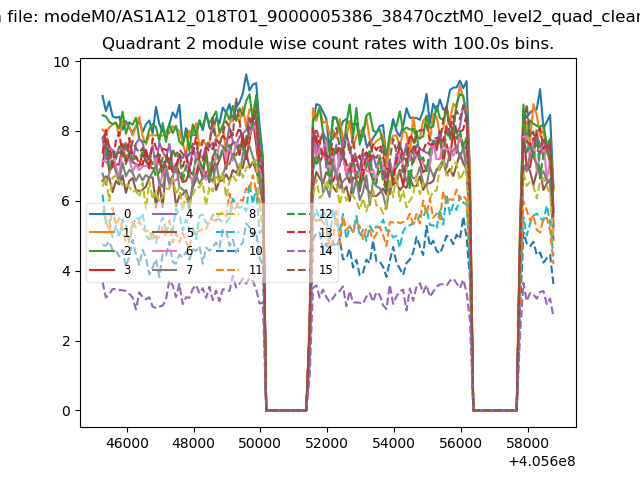
| Module-wise count rates for Quadrant B Data is divided into 100 sec bins |
 |
 |
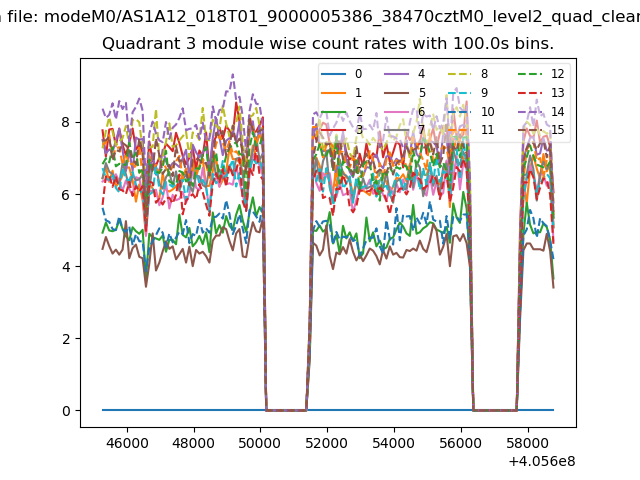
| Module-wise count rates for Quadrant C Data is divided into 100 sec bins |
 |
 |
| Module-wise count rates for Quadrant D Data is divided into 100 sec bins |
 |
 |
| Parameter | Plot |
|---|---|
| CZT HV Monitor | 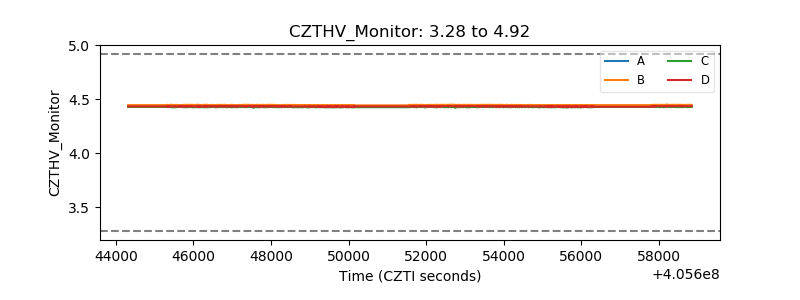 |
| D_VDD | 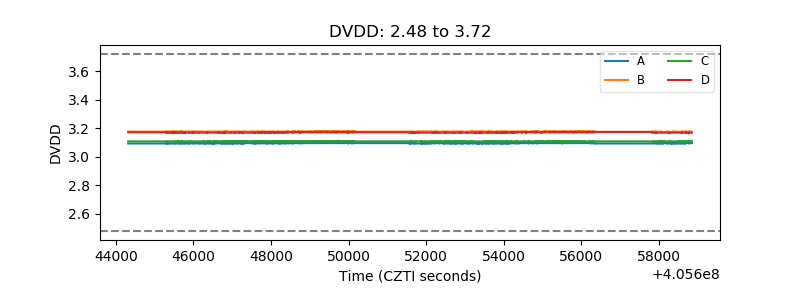 |
| Temperature 1 | 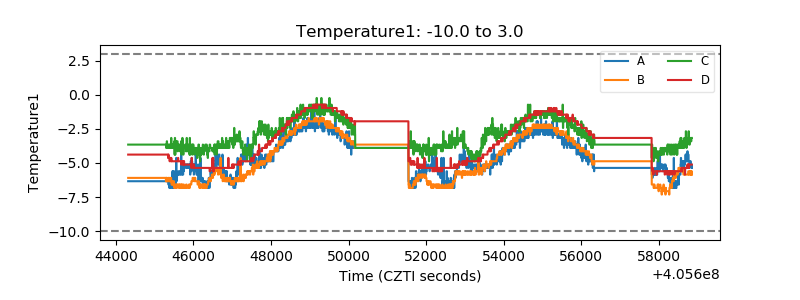 |
| Veto HV Monitor |  |
| Veto LLD | 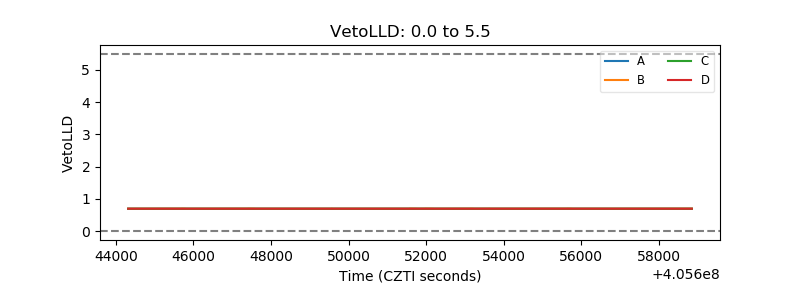 |
| Alpha Counter | 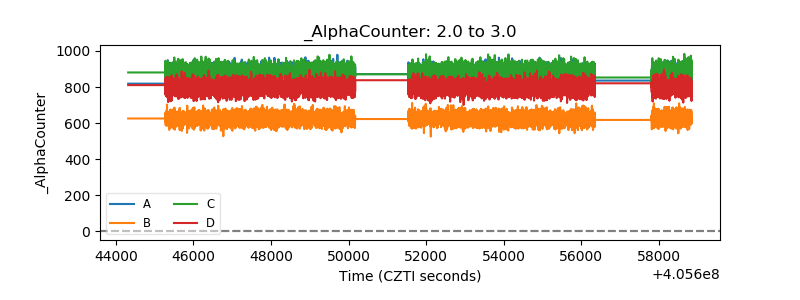 |
| _CPM_Rate | 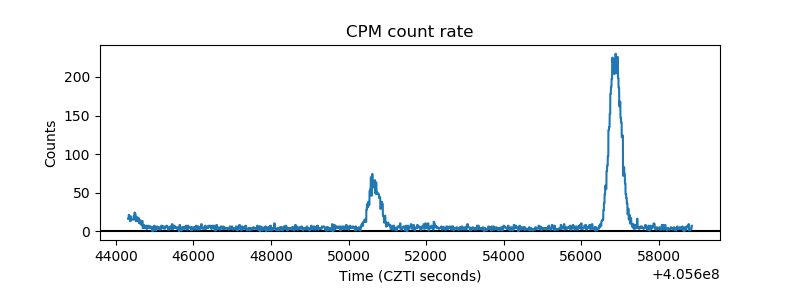 |
| CZT Counter | 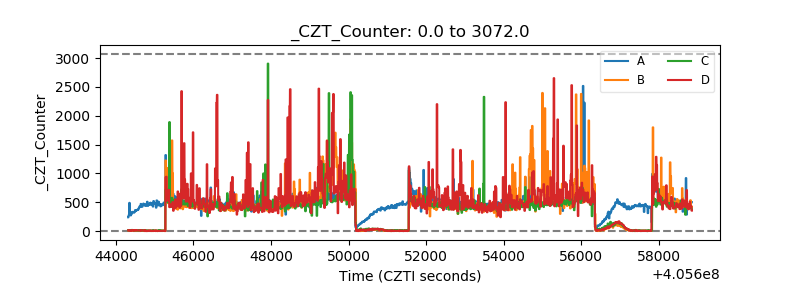 |
| +2.5 Volts monitor | 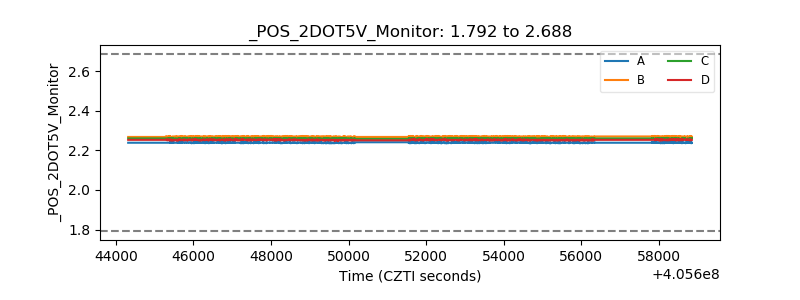 |
| +5 Volts monitor |  |
| _ROLL_ROT | 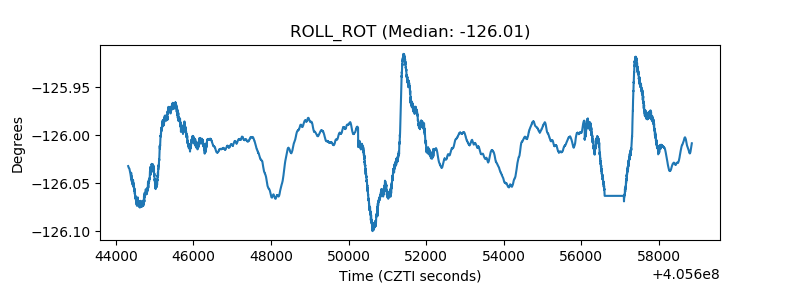 |
| _Roll_DEC | 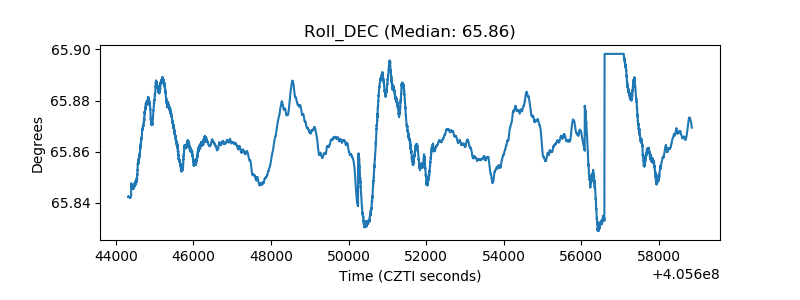 |
| _Roll_RA | 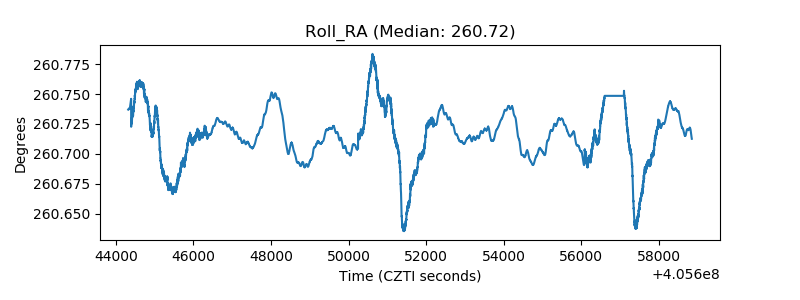 |
| Veto Counter | 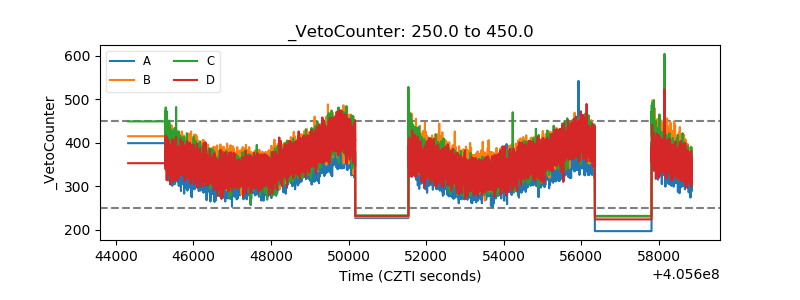 |