| Param | Original file | Final file |
|---|---|---|
| Filename | modeM0/AS1A12_018T01_9000005386_38472cztM0_level2.fits | modeM0/AS1A12_018T01_9000005386_38472cztM0_level2_quad_clean.evt |
| Size (bytes) | 359,259,840 | 89,038,080 |
| Size | 342.6 MB | 84.9 MB |
| Events in quadrant A | 2,807,374 | 616,028 |
| Events in quadrant B | 4,137,663 | 589,261 |
| Events in quadrant C | 2,533,944 | 591,864 |
| Events in quadrant D | 3,405,263 | 526,000 |
| Mode SS | |||
|---|---|---|---|
| Quadrant | BADHDUFLAG | Total packets | Discarded packets |
| A | 0 | 110 | 0 |
| B | 0 | 110 | 0 |
| C | 0 | 110 | 0 |
| D | 0 | 110 | 0 |
| Mode M9 | |||
|---|---|---|---|
| Quadrant | BADHDUFLAG | Total packets | Discarded packets |
| A | 0 | 17 | 0 |
| B | 0 | 17 | 0 |
| C | 0 | 17 | 0 |
| D | 0 | 17 | 0 |
| Mode M0 | |||
|---|---|---|---|
| Quadrant | BADHDUFLAG | Total packets | Discarded packets |
| A | 0 | 11551 | 2 |
| B | 0 | 15760 | 1 |
| C | 0 | 10877 | 1 |
| D | 0 | 13824 | 1 |
| Quadrant | Total seconds | Saturated seconds | Saturation percentage |
|---|---|---|---|
| A | 5320 | 16 | 0.300752% |
| B | 5320 | 464 | 8.721805% |
| C | 5320 | 8 | 0.150376% |
| D | 5320 | 256 | 4.812030% |
Noise dominated data is calculated using 1-second bins in cleaned event files. If a bin has >2000 counts, and if more than 50% of those come from <1% of pixels, then it is considered to be noise-dominated and hence unusable.
| Quadrant | # 1 sec bins | Bins with >0 counts | Bins with >2000 counts | High rate bins dominated by noise | Noise dominated (total time) | Noise dominated (detector-on time) | Marked lightcurve |
|---|---|---|---|---|---|---|---|
| A | 7052 | 5321 | 5 | 5 | 0.07% | 0.09% | 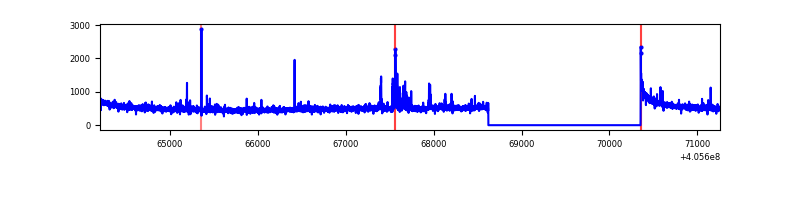 |
| B | 7052 | 5321 | 315 | 315 | 4.47% | 5.92% | 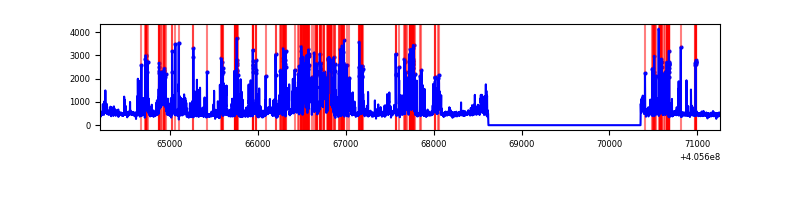 |
| C | 7052 | 5321 | 5 | 5 | 0.07% | 0.09% | 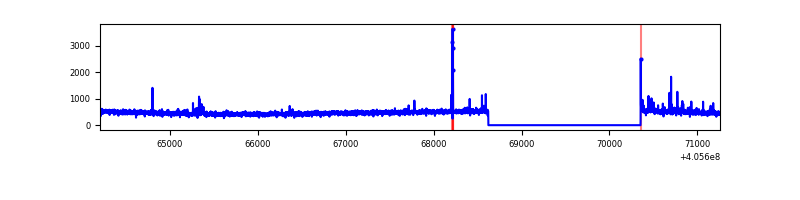 |
| D | 7052 | 5321 | 199 | 199 | 2.82% | 3.74% | 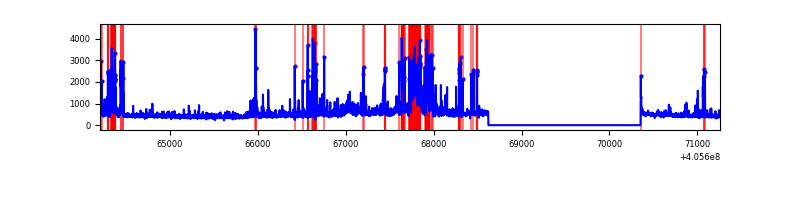 |
Top three noisy pixels from each quadrant. If the there are fewer than three noisy pixels in the level2.evt file, extra rows are filled as -1
| Pixel properties | Quadrant properties | ||||||
|---|---|---|---|---|---|---|---|
| Quadrant | DetID | PixID | Counts | Sigma | Mean | Median | Sigma |
| A | 10 | 83 | 353347 | 2894.8 | 601 | 587 | 121.9 |
| A | 9 | 143 | 95475 | 778.66 | 601 | 587 | 121.9 |
| A | 12 | 189 | 30086 | 242.07 | 601 | 587 | 121.9 |
| B | 8 | 3 | 1525806 | 13915.84 | 568 | 552 | 109.6 |
| B | 4 | 232 | 124779 | 1133.4 | 568 | 552 | 109.6 |
| B | 0 | 221 | 122610 | 1113.61 | 568 | 552 | 109.6 |
| C | 15 | 214 | 222392 | 1660.64 | 576 | 579 | 133.6 |
| C | 14 | 254 | 31316 | 230.12 | 576 | 579 | 133.6 |
| C | 1 | 23 | 16269 | 117.47 | 576 | 579 | 133.6 |
| D | 13 | 249 | 536950 | 3899.01 | 564 | 547 | 137.6 |
| D | 12 | 235 | 210762 | 1528.01 | 564 | 547 | 137.6 |
| D | 10 | 118 | 157295 | 1139.37 | 564 | 547 | 137.6 |
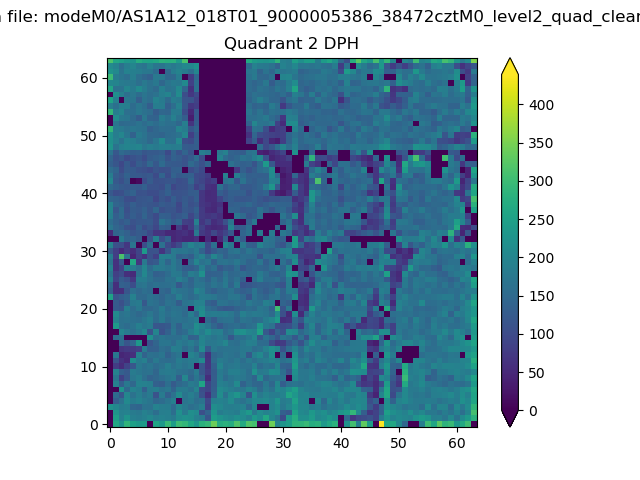
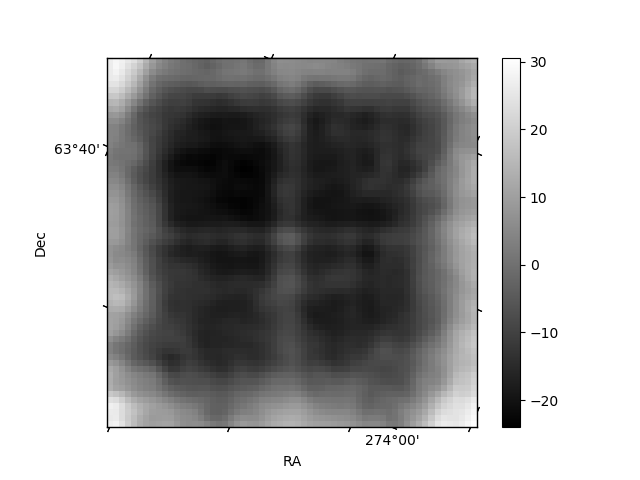
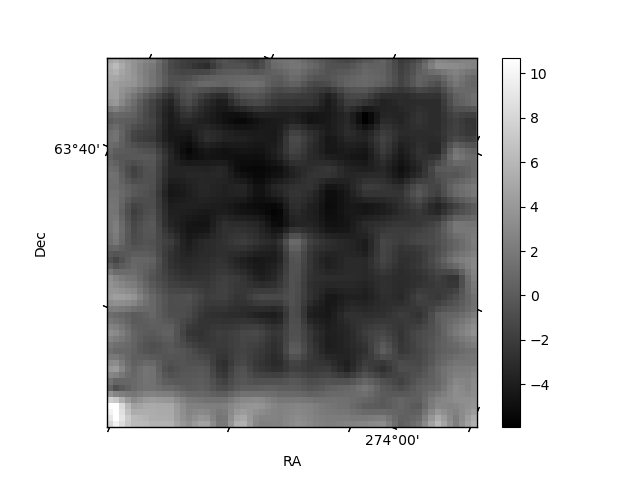
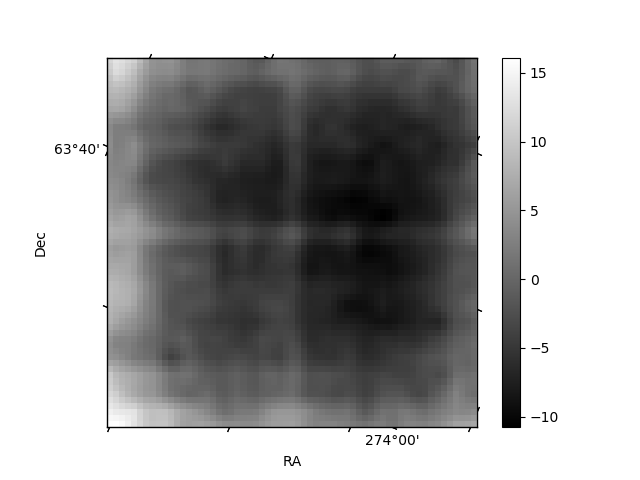
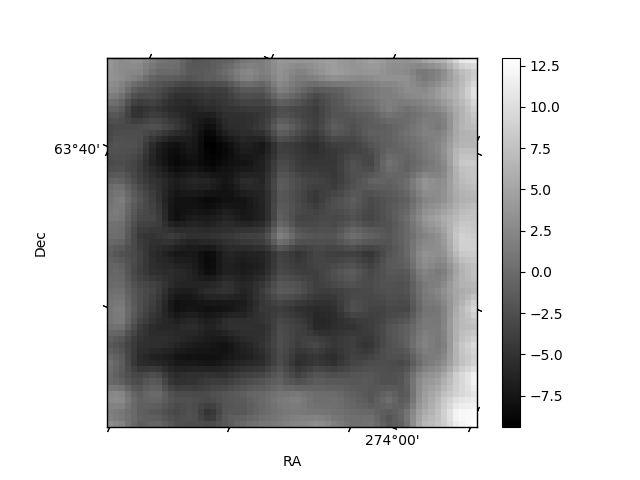
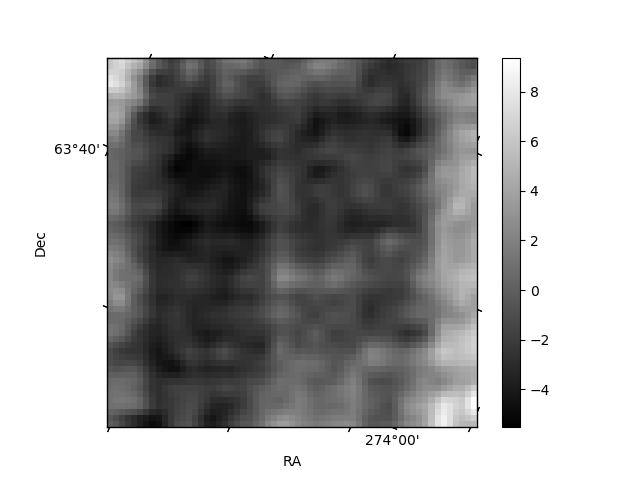
Histogram calculated using DETX and DETY for each event in the final _common_clean file
| Quadrant A | 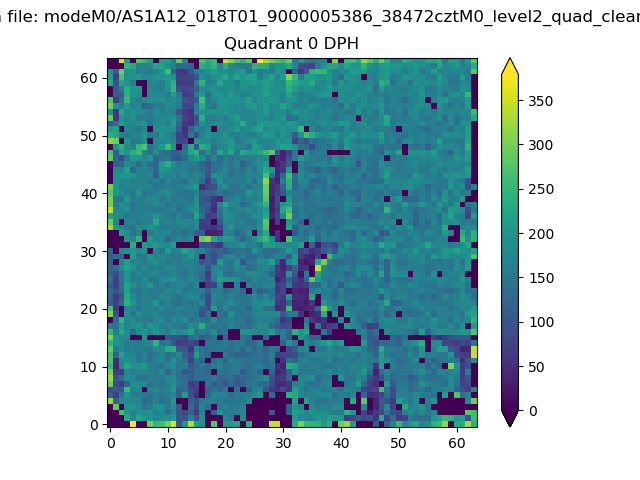 |
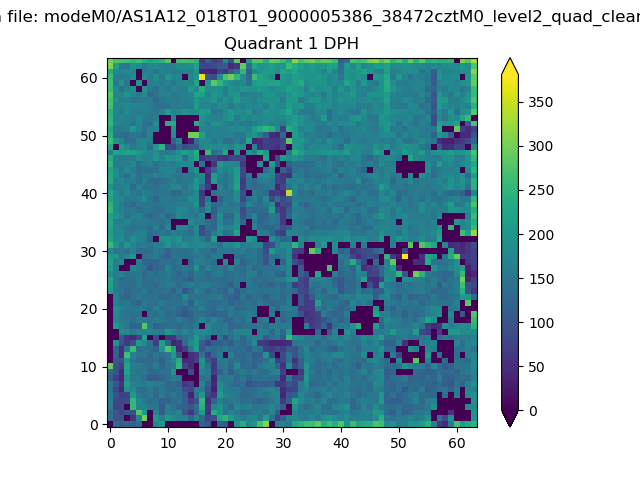 |
Quadrant B |
|---|---|---|---|
| Quadrant D | 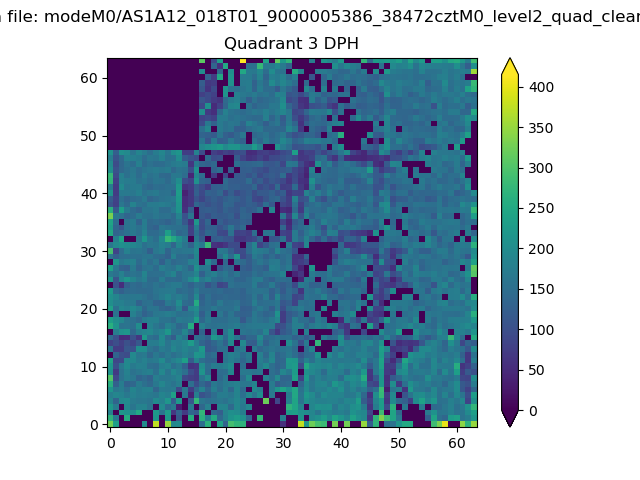 |
 |
Quadrant C |
| Plot type | Count rate plots | Images |
|---|---|---|
| Comparison with Poisson distribution Blue bars denote a histogram of data divided into 1 sec bins. Red curve is a Poisson curve with rate = median count rate of data. |
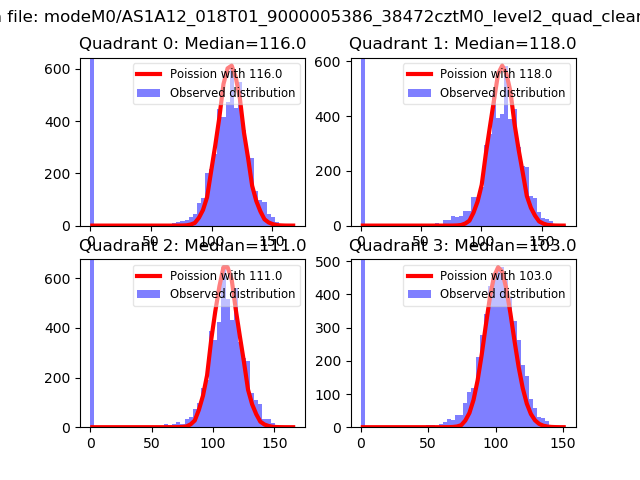 |
 |
| Quadrant-wise count rates Data is divided into 100 sec bins |
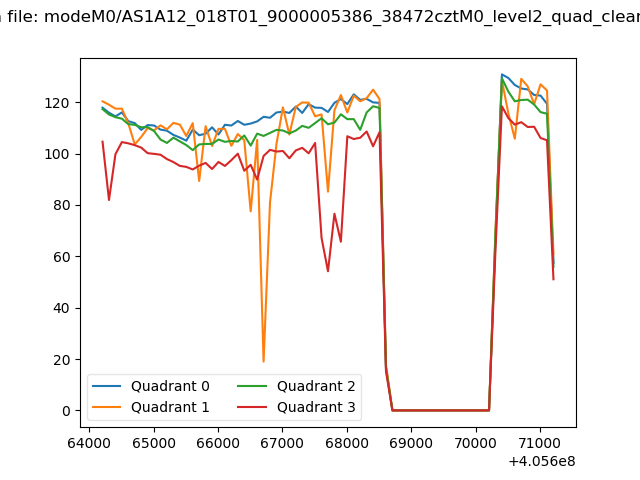 |
|
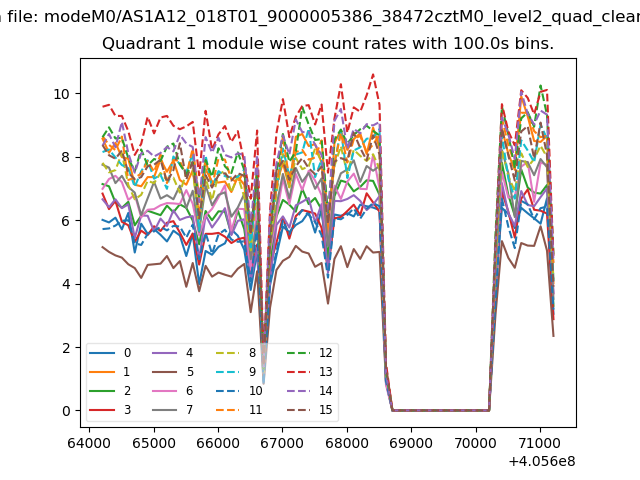
| Module-wise count rates for Quadrant A Data is divided into 100 sec bins |
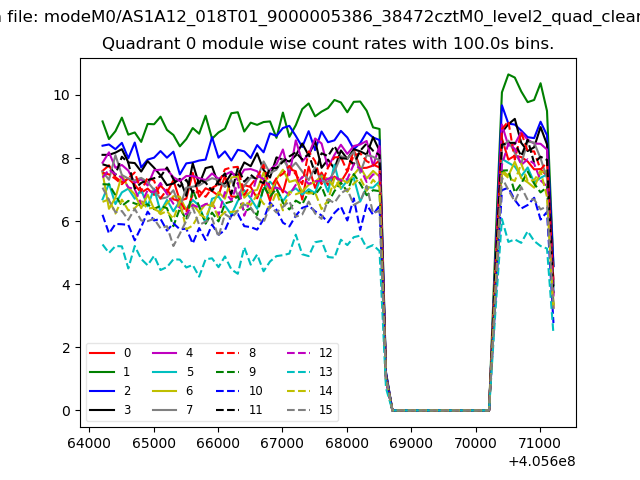 |
 |
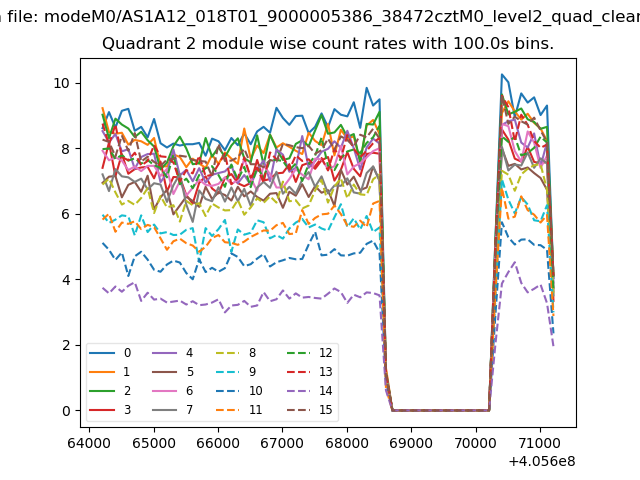
| Module-wise count rates for Quadrant B Data is divided into 100 sec bins |
 |
 |
| Module-wise count rates for Quadrant C Data is divided into 100 sec bins |
 |
 |
| Module-wise count rates for Quadrant D Data is divided into 100 sec bins |
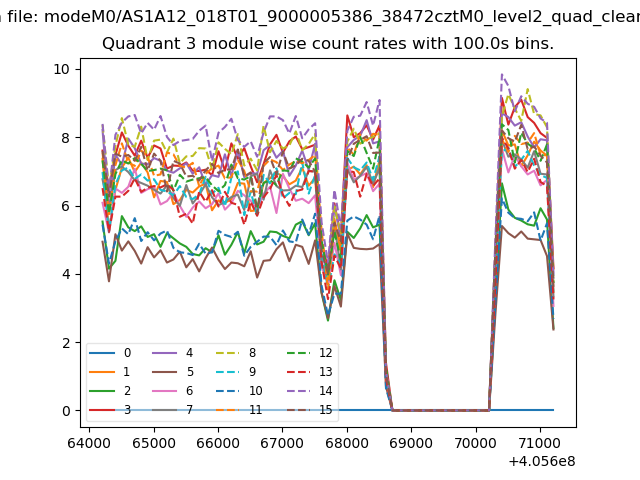 |
 |
| Parameter | Plot |
|---|---|
| CZT HV Monitor | 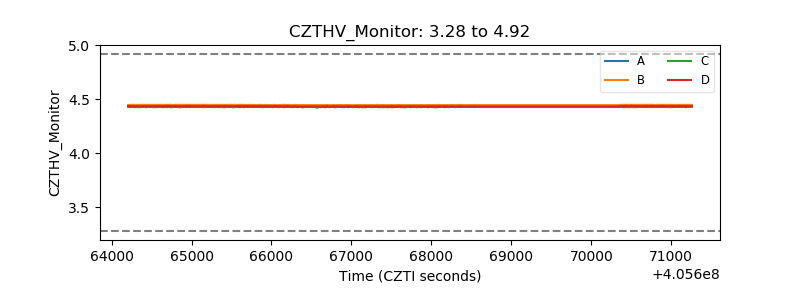 |
| D_VDD | 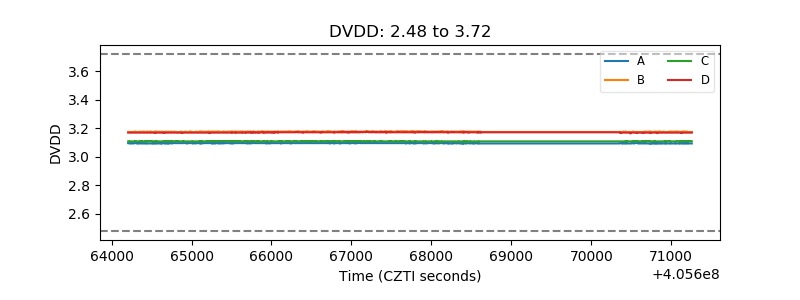 |
| Temperature 1 | 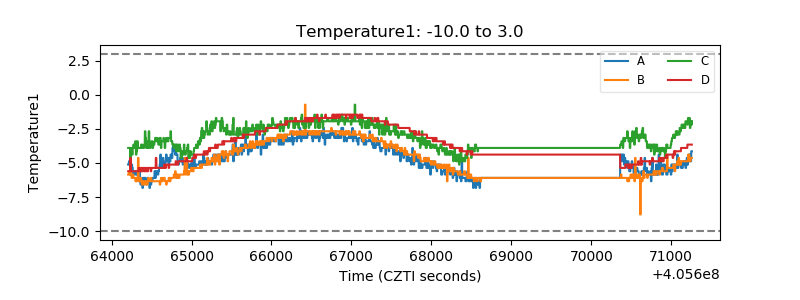 |
| Veto HV Monitor | 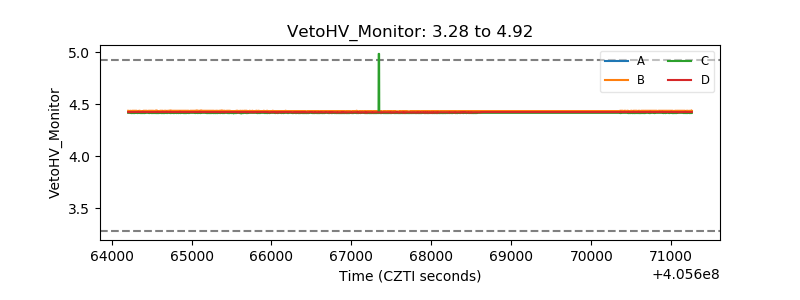 |
| Veto LLD | 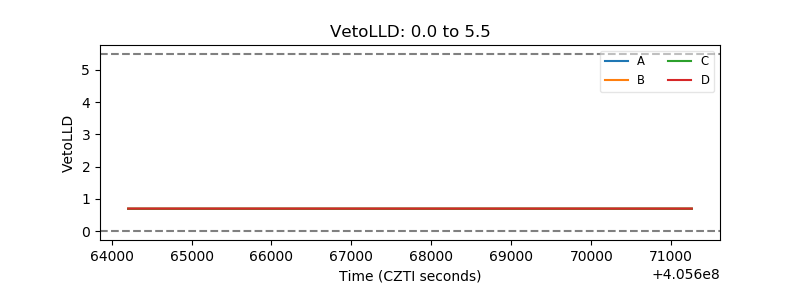 |
| Alpha Counter | 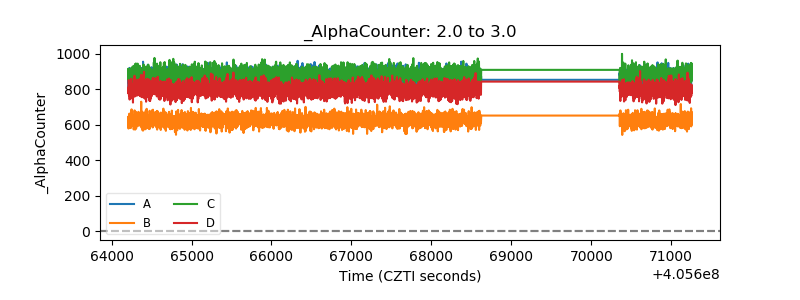 |
| _CPM_Rate | 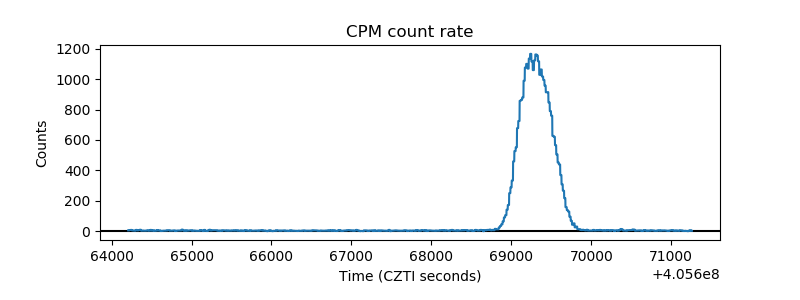 |
| CZT Counter | 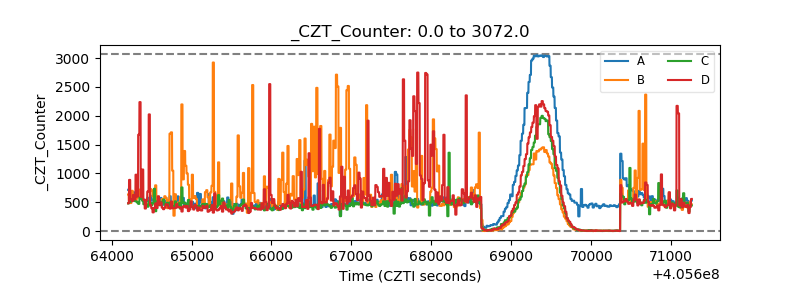 |
| +2.5 Volts monitor | 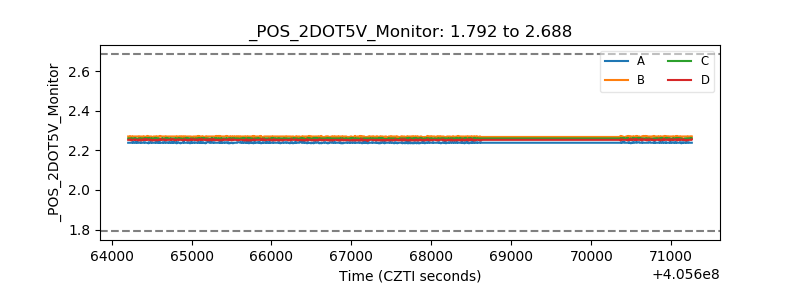 |
| +5 Volts monitor | 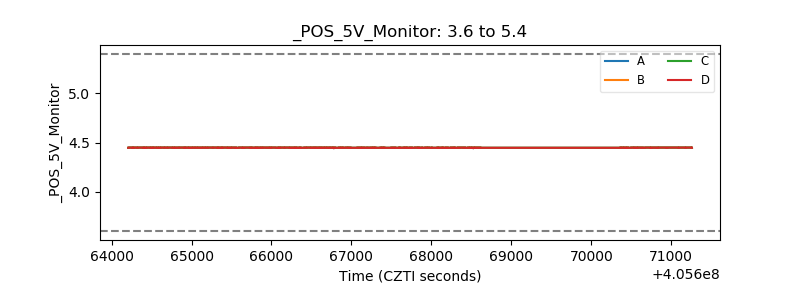 |
| _ROLL_ROT | 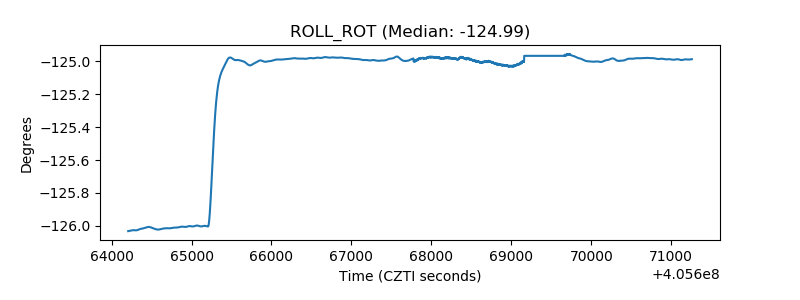 |
| _Roll_DEC | 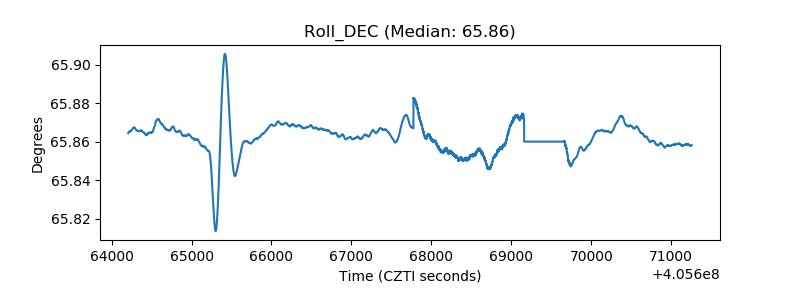 |
| _Roll_RA | 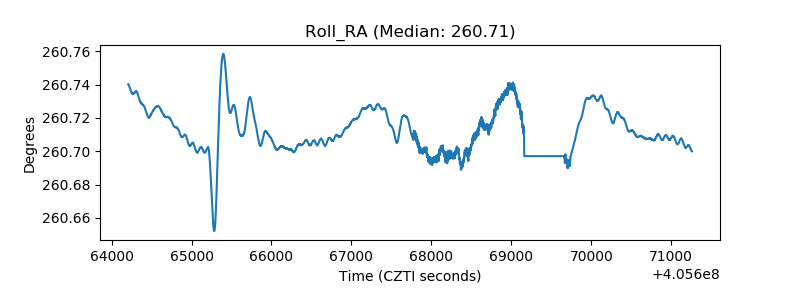 |
| Veto Counter | 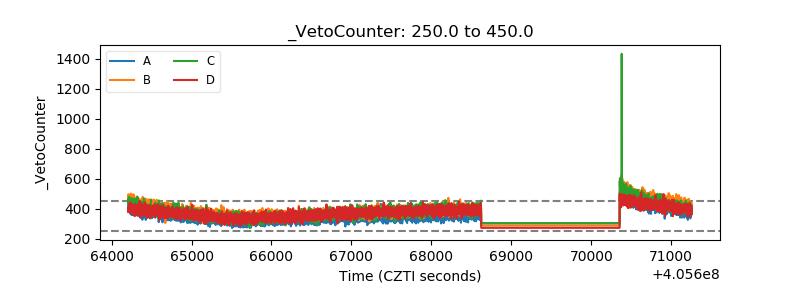 |