| Param | Original file | Final file |
|---|---|---|
| Filename | modeM0/AS1A12_018T01_9000005386_38474cztM0_level2.fits | modeM0/AS1A12_018T01_9000005386_38474cztM0_level2_quad_clean.evt |
| Size (bytes) | 349,761,600 | 92,790,720 |
| Size | 333.6 MB | 88.5 MB |
| Events in quadrant A | 2,809,929 | 651,272 |
| Events in quadrant B | 3,753,254 | 619,807 |
| Events in quadrant C | 2,606,486 | 614,735 |
| Events in quadrant D | 3,365,135 | 553,968 |
| Mode SS | |||
|---|---|---|---|
| Quadrant | BADHDUFLAG | Total packets | Discarded packets |
| A | 0 | 106 | 0 |
| B | 0 | 106 | 0 |
| C | 0 | 106 | 0 |
| D | 0 | 106 | 0 |
| Mode M9 | |||
|---|---|---|---|
| Quadrant | BADHDUFLAG | Total packets | Discarded packets |
| A | 0 | 25 | 0 |
| B | 0 | 25 | 0 |
| C | 0 | 25 | 0 |
| D | 0 | 26 | 0 |
| Mode M0 | |||
|---|---|---|---|
| Quadrant | BADHDUFLAG | Total packets | Discarded packets |
| A | 0 | 11523 | 3 |
| B | 0 | 14619 | 2 |
| C | 0 | 10940 | 4 |
| D | 0 | 13550 | 6 |
| Quadrant | Total seconds | Saturated seconds | Saturation percentage |
|---|---|---|---|
| A | 5292 | 15 | 0.283447% |
| B | 5292 | 435 | 8.219955% |
| C | 5291 | 7 | 0.132300% |
| D | 5291 | 212 | 4.006804% |
Noise dominated data is calculated using 1-second bins in cleaned event files. If a bin has >2000 counts, and if more than 50% of those come from <1% of pixels, then it is considered to be noise-dominated and hence unusable.
| Quadrant | # 1 sec bins | Bins with >0 counts | Bins with >2000 counts | High rate bins dominated by noise | Noise dominated (total time) | Noise dominated (detector-on time) | Marked lightcurve |
|---|---|---|---|---|---|---|---|
| A | 7145 | 5293 | 3 | 3 | 0.04% | 0.06% | 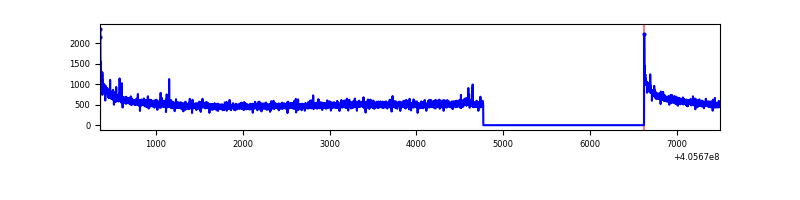 |
| B | 7145 | 5293 | 342 | 342 | 4.79% | 6.46% | 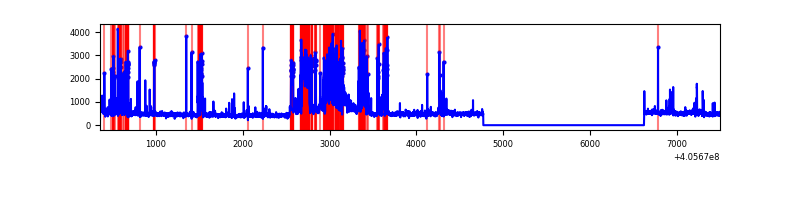 |
| C | 7145 | 5293 | 4 | 4 | 0.06% | 0.08% | 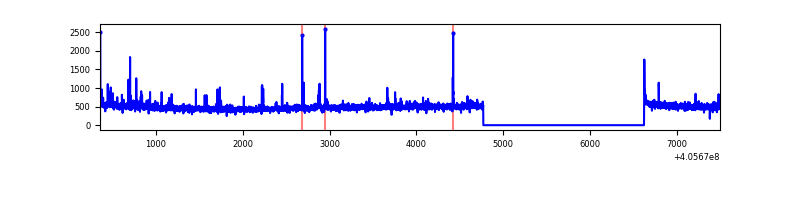 |
| D | 7145 | 5293 | 188 | 188 | 2.63% | 3.55% | 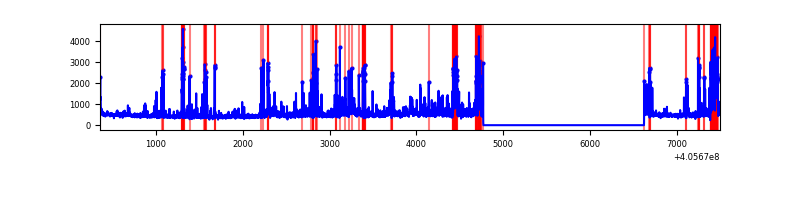 |
Top three noisy pixels from each quadrant. If the there are fewer than three noisy pixels in the level2.evt file, extra rows are filled as -1
| Pixel properties | Quadrant properties | ||||||
|---|---|---|---|---|---|---|---|
| Quadrant | DetID | PixID | Counts | Sigma | Mean | Median | Sigma |
| A | 10 | 83 | 389352 | 3117.25 | 615 | 603 | 124.7 |
| A | 9 | 143 | 15561 | 119.94 | 615 | 603 | 124.7 |
| A | 13 | 6 | 10499 | 79.35 | 615 | 603 | 124.7 |
| B | 8 | 3 | 880675 | 8010.97 | 582 | 566 | 109.9 |
| B | 4 | 232 | 516166 | 4693.12 | 582 | 566 | 109.9 |
| B | 4 | 171 | 19605 | 173.29 | 582 | 566 | 109.9 |
| C | 15 | 214 | 223573 | 1653.94 | 584 | 588 | 134.8 |
| C | 14 | 254 | 80551 | 593.11 | 584 | 588 | 134.8 |
| C | 0 | 10 | 15015 | 107.01 | 584 | 588 | 134.8 |
| D | 12 | 233 | 263378 | 1870.92 | 581 | 564 | 140.5 |
| D | 13 | 249 | 237000 | 1683.14 | 581 | 564 | 140.5 |
| D | 7 | 223 | 211774 | 1503.56 | 581 | 564 | 140.5 |
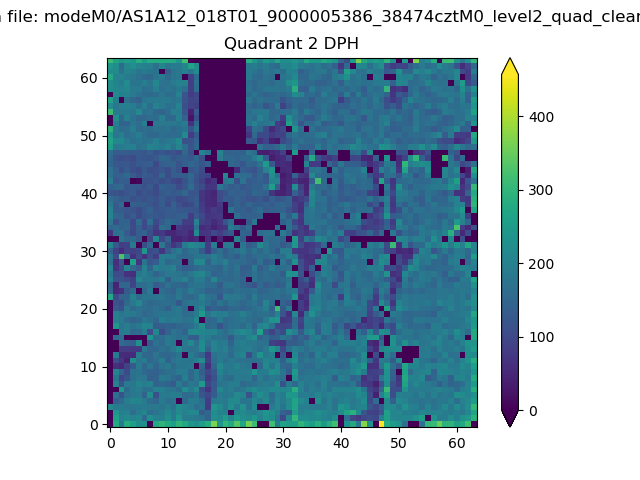
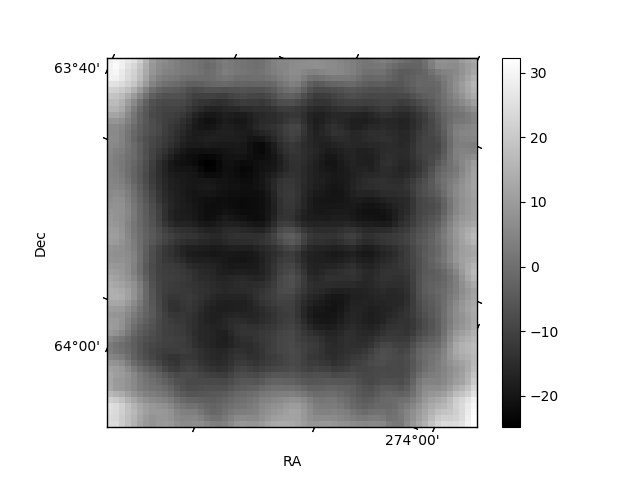
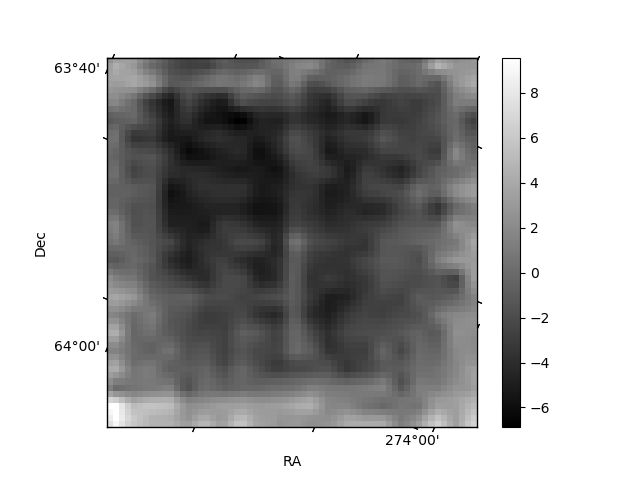
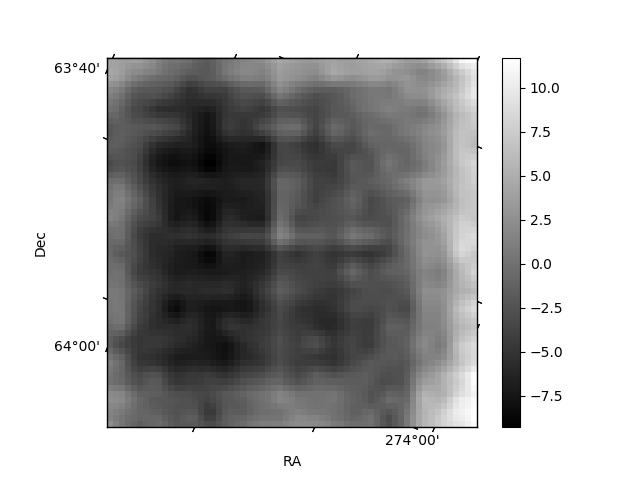
Histogram calculated using DETX and DETY for each event in the final _common_clean file
| Quadrant A | 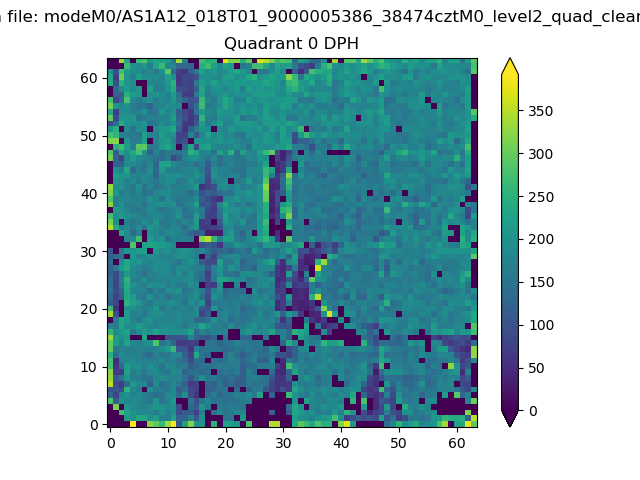 |
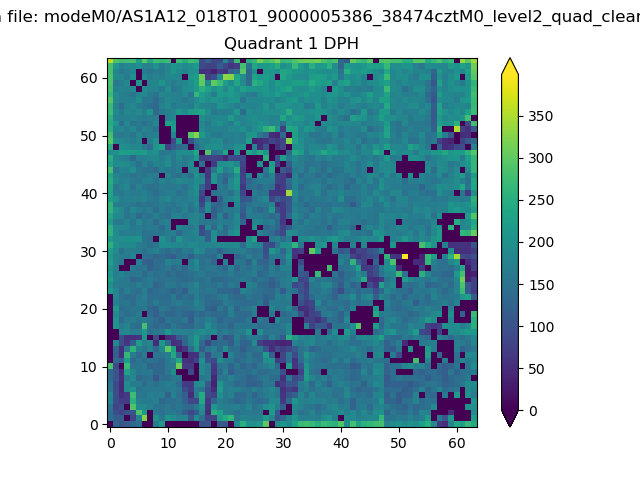 |
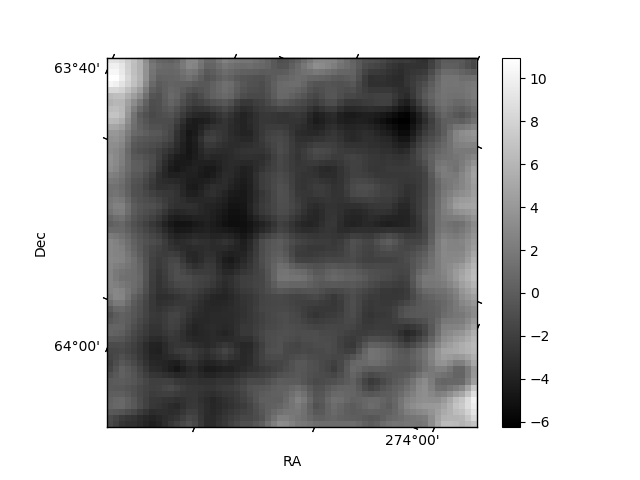
Quadrant B |
|---|---|---|---|
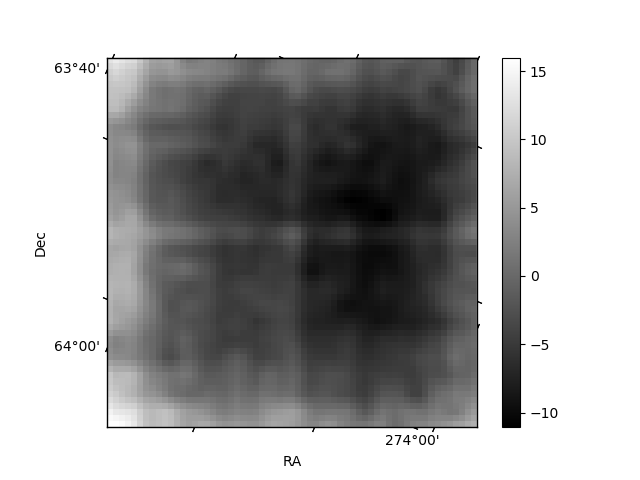
| Quadrant D | 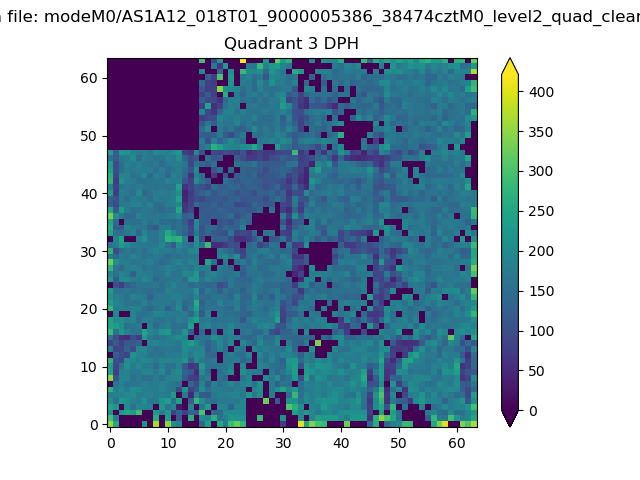 |
 |
Quadrant C |
| Plot type | Count rate plots | Images |
|---|---|---|
| Comparison with Poisson distribution Blue bars denote a histogram of data divided into 1 sec bins. Red curve is a Poisson curve with rate = median count rate of data. |
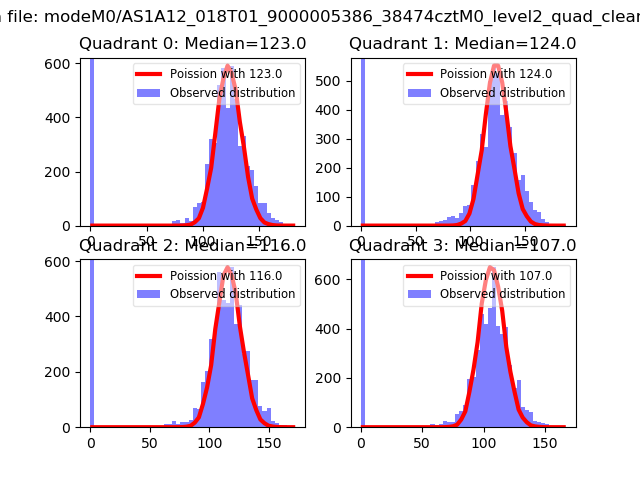 |
 |
| Quadrant-wise count rates Data is divided into 100 sec bins |
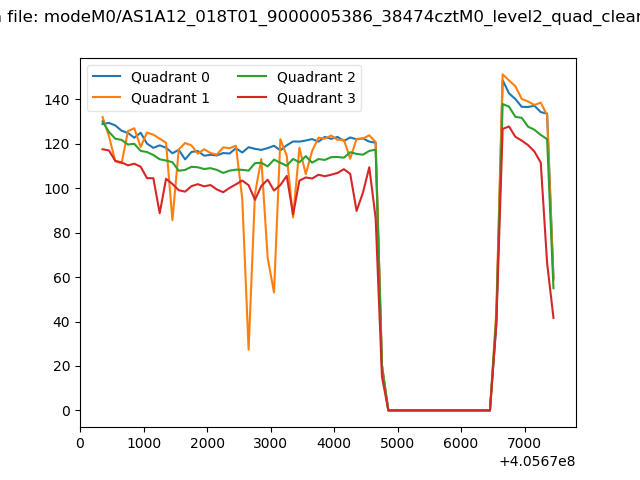 |
|
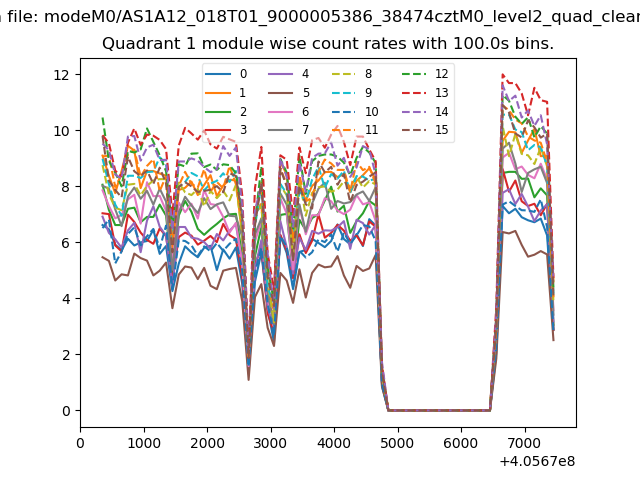
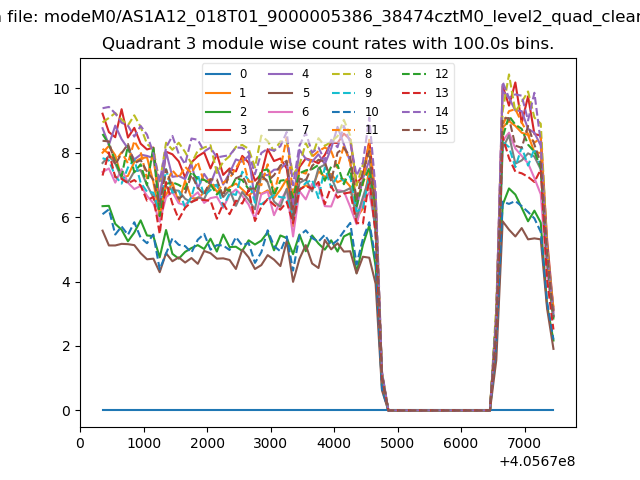
| Module-wise count rates for Quadrant A Data is divided into 100 sec bins |
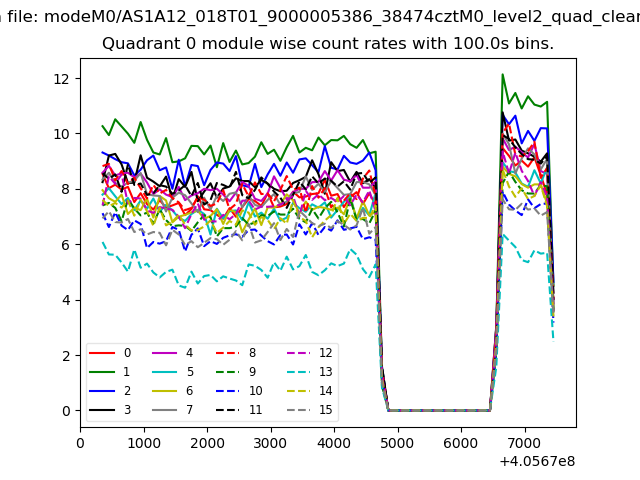 |
 |
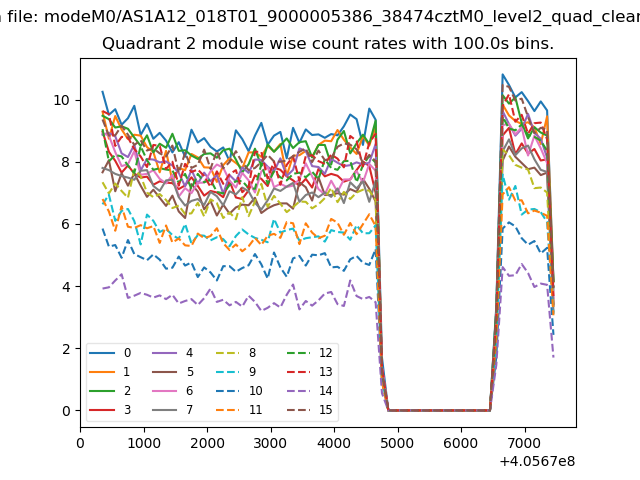
| Module-wise count rates for Quadrant B Data is divided into 100 sec bins |
 |
 |
| Module-wise count rates for Quadrant C Data is divided into 100 sec bins |
 |
 |
| Module-wise count rates for Quadrant D Data is divided into 100 sec bins |
 |
 |
| Parameter | Plot |
|---|---|
| CZT HV Monitor | 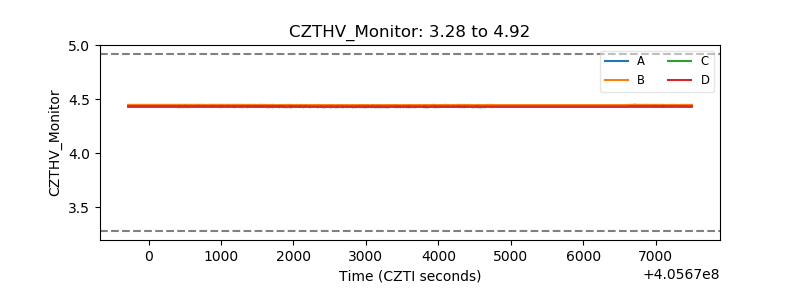 |
| D_VDD | 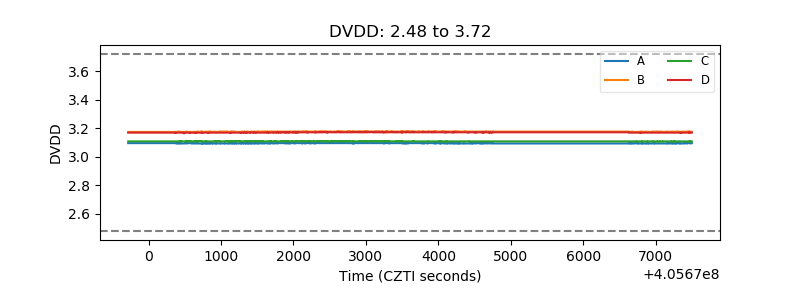 |
| Temperature 1 | 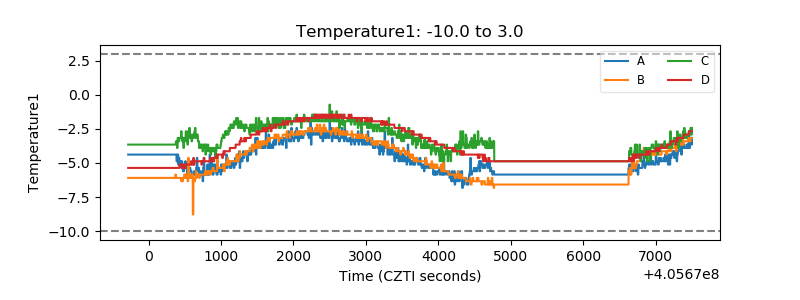 |
| Veto HV Monitor | 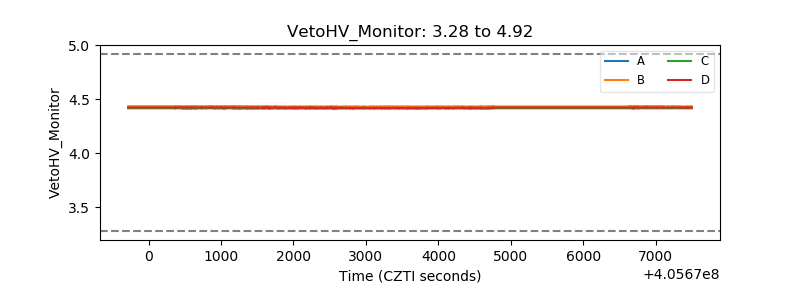 |
| Veto LLD | 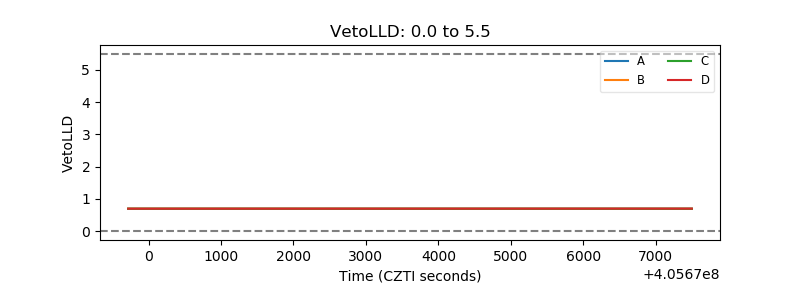 |
| Alpha Counter | 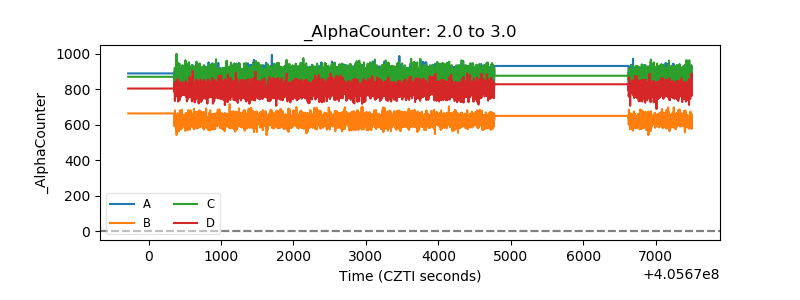 |
| _CPM_Rate | 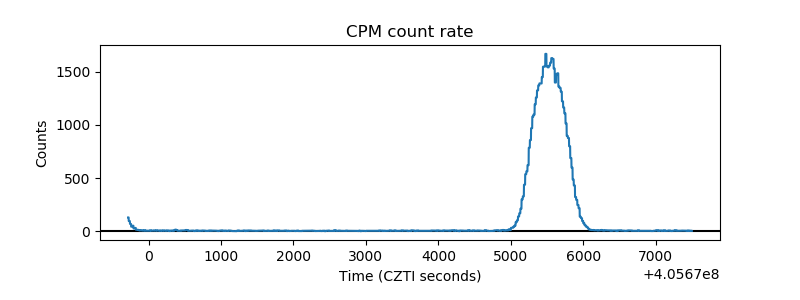 |
| CZT Counter | 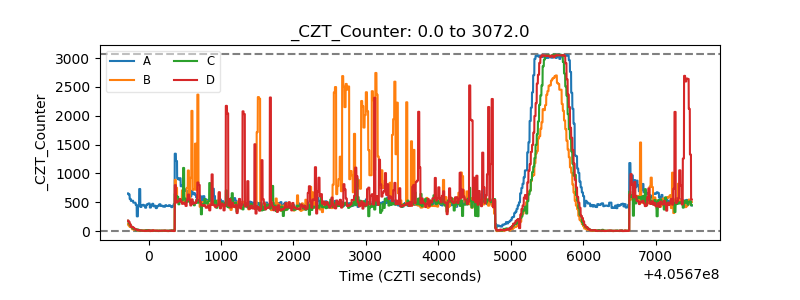 |
| +2.5 Volts monitor | 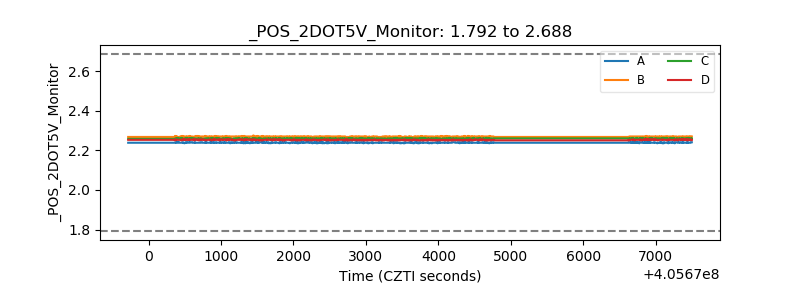 |
| +5 Volts monitor | 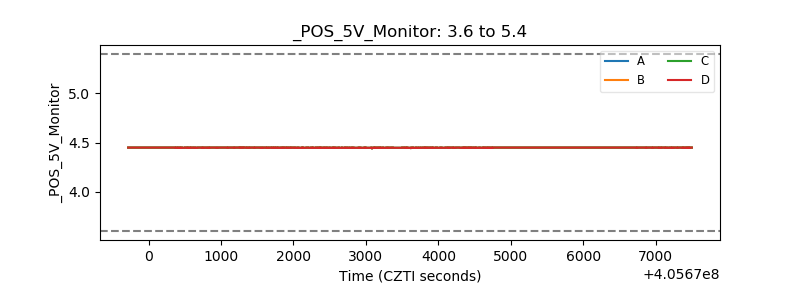 |
| _ROLL_ROT | 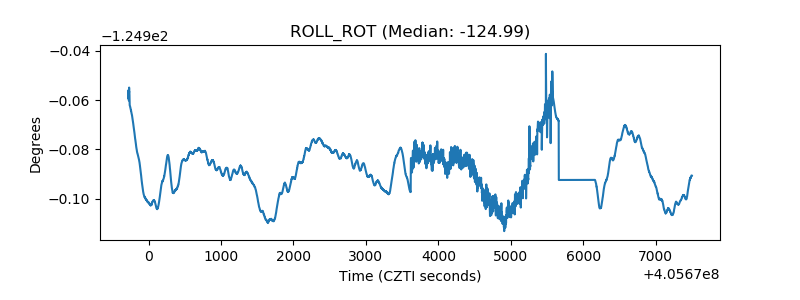 |
| _Roll_DEC | 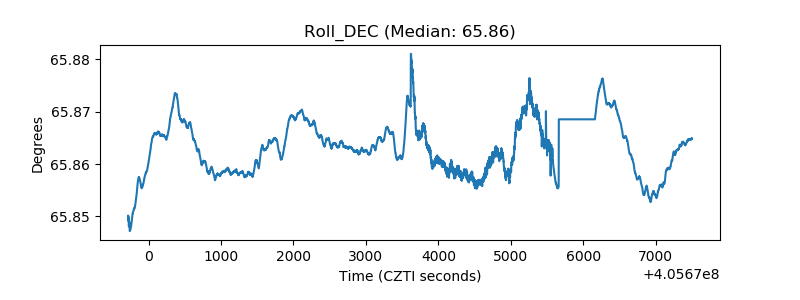 |
| _Roll_RA | 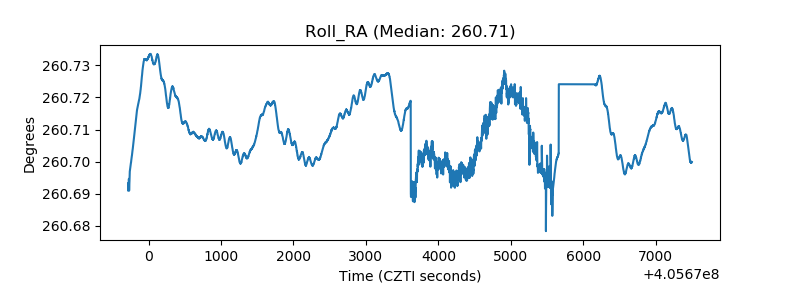 |
| Veto Counter | 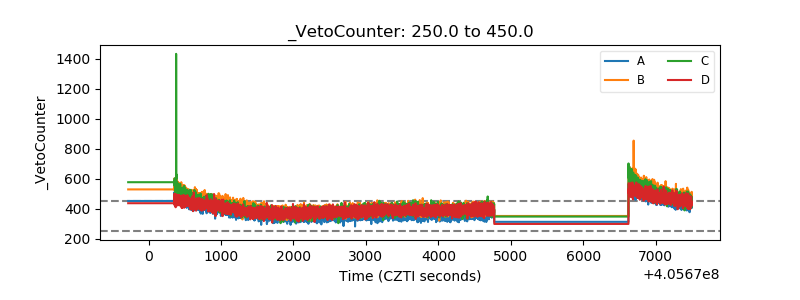 |