| Param | Original file | Final file |
|---|---|---|
| Filename | modeM0/AS1A12_018T01_9000005386_38475cztM0_level2.fits | modeM0/AS1A12_018T01_9000005386_38475cztM0_level2_quad_clean.evt |
| Size (bytes) | 371,108,160 | 93,041,280 |
| Size | 353.9 MB | 88.7 MB |
| Events in quadrant A | 2,825,488 | 664,590 |
| Events in quadrant B | 4,467,835 | 612,583 |
| Events in quadrant C | 2,557,517 | 620,627 |
| Events in quadrant D | 3,490,055 | 562,716 |
| Mode SS | |||
|---|---|---|---|
| Quadrant | BADHDUFLAG | Total packets | Discarded packets |
| A | 0 | 104 | 0 |
| B | 0 | 104 | 0 |
| C | 0 | 104 | 0 |
| D | 0 | 104 | 0 |
| Mode M9 | |||
|---|---|---|---|
| Quadrant | BADHDUFLAG | Total packets | Discarded packets |
| A | 0 | 23 | 0 |
| B | 0 | 23 | 0 |
| C | 0 | 23 | 0 |
| D | 0 | 24 | 0 |
| Mode M0 | |||
|---|---|---|---|
| Quadrant | BADHDUFLAG | Total packets | Discarded packets |
| A | 0 | 11391 | 3 |
| B | 0 | 16652 | 2 |
| C | 0 | 10532 | 2 |
| D | 0 | 13614 | 2 |
| Quadrant | Total seconds | Saturated seconds | Saturation percentage |
|---|---|---|---|
| A | 5092 | 16 | 0.314218% |
| B | 5092 | 595 | 11.684996% |
| C | 5092 | 6 | 0.117832% |
| D | 5092 | 236 | 4.634721% |
Noise dominated data is calculated using 1-second bins in cleaned event files. If a bin has >2000 counts, and if more than 50% of those come from <1% of pixels, then it is considered to be noise-dominated and hence unusable.
| Quadrant | # 1 sec bins | Bins with >0 counts | Bins with >2000 counts | High rate bins dominated by noise | Noise dominated (total time) | Noise dominated (detector-on time) | Marked lightcurve |
|---|---|---|---|---|---|---|---|
| A | 7065 | 5093 | 2 | 2 | 0.03% | 0.04% | 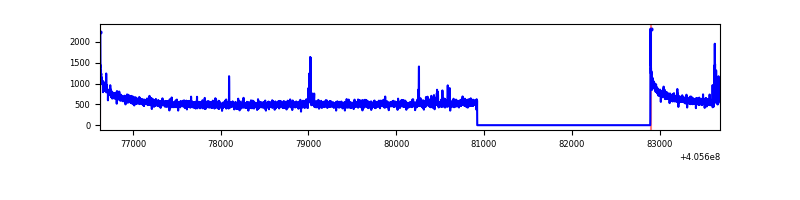 |
| B | 7065 | 5093 | 444 | 444 | 6.28% | 8.72% | 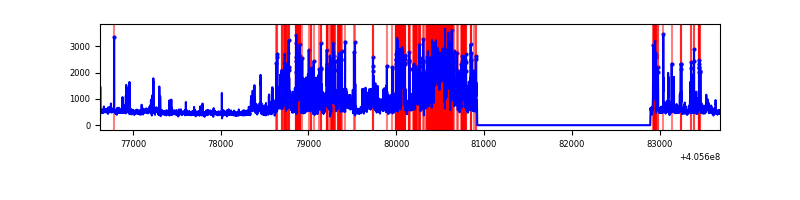 |
| C | 7065 | 5093 | 4 | 4 | 0.06% | 0.08% | 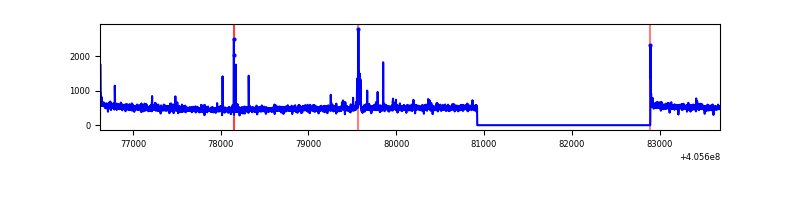 |
| D | 7065 | 5093 | 198 | 198 | 2.80% | 3.89% | 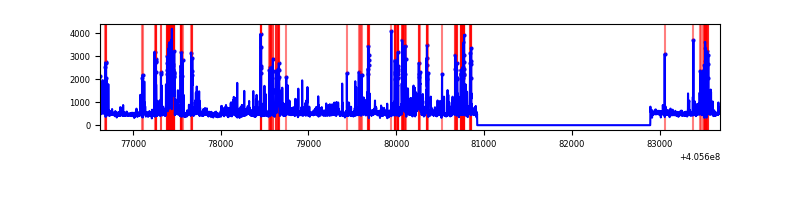 |
Top three noisy pixels from each quadrant. If the there are fewer than three noisy pixels in the level2.evt file, extra rows are filled as -1
| Pixel properties | Quadrant properties | ||||||
|---|---|---|---|---|---|---|---|
| Quadrant | DetID | PixID | Counts | Sigma | Mean | Median | Sigma |
| A | 10 | 83 | 382635 | 3136.92 | 609 | 599 | 121.8 |
| A | 13 | 248 | 33708 | 271.86 | 609 | 599 | 121.8 |
| A | 12 | 189 | 31780 | 256.03 | 609 | 599 | 121.8 |
| B | 8 | 3 | 1852059 | 17167.82 | 572 | 559 | 107.8 |
| B | 4 | 232 | 195952 | 1811.76 | 572 | 559 | 107.8 |
| B | 5 | 200 | 51440 | 471.79 | 572 | 559 | 107.8 |
| C | 15 | 214 | 214670 | 1617.7 | 577 | 579 | 132.3 |
| C | 14 | 254 | 49838 | 372.21 | 577 | 579 | 132.3 |
| C | 0 | 10 | 21254 | 156.22 | 577 | 579 | 132.3 |
| D | 13 | 249 | 379362 | 2753.38 | 577 | 563 | 137.6 |
| D | 12 | 233 | 266611 | 1933.82 | 577 | 563 | 137.6 |
| D | 2 | 250 | 217981 | 1580.35 | 577 | 563 | 137.6 |
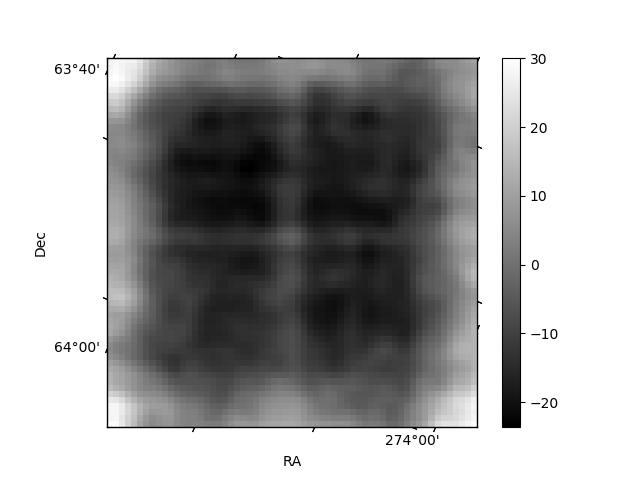
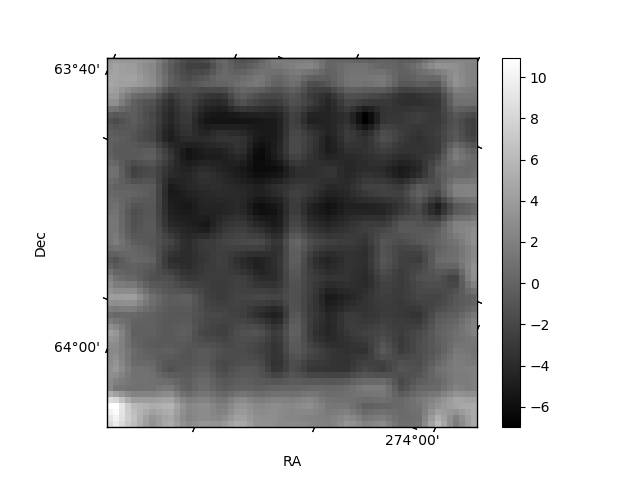
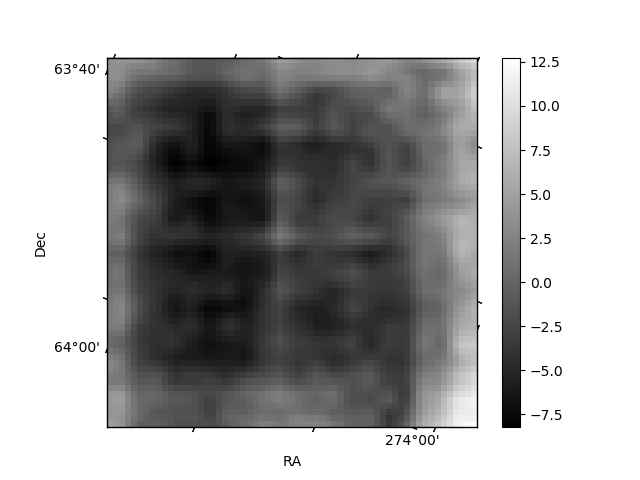
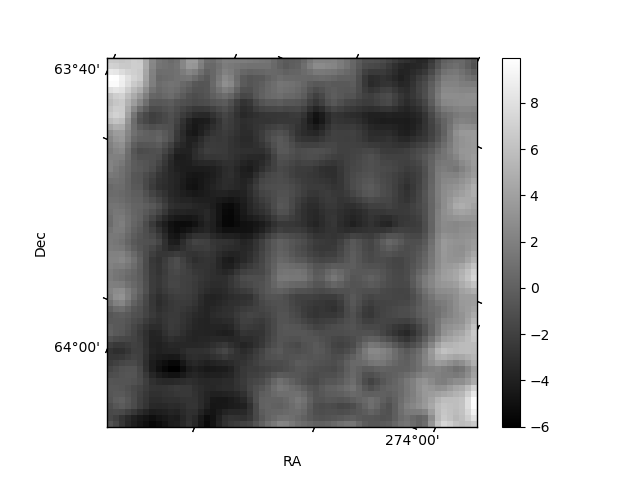
Histogram calculated using DETX and DETY for each event in the final _common_clean file
| Quadrant A | 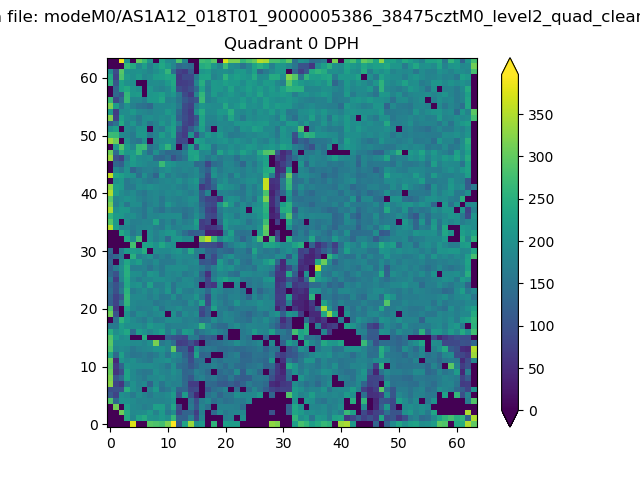 |
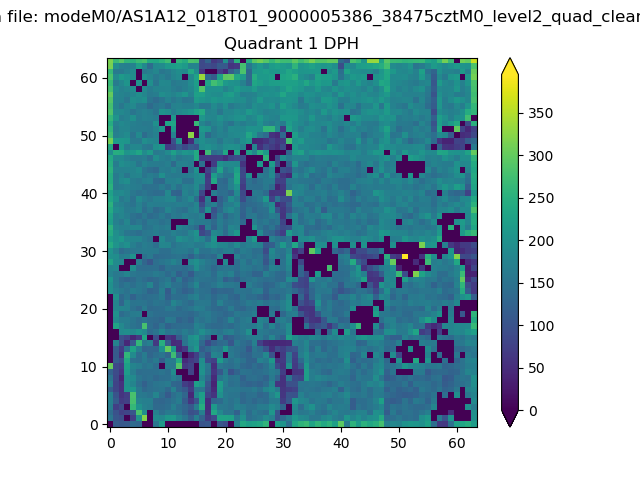 |
Quadrant B |
|---|---|---|---|
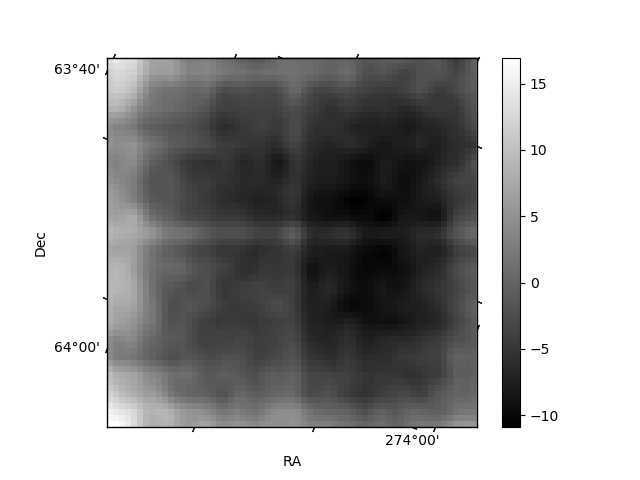
| Quadrant D | 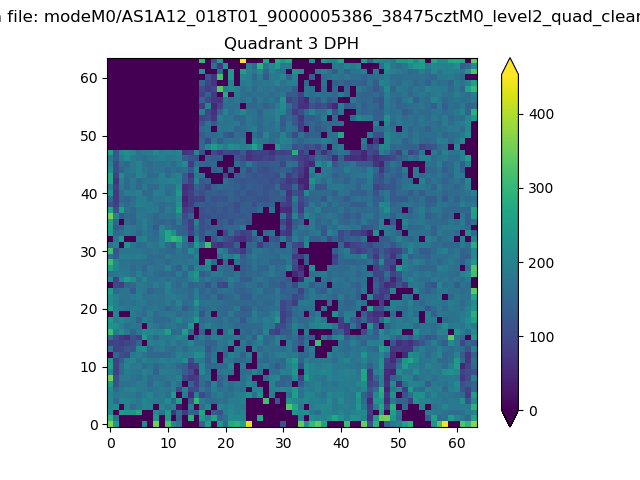 |
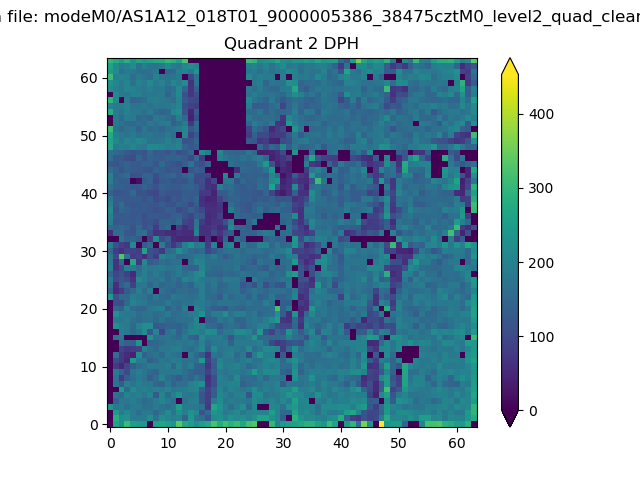 |
Quadrant C |
| Plot type | Count rate plots | Images |
|---|---|---|
| Comparison with Poisson distribution Blue bars denote a histogram of data divided into 1 sec bins. Red curve is a Poisson curve with rate = median count rate of data. |
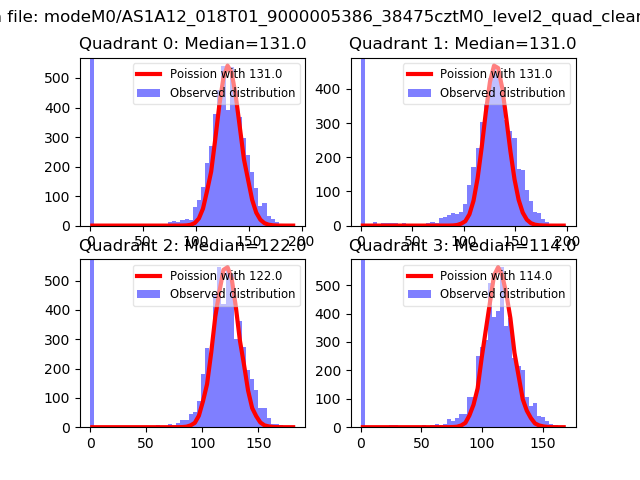 |
 |
| Quadrant-wise count rates Data is divided into 100 sec bins |
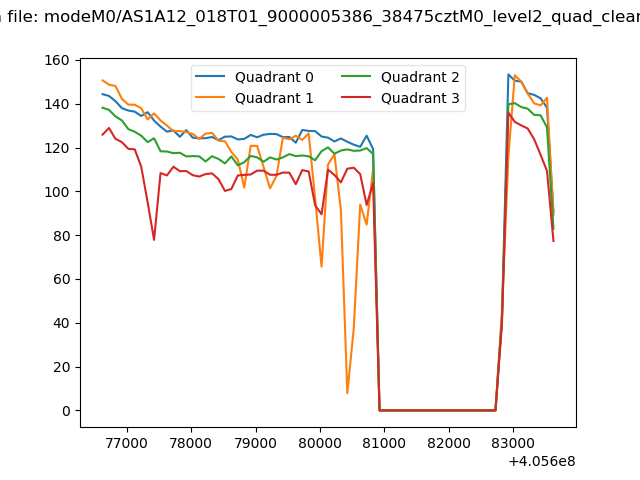 |
|
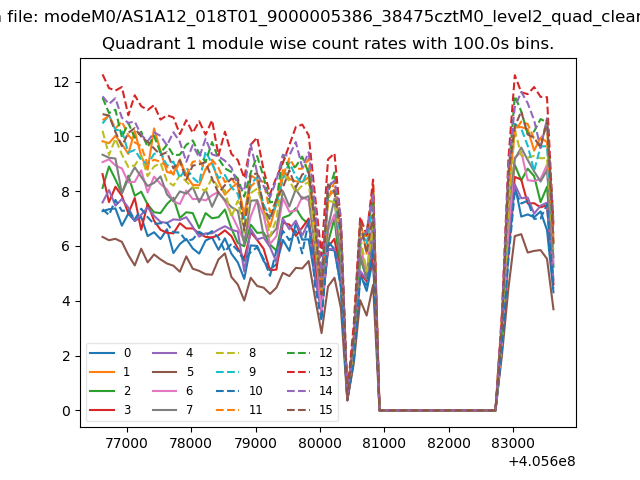
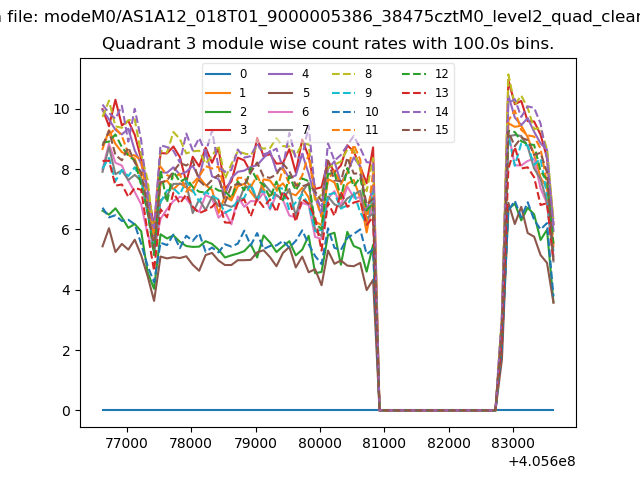
| Module-wise count rates for Quadrant A Data is divided into 100 sec bins |
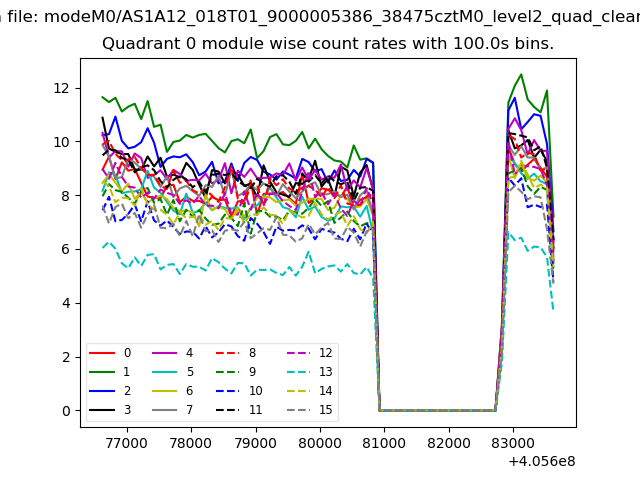 |
 |
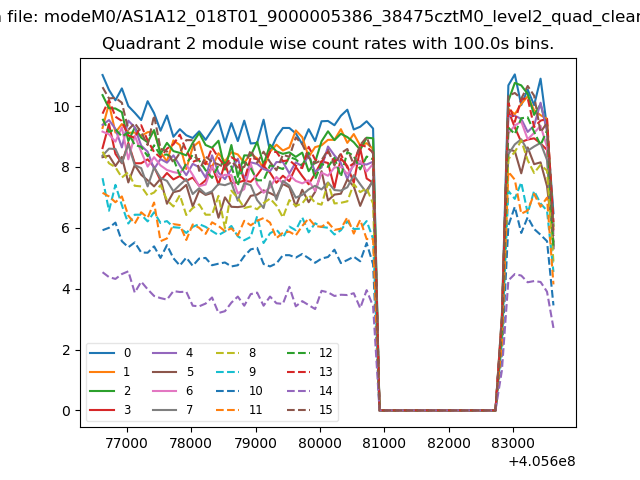
| Module-wise count rates for Quadrant B Data is divided into 100 sec bins |
 |
 |
| Module-wise count rates for Quadrant C Data is divided into 100 sec bins |
 |
 |
| Module-wise count rates for Quadrant D Data is divided into 100 sec bins |
 |
 |
| Parameter | Plot |
|---|---|
| CZT HV Monitor | 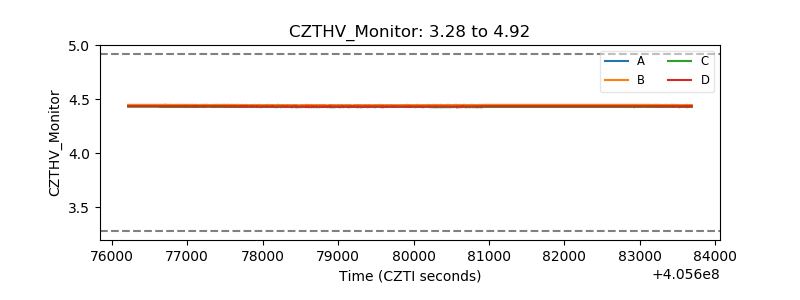 |
| D_VDD | 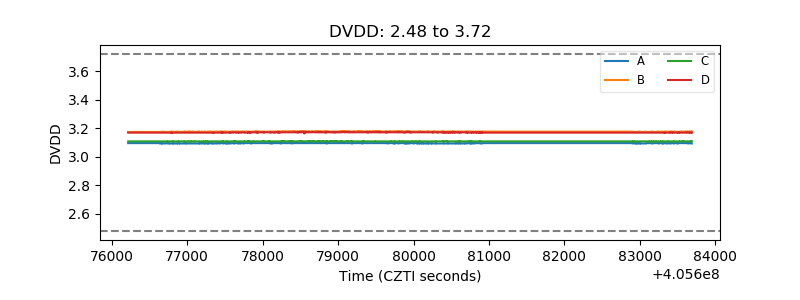 |
| Temperature 1 | 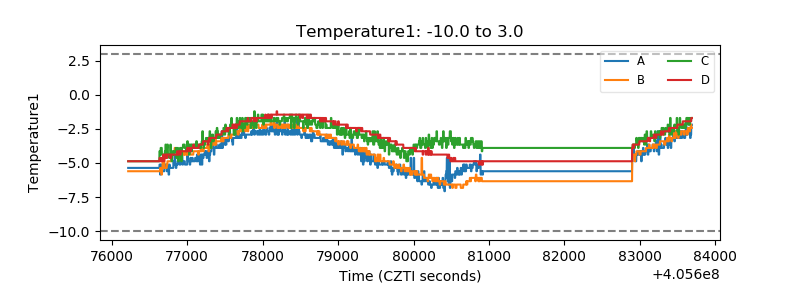 |
| Veto HV Monitor | 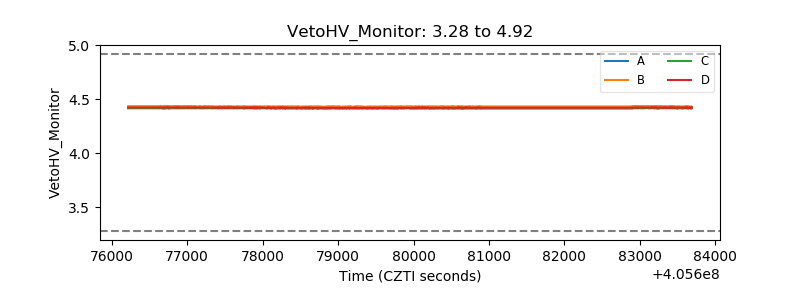 |
| Veto LLD | 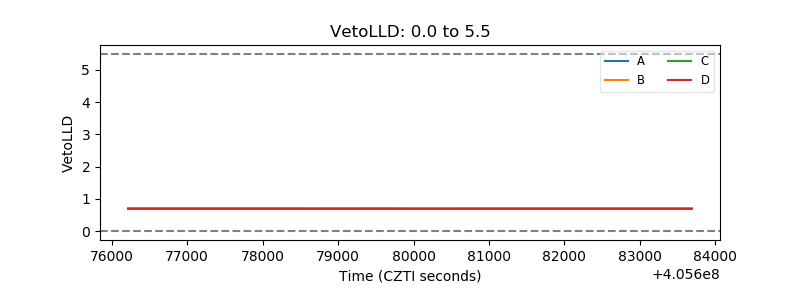 |
| Alpha Counter | 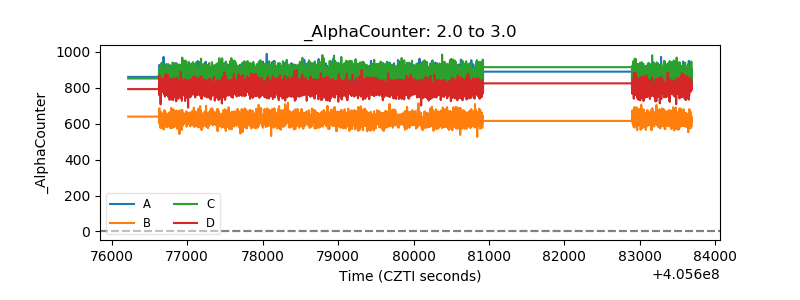 |
| _CPM_Rate | 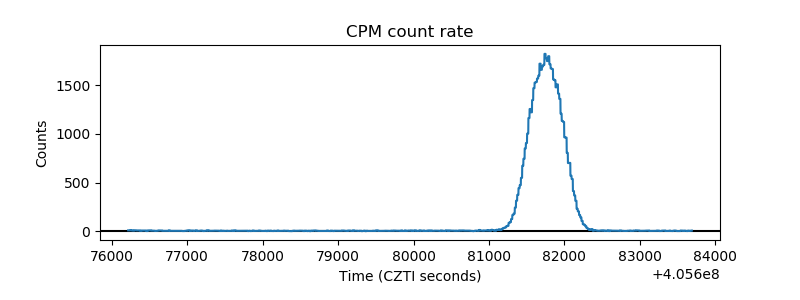 |
| CZT Counter | 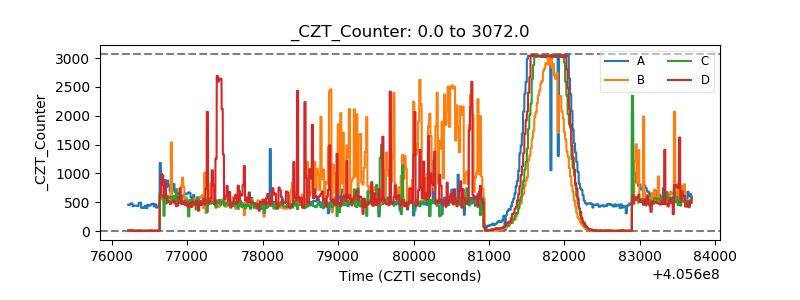 |
| +2.5 Volts monitor | 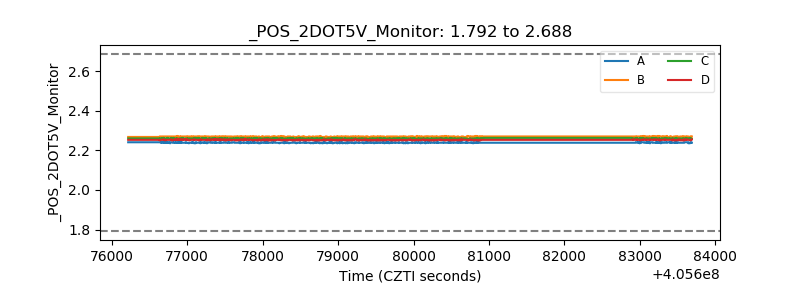 |
| +5 Volts monitor | 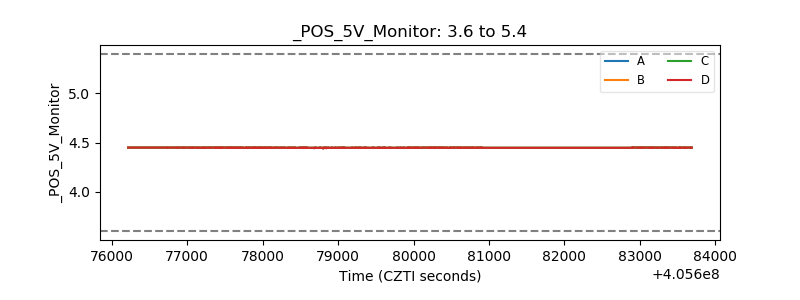 |
| _ROLL_ROT | 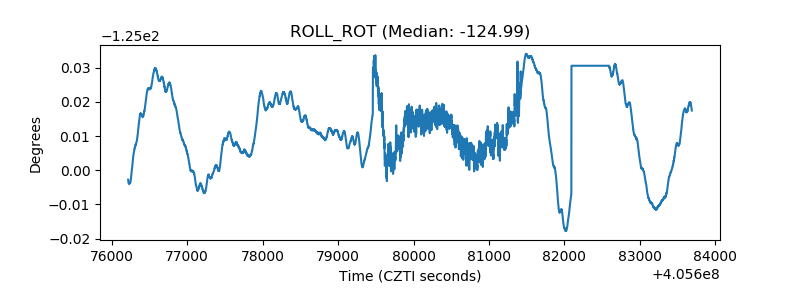 |
| _Roll_DEC | 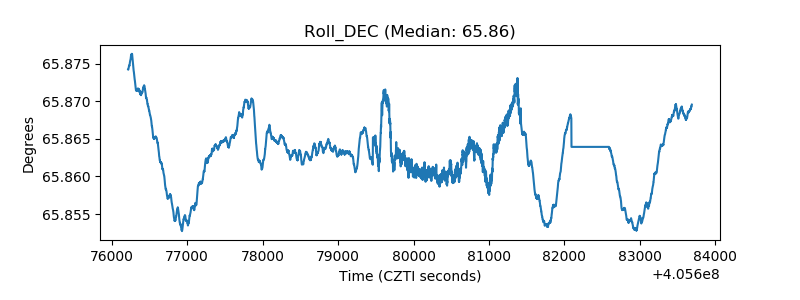 |
| _Roll_RA | 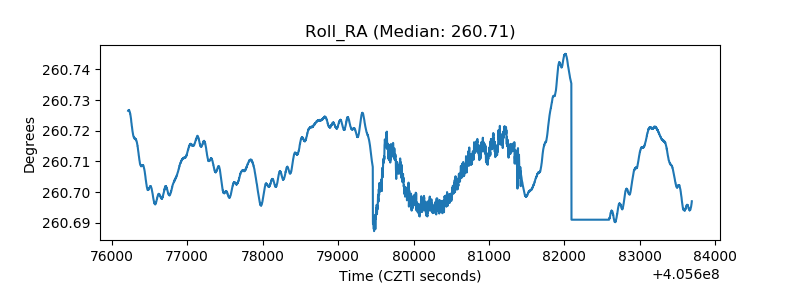 |
| Veto Counter | 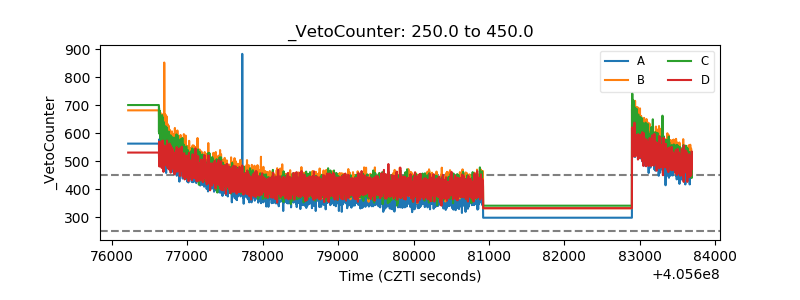 |