| Param | Original file | Final file |
|---|---|---|
| Filename | modeM0/AS1A12_018T01_9000005386_38476cztM0_level2.fits | modeM0/AS1A12_018T01_9000005386_38476cztM0_level2_quad_clean.evt |
| Size (bytes) | 399,735,360 | 91,056,960 |
| Size | 381.2 MB | 86.8 MB |
| Events in quadrant A | 2,789,171 | 661,681 |
| Events in quadrant B | 4,145,577 | 626,373 |
| Events in quadrant C | 2,514,942 | 616,529 |
| Events in quadrant D | 4,962,356 | 505,511 |
| Mode SS | |||
|---|---|---|---|
| Quadrant | BADHDUFLAG | Total packets | Discarded packets |
| A | 0 | 102 | 0 |
| B | 0 | 102 | 0 |
| C | 0 | 102 | 0 |
| D | 0 | 102 | 0 |
| Mode M9 | |||
|---|---|---|---|
| Quadrant | BADHDUFLAG | Total packets | Discarded packets |
| A | 0 | 23 | 0 |
| B | 0 | 23 | 0 |
| C | 0 | 23 | 0 |
| D | 0 | 24 | 0 |
| Mode M0 | |||
|---|---|---|---|
| Quadrant | BADHDUFLAG | Total packets | Discarded packets |
| A | 0 | 11156 | 3 |
| B | 0 | 15664 | 2 |
| C | 0 | 10263 | 2 |
| D | 0 | 17977 | 2 |
| Quadrant | Total seconds | Saturated seconds | Saturation percentage |
|---|---|---|---|
| A | 4948 | 15 | 0.303153% |
| B | 4948 | 400 | 8.084074% |
| C | 4948 | 9 | 0.181892% |
| D | 4948 | 762 | 15.400162% |
Noise dominated data is calculated using 1-second bins in cleaned event files. If a bin has >2000 counts, and if more than 50% of those come from <1% of pixels, then it is considered to be noise-dominated and hence unusable.
| Quadrant | # 1 sec bins | Bins with >0 counts | Bins with >2000 counts | High rate bins dominated by noise | Noise dominated (total time) | Noise dominated (detector-on time) | Marked lightcurve |
|---|---|---|---|---|---|---|---|
| A | 7041 | 4949 | 3 | 3 | 0.04% | 0.06% | 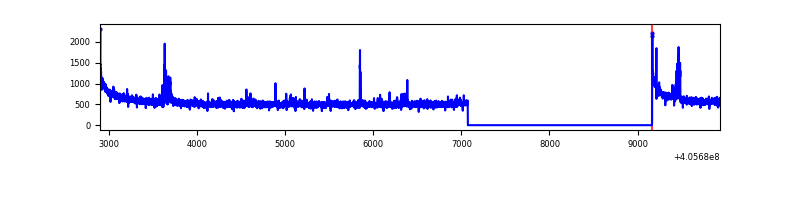 |
| B | 7041 | 4948 | 334 | 334 | 4.74% | 6.75% | 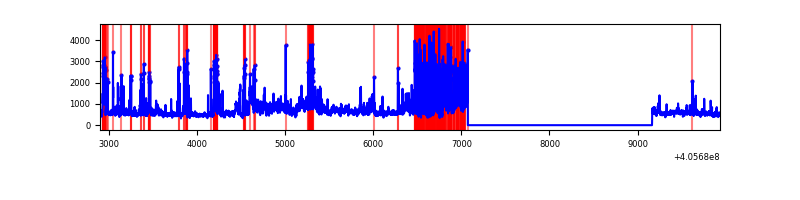 |
| C | 7041 | 4949 | 6 | 6 | 0.09% | 0.12% | 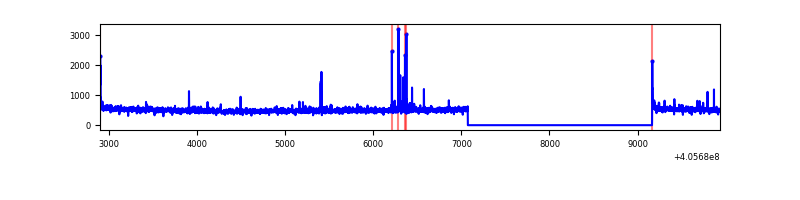 |
| D | 7041 | 4949 | 713 | 713 | 10.13% | 14.41% | 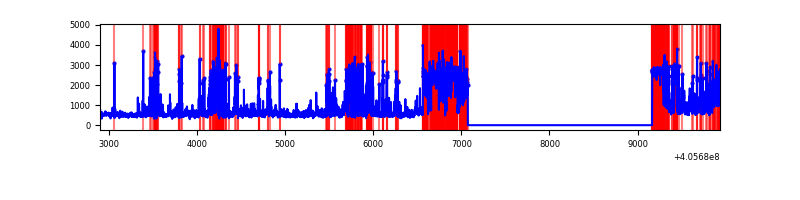 |
Top three noisy pixels from each quadrant. If the there are fewer than three noisy pixels in the level2.evt file, extra rows are filled as -1
| Pixel properties | Quadrant properties | ||||||
|---|---|---|---|---|---|---|---|
| Quadrant | DetID | PixID | Counts | Sigma | Mean | Median | Sigma |
| A | 10 | 83 | 384436 | 3217.86 | 598 | 586 | 119.3 |
| A | 13 | 248 | 50471 | 418.19 | 598 | 586 | 119.3 |
| A | 13 | 6 | 17543 | 142.15 | 598 | 586 | 119.3 |
| B | 8 | 3 | 1433809 | 13817.28 | 559 | 546 | 103.7 |
| B | 4 | 232 | 196412 | 1888.23 | 559 | 546 | 103.7 |
| B | 0 | 183 | 101271 | 971.03 | 559 | 546 | 103.7 |
| C | 15 | 214 | 208004 | 1592.09 | 570 | 574 | 130.3 |
| C | 14 | 254 | 41833 | 316.68 | 570 | 574 | 130.3 |
| C | 0 | 10 | 23132 | 173.14 | 570 | 574 | 130.3 |
| D | 2 | 16 | 1592679 | 12152.82 | 542 | 528 | 131.0 |
| D | 13 | 249 | 573873 | 4376.32 | 542 | 528 | 131.0 |
| D | 12 | 233 | 192245 | 1463.37 | 542 | 528 | 131.0 |
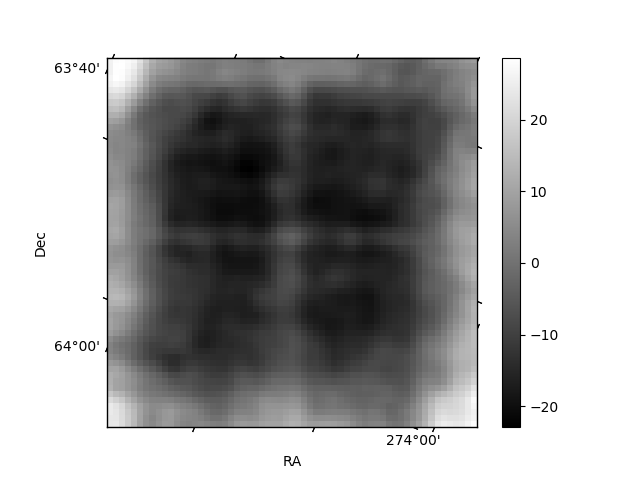
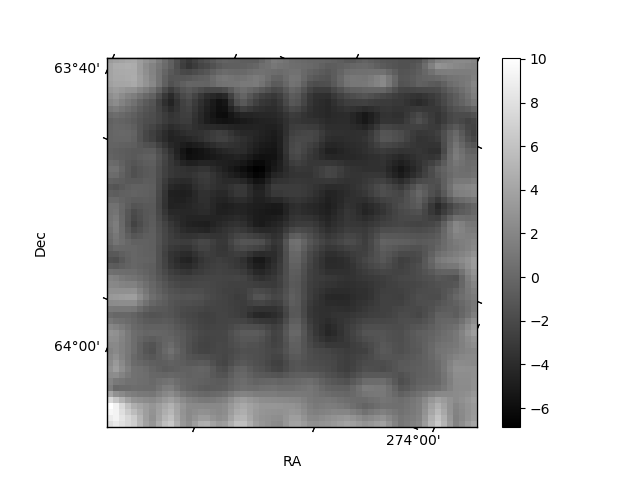
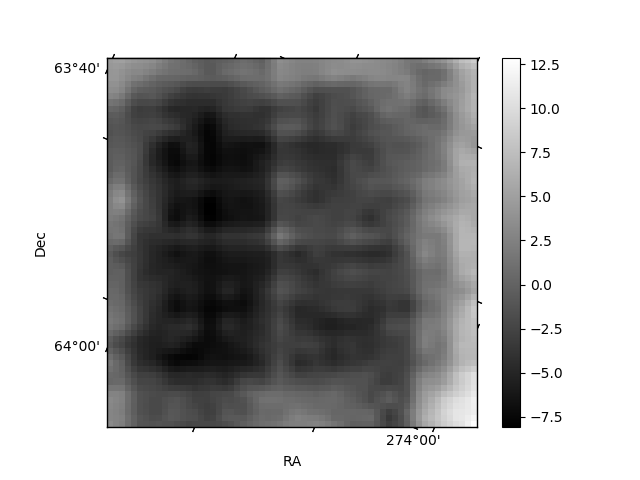
Histogram calculated using DETX and DETY for each event in the final _common_clean file
| Quadrant A | 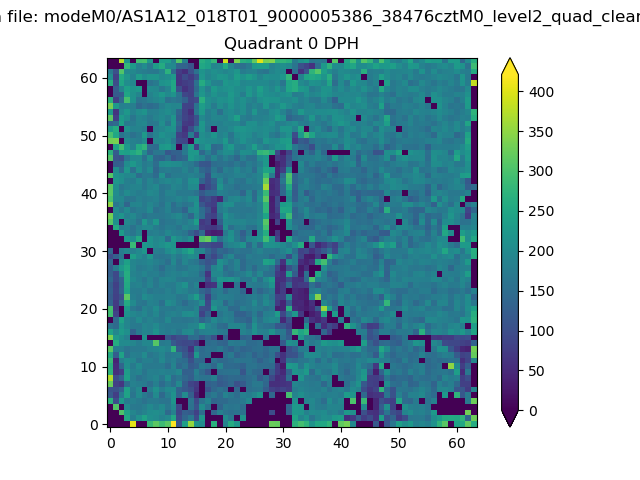 |
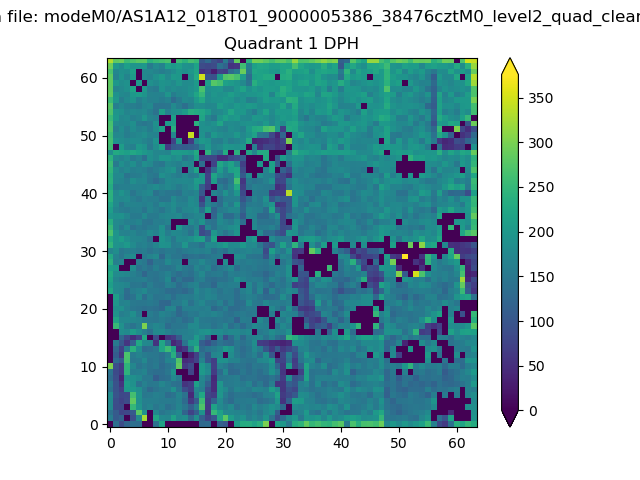 |
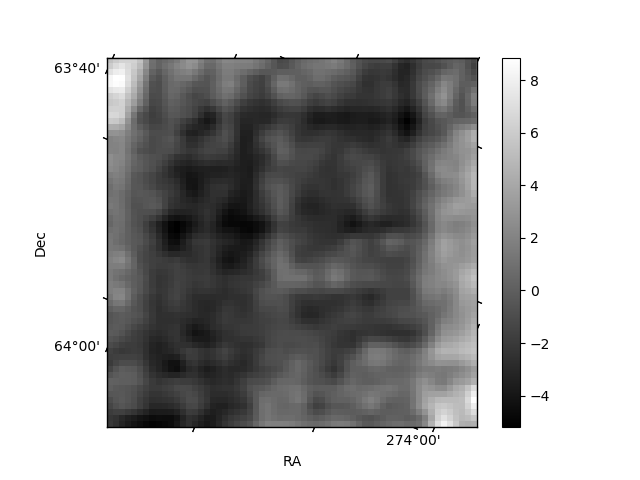
Quadrant B |
|---|---|---|---|
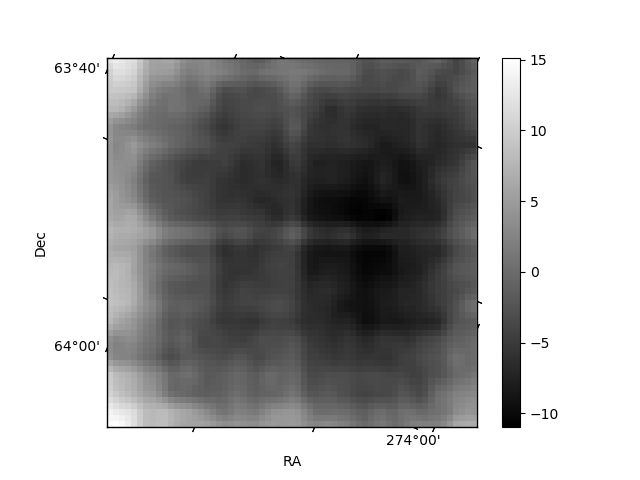
| Quadrant D | 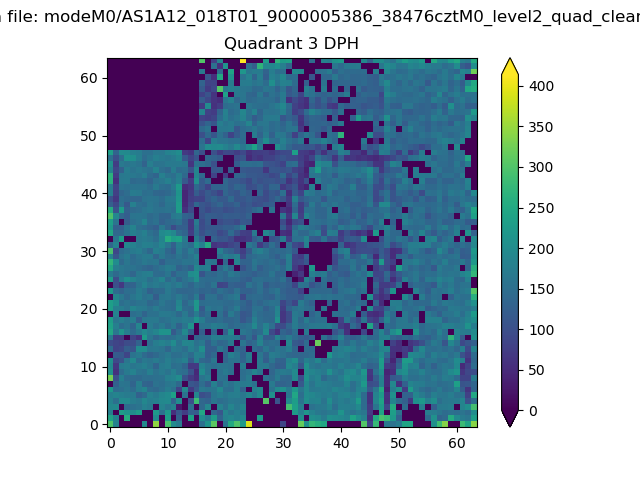 |
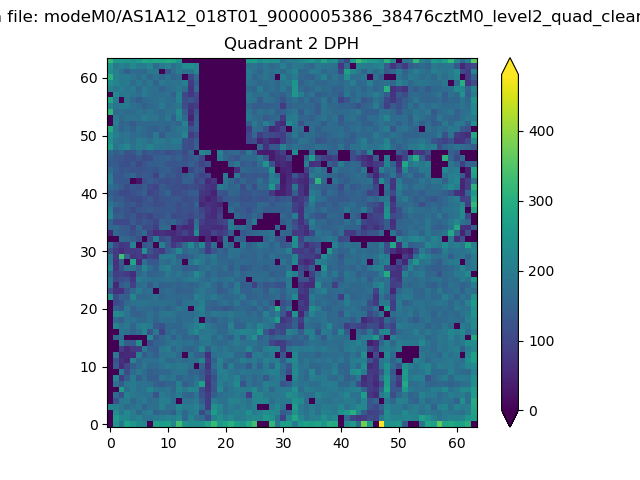 |
Quadrant C |
| Plot type | Count rate plots | Images |
|---|---|---|
| Comparison with Poisson distribution Blue bars denote a histogram of data divided into 1 sec bins. Red curve is a Poisson curve with rate = median count rate of data. |
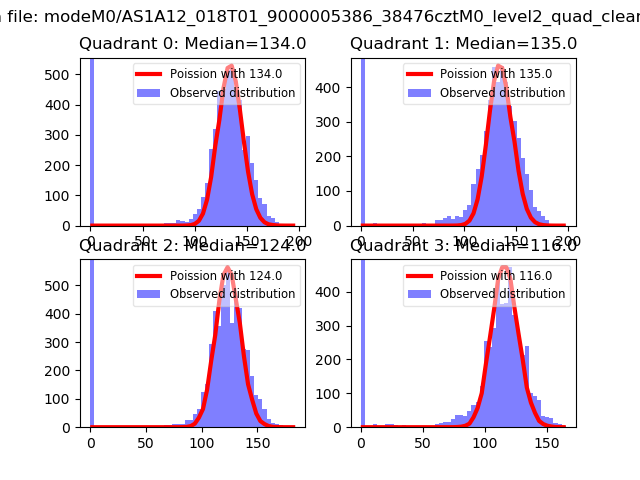 |
 |
| Quadrant-wise count rates Data is divided into 100 sec bins |
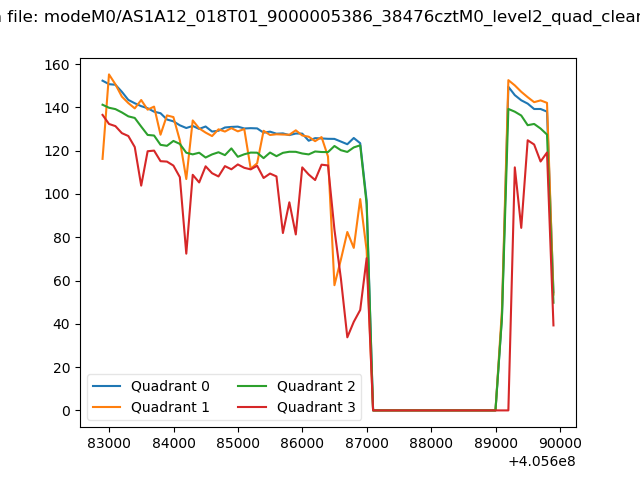 |
|
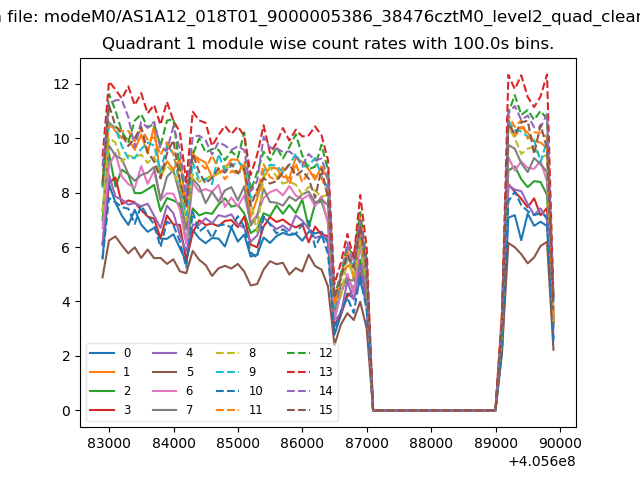
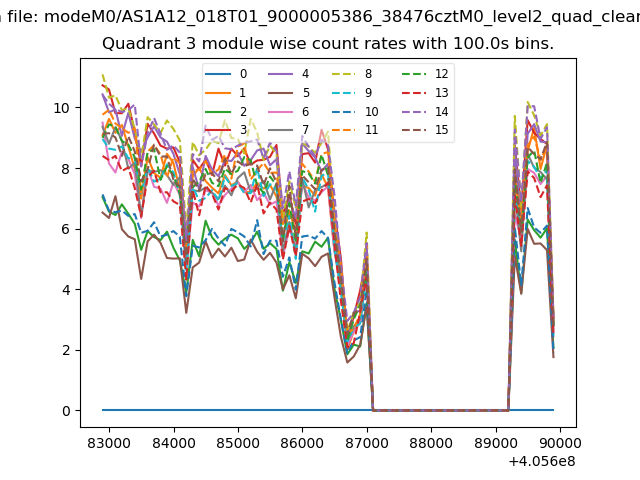
| Module-wise count rates for Quadrant A Data is divided into 100 sec bins |
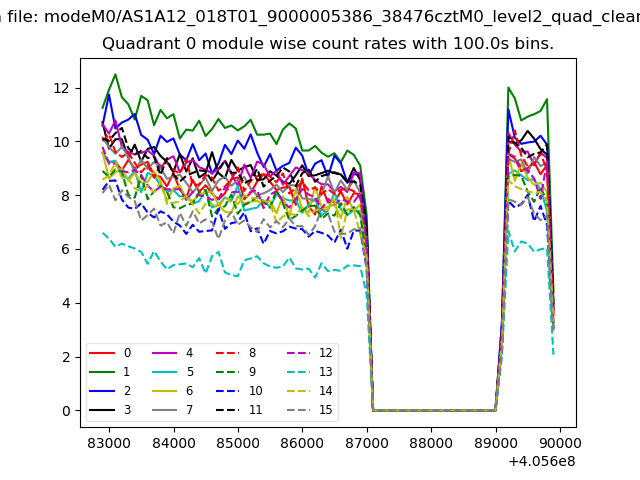 |
 |
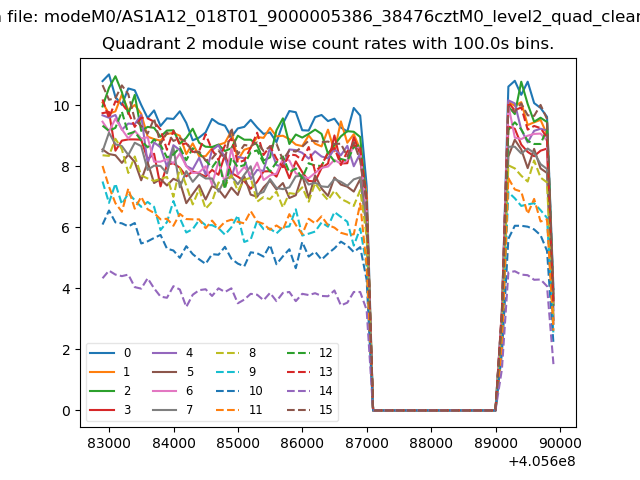
| Module-wise count rates for Quadrant B Data is divided into 100 sec bins |
 |
 |
| Module-wise count rates for Quadrant C Data is divided into 100 sec bins |
 |
 |
| Module-wise count rates for Quadrant D Data is divided into 100 sec bins |
 |
 |
| Parameter | Plot |
|---|---|
| CZT HV Monitor | 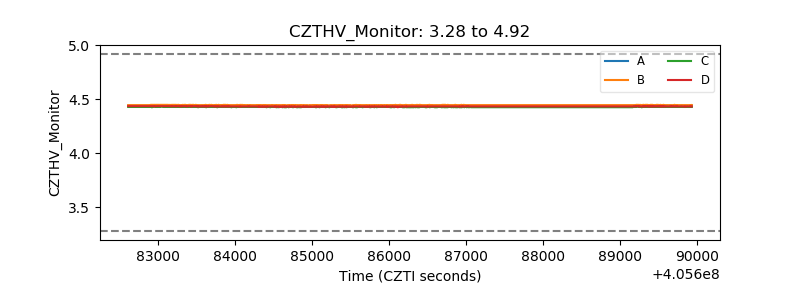 |
| D_VDD | 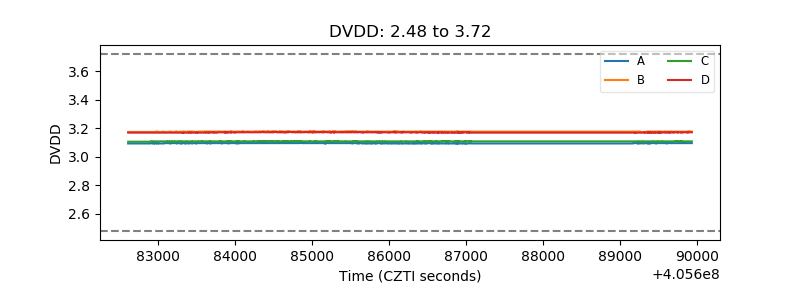 |
| Temperature 1 | 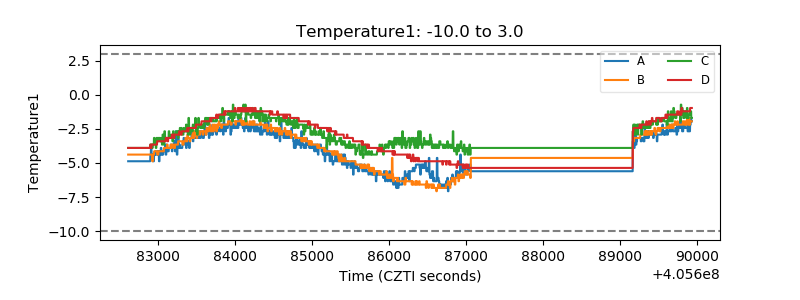 |
| Veto HV Monitor | 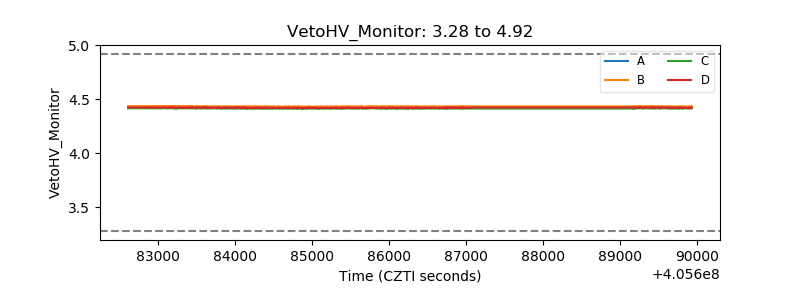 |
| Veto LLD | 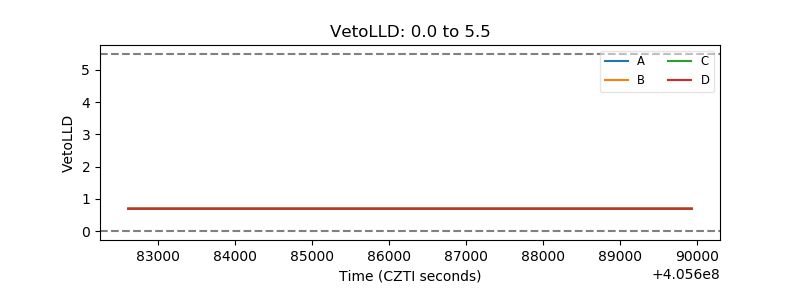 |
| Alpha Counter | 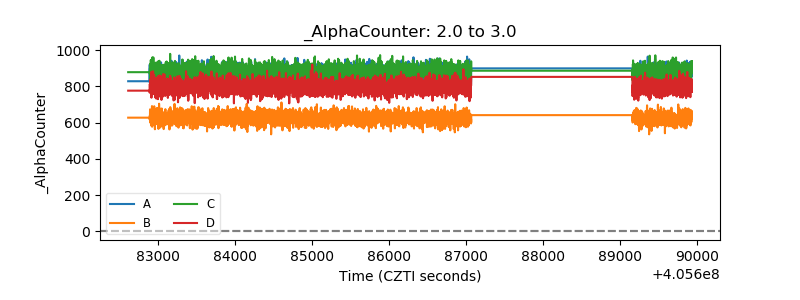 |
| _CPM_Rate | 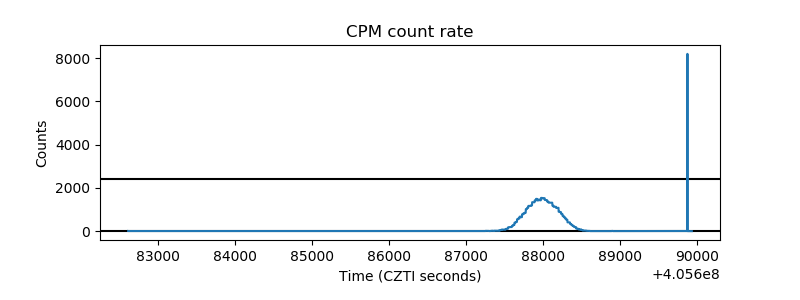 |
| CZT Counter | 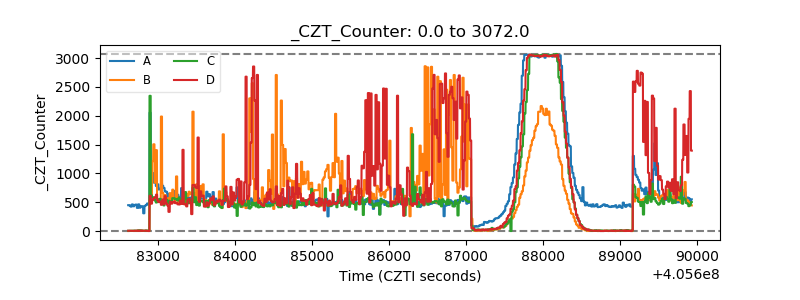 |
| +2.5 Volts monitor | 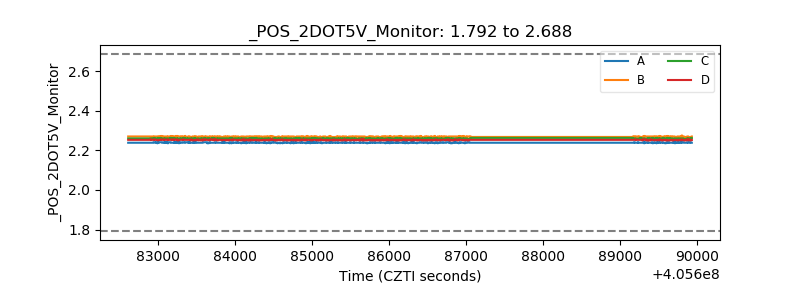 |
| +5 Volts monitor | 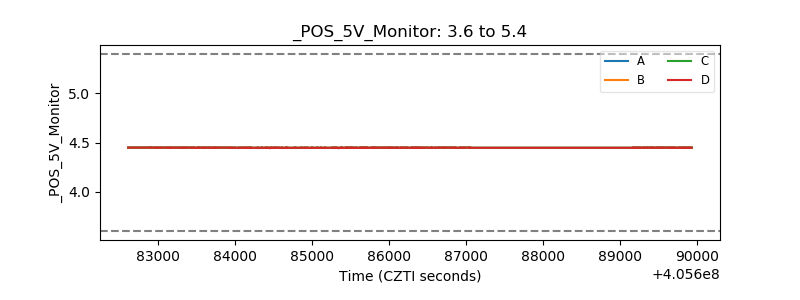 |
| _ROLL_ROT | 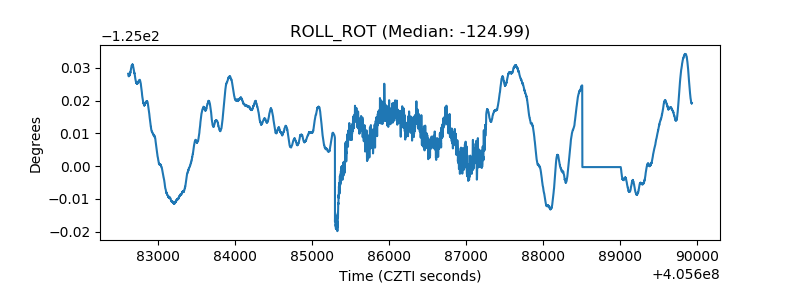 |
| _Roll_DEC | 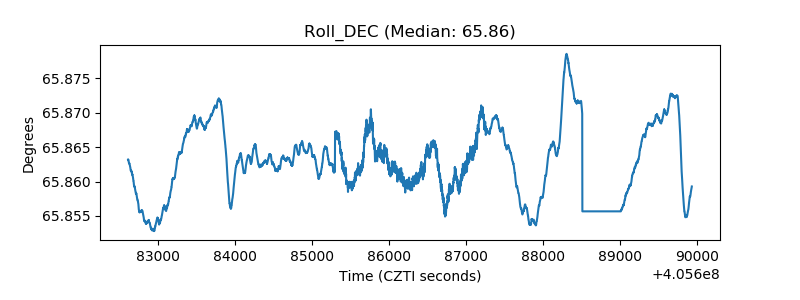 |
| _Roll_RA | 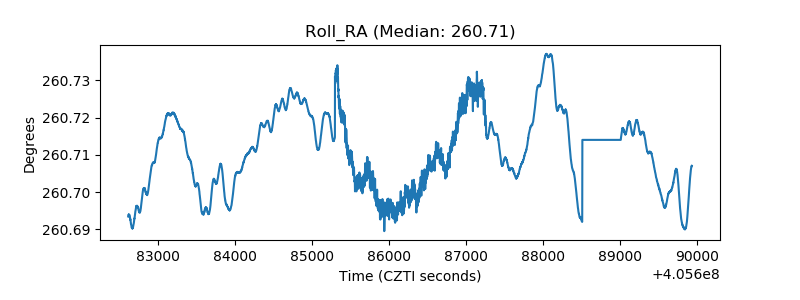 |
| Veto Counter | 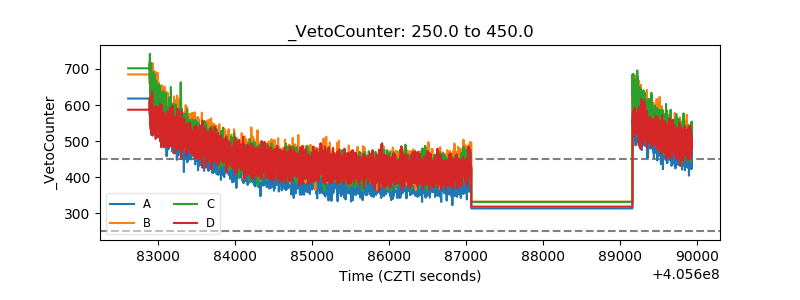 |