| Param | Original file | Final file |
|---|---|---|
| Filename | modeM0/AS1A12_018T01_9000005386_38477cztM0_level2.fits | modeM0/AS1A12_018T01_9000005386_38477cztM0_level2_quad_clean.evt |
| Size (bytes) | 403,902,720 | 87,618,240 |
| Size | 385.2 MB | 83.6 MB |
| Events in quadrant A | 2,709,283 | 638,317 |
| Events in quadrant B | 2,969,116 | 629,260 |
| Events in quadrant C | 2,442,979 | 601,870 |
| Events in quadrant D | 6,449,247 | 441,121 |
| Mode SS | |||
|---|---|---|---|
| Quadrant | BADHDUFLAG | Total packets | Discarded packets |
| A | 0 | 98 | 0 |
| B | 0 | 98 | 0 |
| C | 0 | 98 | 0 |
| D | 0 | 98 | 0 |
| Mode M9 | |||
|---|---|---|---|
| Quadrant | BADHDUFLAG | Total packets | Discarded packets |
| A | 0 | 23 | 0 |
| B | 0 | 23 | 0 |
| C | 0 | 23 | 0 |
| D | 0 | 24 | 0 |
| Mode M0 | |||
|---|---|---|---|
| Quadrant | BADHDUFLAG | Total packets | Discarded packets |
| A | 0 | 10872 | 3 |
| B | 0 | 11799 | 2 |
| C | 0 | 10026 | 2 |
| D | 0 | 22545 | 2 |
| Quadrant | Total seconds | Saturated seconds | Saturation percentage |
|---|---|---|---|
| A | 4890 | 12 | 0.245399% |
| B | 4890 | 153 | 3.128834% |
| C | 4890 | 7 | 0.143149% |
| D | 4890 | 1248 | 25.521472% |
Noise dominated data is calculated using 1-second bins in cleaned event files. If a bin has >2000 counts, and if more than 50% of those come from <1% of pixels, then it is considered to be noise-dominated and hence unusable.
| Quadrant | # 1 sec bins | Bins with >0 counts | Bins with >2000 counts | High rate bins dominated by noise | Noise dominated (total time) | Noise dominated (detector-on time) | Marked lightcurve |
|---|---|---|---|---|---|---|---|
| A | 7044 | 4891 | 5 | 5 | 0.07% | 0.10% | 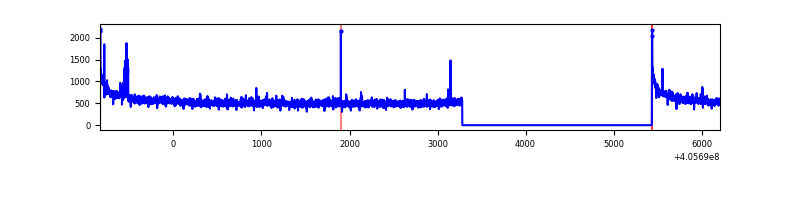 |
| B | 7044 | 4891 | 116 | 116 | 1.65% | 2.37% | 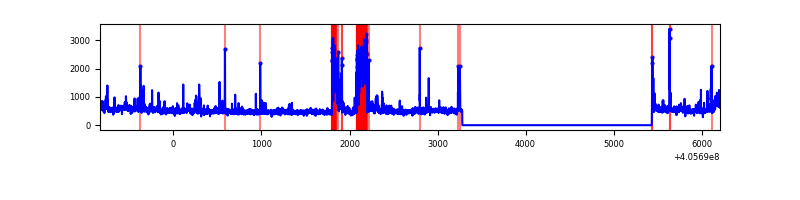 |
| C | 7044 | 4891 | 4 | 4 | 0.06% | 0.08% | 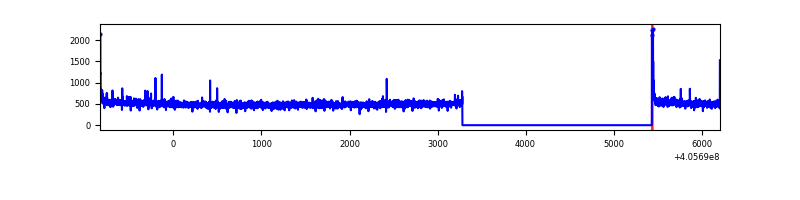 |
| D | 7044 | 4891 | 1227 | 1227 | 17.42% | 25.09% | 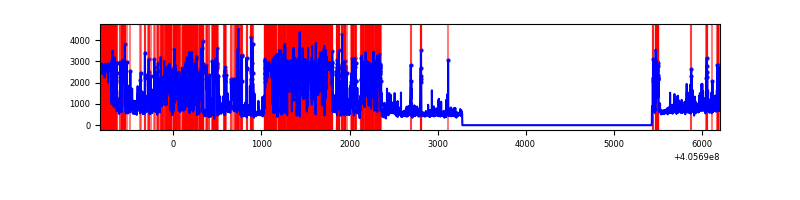 |
Top three noisy pixels from each quadrant. If the there are fewer than three noisy pixels in the level2.evt file, extra rows are filled as -1
| Pixel properties | Quadrant properties | ||||||
|---|---|---|---|---|---|---|---|
| Quadrant | DetID | PixID | Counts | Sigma | Mean | Median | Sigma |
| A | 10 | 83 | 390898 | 3375.35 | 582 | 571 | 115.6 |
| A | 13 | 248 | 22441 | 189.12 | 582 | 571 | 115.6 |
| A | 13 | 6 | 17605 | 147.3 | 582 | 571 | 115.6 |
| B | 5 | 184 | 482085 | 4548.72 | 567 | 554 | 105.9 |
| B | 8 | 3 | 130653 | 1228.96 | 567 | 554 | 105.9 |
| B | 0 | 155 | 32895 | 305.5 | 567 | 554 | 105.9 |
| C | 15 | 214 | 203783 | 1583.68 | 560 | 564 | 128.3 |
| C | 0 | 10 | 26499 | 202.11 | 560 | 564 | 128.3 |
| C | 14 | 254 | 13624 | 101.78 | 560 | 564 | 128.3 |
| D | 2 | 16 | 2049625 | 16760.0 | 503 | 490 | 122.3 |
| D | 12 | 227 | 1531271 | 12520.35 | 503 | 490 | 122.3 |
| D | 2 | 250 | 443014 | 3619.43 | 503 | 490 | 122.3 |
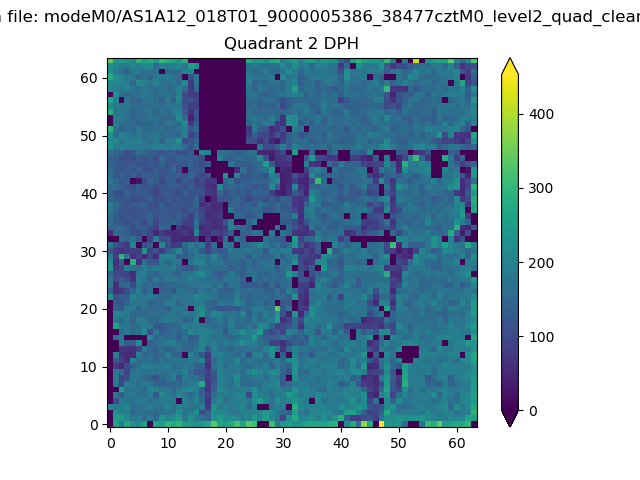
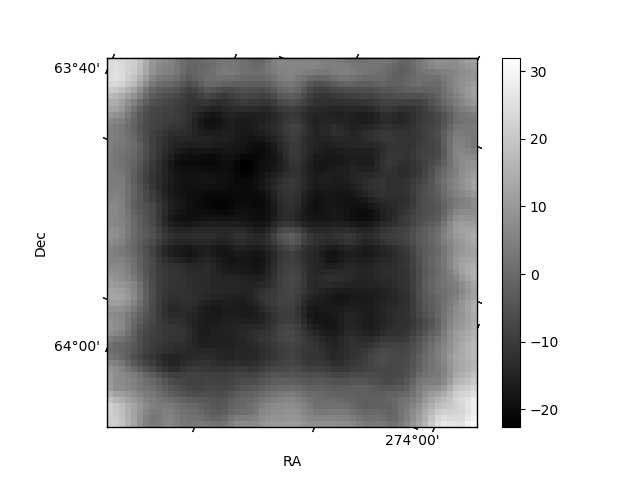
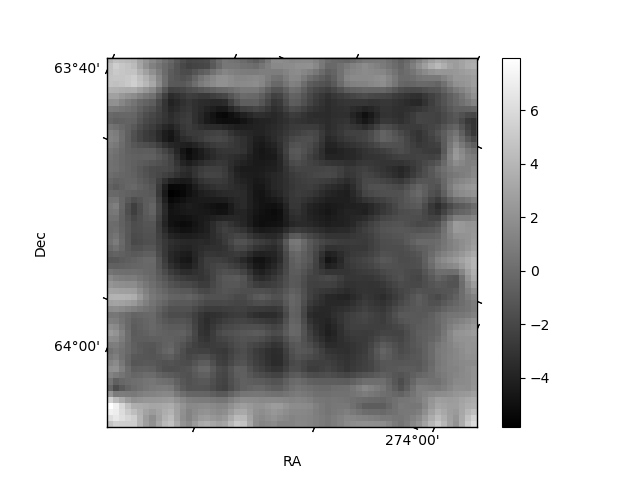
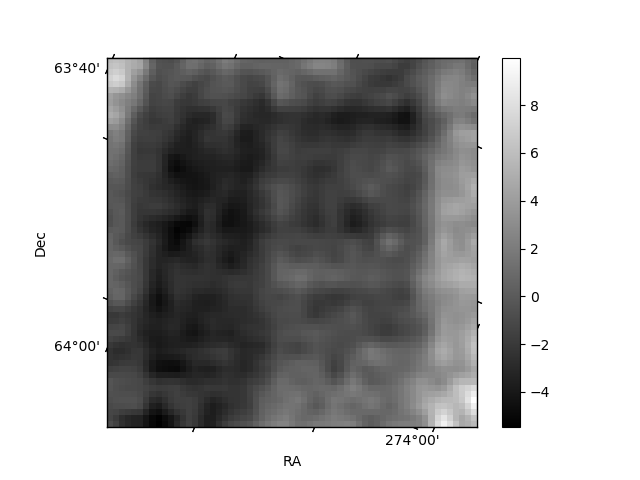
Histogram calculated using DETX and DETY for each event in the final _common_clean file
| Quadrant A | 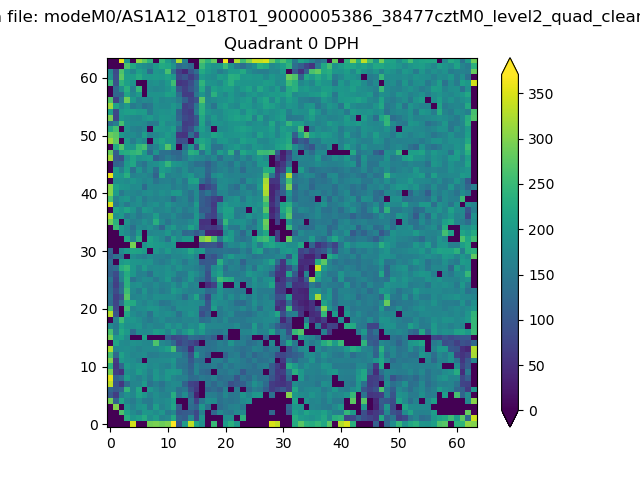 |
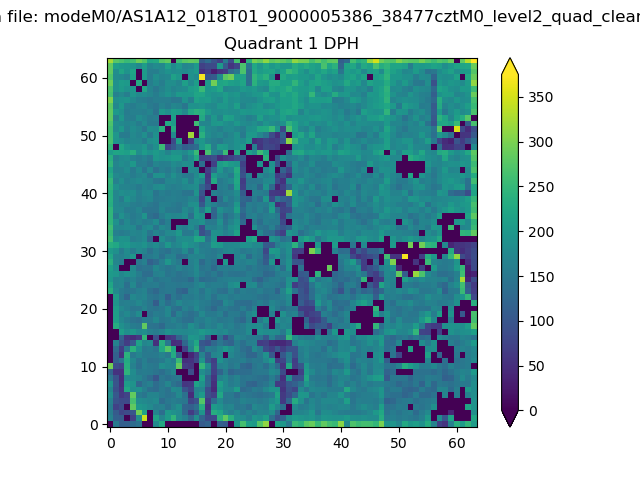 |
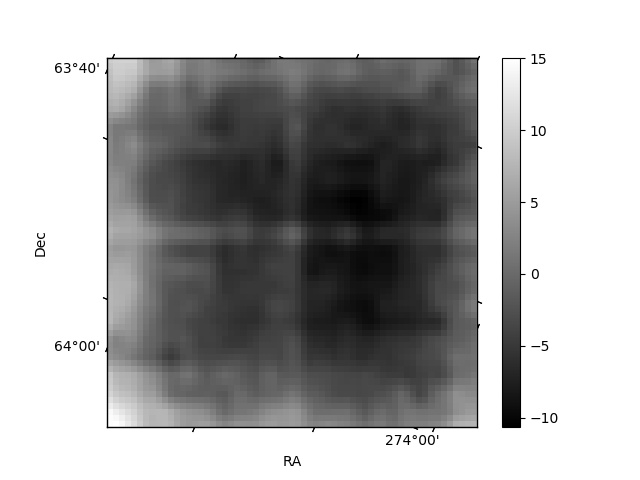
Quadrant B |
|---|---|---|---|
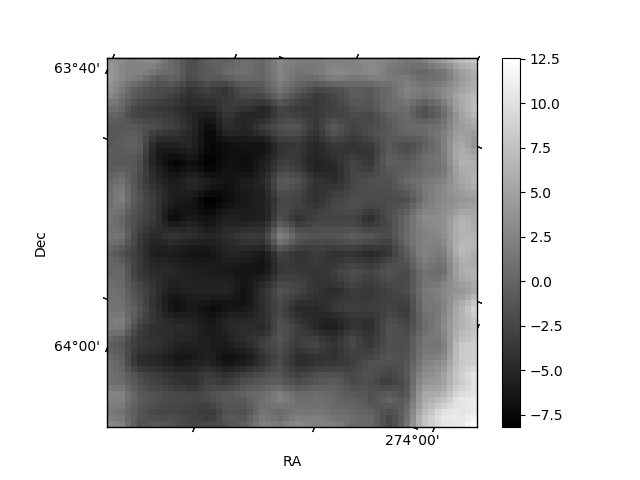
| Quadrant D | 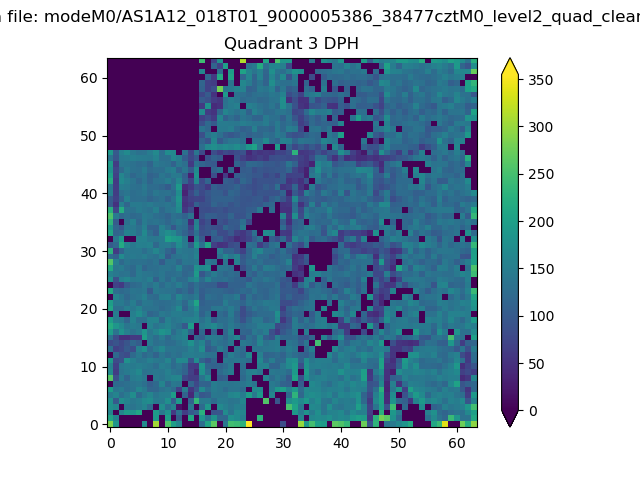 |
 |
Quadrant C |
| Plot type | Count rate plots | Images |
|---|---|---|
| Comparison with Poisson distribution Blue bars denote a histogram of data divided into 1 sec bins. Red curve is a Poisson curve with rate = median count rate of data. |
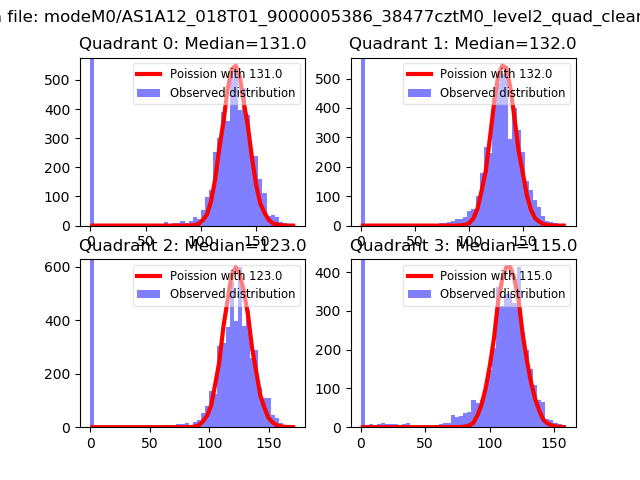 |
 |
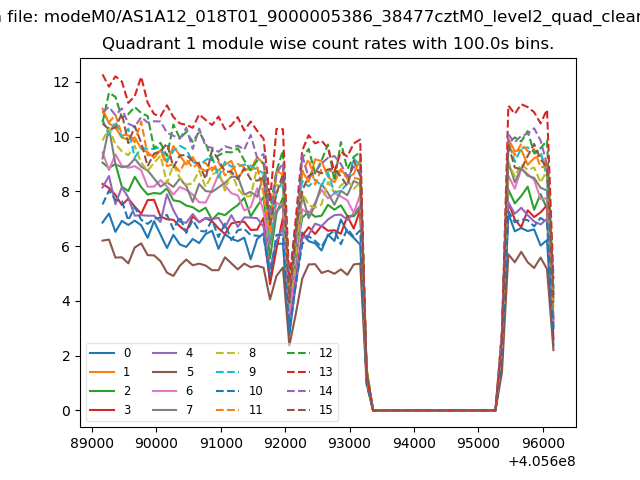
| Quadrant-wise count rates Data is divided into 100 sec bins |
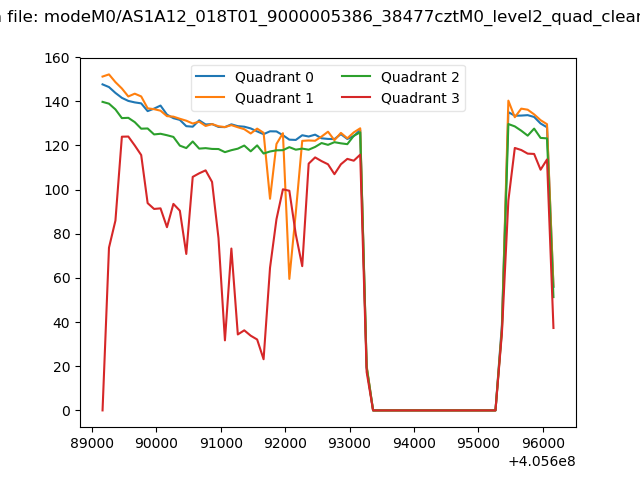 |
|
| Module-wise count rates for Quadrant A Data is divided into 100 sec bins |
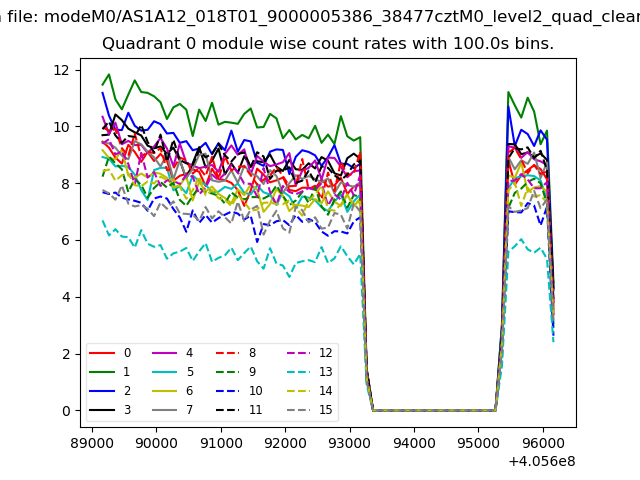 |
 |
| Module-wise count rates for Quadrant B Data is divided into 100 sec bins |
 |
 |
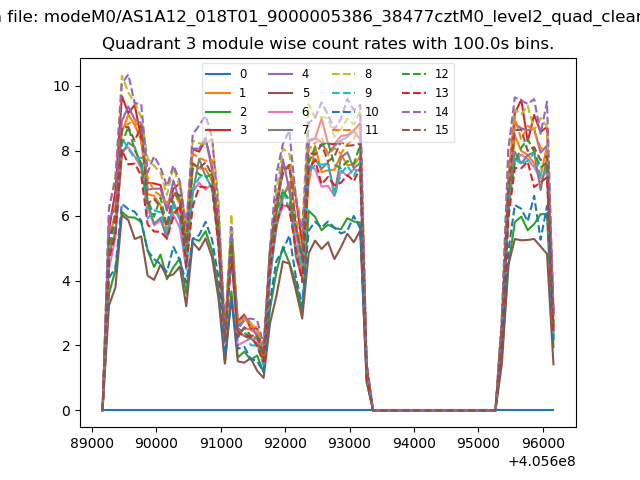
| Module-wise count rates for Quadrant C Data is divided into 100 sec bins |
 |
 |
| Module-wise count rates for Quadrant D Data is divided into 100 sec bins |
 |
 |
| Parameter | Plot |
|---|---|
| CZT HV Monitor | 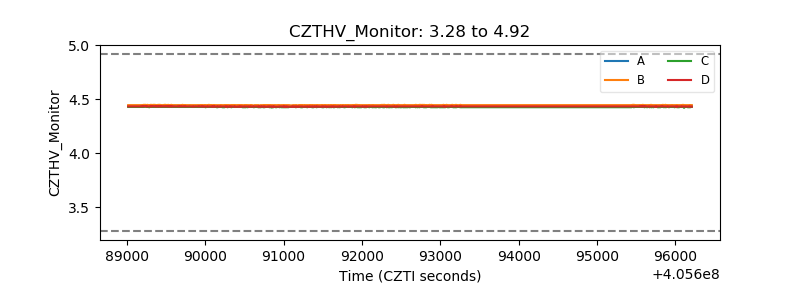 |
| D_VDD | 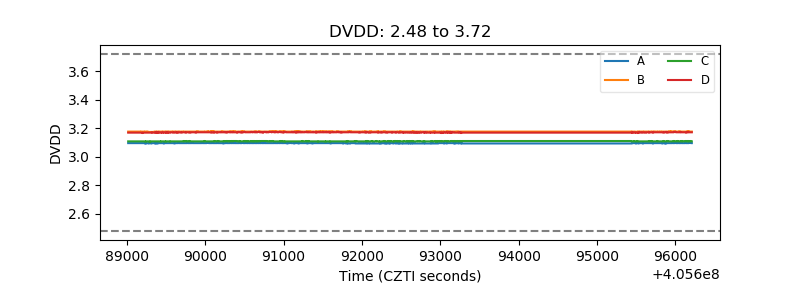 |
| Temperature 1 | 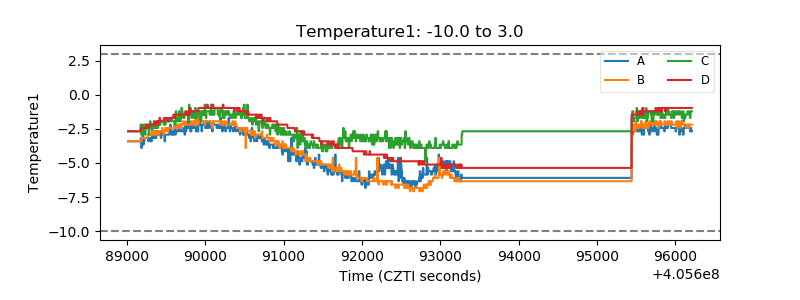 |
| Veto HV Monitor | 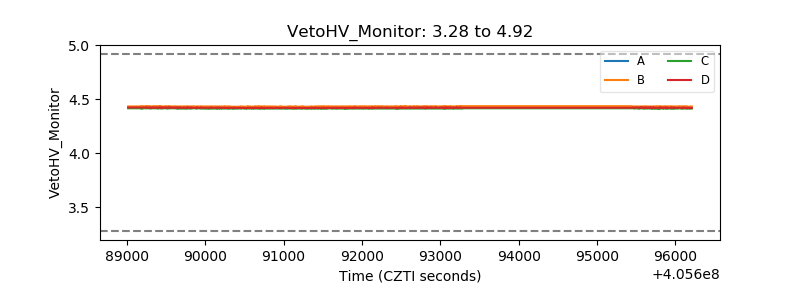 |
| Veto LLD | 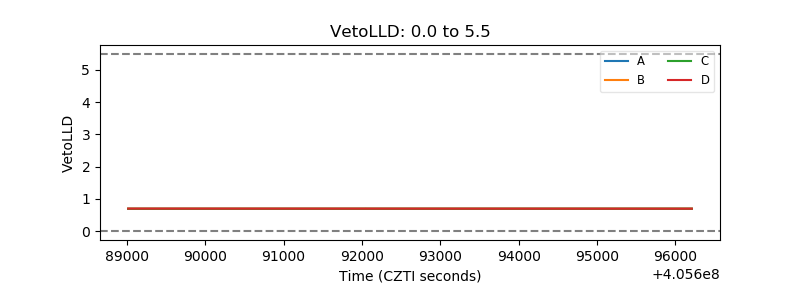 |
| Alpha Counter | 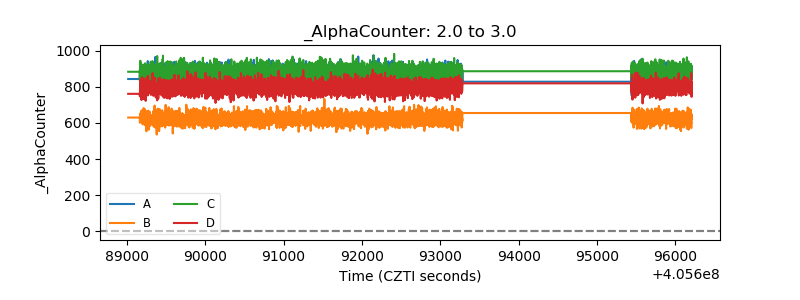 |
| _CPM_Rate | 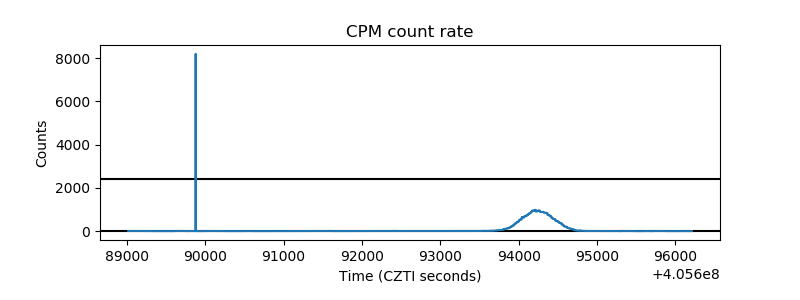 |
| CZT Counter | 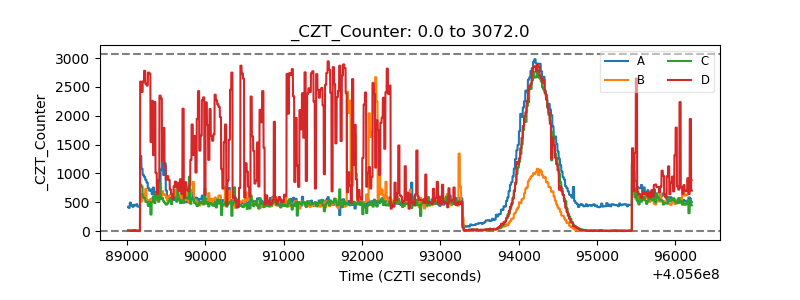 |
| +2.5 Volts monitor | 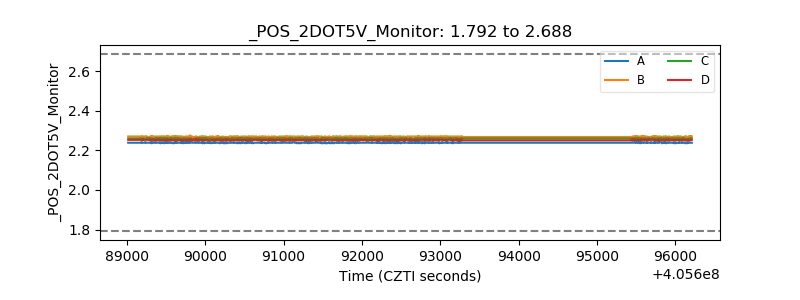 |
| +5 Volts monitor | 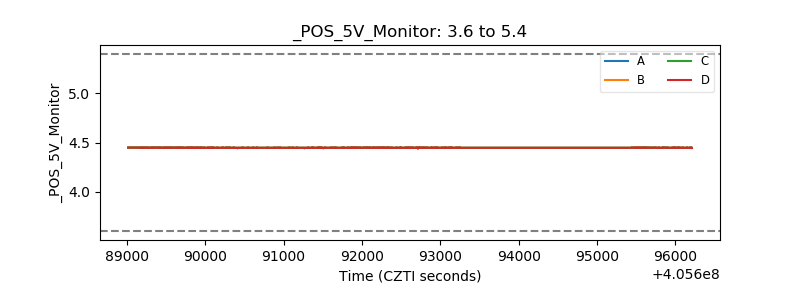 |
| _ROLL_ROT | 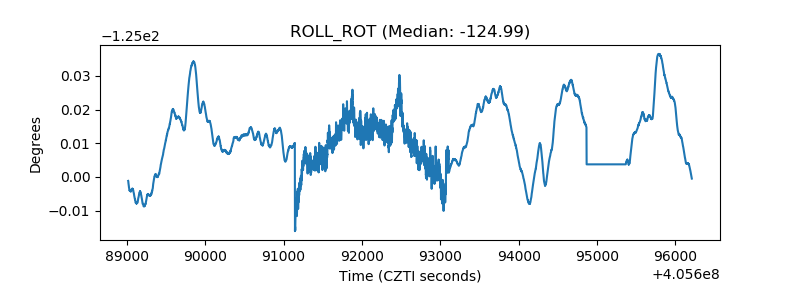 |
| _Roll_DEC | 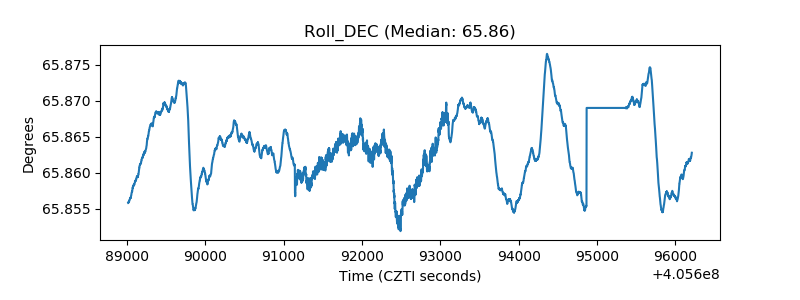 |
| _Roll_RA | 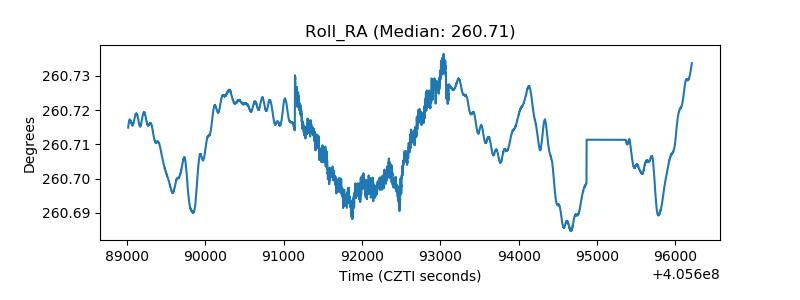 |
| Veto Counter | 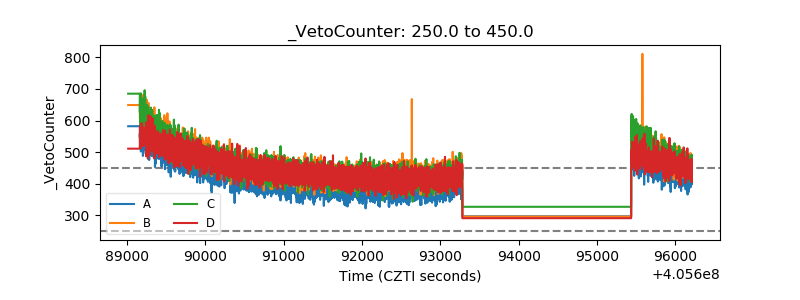 |