| Param | Original file | Final file |
|---|---|---|
| Filename | modeM0/AS1A12_018T01_9000005386_38478cztM0_level2.fits | modeM0/AS1A12_018T01_9000005386_38478cztM0_level2_quad_clean.evt |
| Size (bytes) | 363,358,080 | 93,032,640 |
| Size | 346.5 MB | 88.7 MB |
| Events in quadrant A | 2,830,938 | 643,419 |
| Events in quadrant B | 3,300,498 | 636,004 |
| Events in quadrant C | 2,561,889 | 613,487 |
| Events in quadrant D | 4,351,038 | 558,870 |
| Mode SS | |||
|---|---|---|---|
| Quadrant | BADHDUFLAG | Total packets | Discarded packets |
| A | 0 | 106 | 0 |
| B | 0 | 106 | 0 |
| C | 0 | 106 | 0 |
| D | 0 | 106 | 0 |
| Mode M9 | |||
|---|---|---|---|
| Quadrant | BADHDUFLAG | Total packets | Discarded packets |
| A | 0 | 21 | 0 |
| B | 0 | 21 | 0 |
| C | 0 | 21 | 0 |
| D | 0 | 22 | 0 |
| Mode M0 | |||
|---|---|---|---|
| Quadrant | BADHDUFLAG | Total packets | Discarded packets |
| A | 0 | 11506 | 3 |
| B | 0 | 13021 | 2 |
| C | 0 | 10690 | 2 |
| D | 0 | 16623 | 2 |
| Quadrant | Total seconds | Saturated seconds | Saturation percentage |
|---|---|---|---|
| A | 5217 | 18 | 0.345026% |
| B | 5217 | 155 | 2.971056% |
| C | 5217 | 11 | 0.210849% |
| D | 5217 | 208 | 3.986966% |
Noise dominated data is calculated using 1-second bins in cleaned event files. If a bin has >2000 counts, and if more than 50% of those come from <1% of pixels, then it is considered to be noise-dominated and hence unusable.
| Quadrant | # 1 sec bins | Bins with >0 counts | Bins with >2000 counts | High rate bins dominated by noise | Noise dominated (total time) | Noise dominated (detector-on time) | Marked lightcurve |
|---|---|---|---|---|---|---|---|
| A | 7340 | 5218 | 11 | 11 | 0.15% | 0.21% | 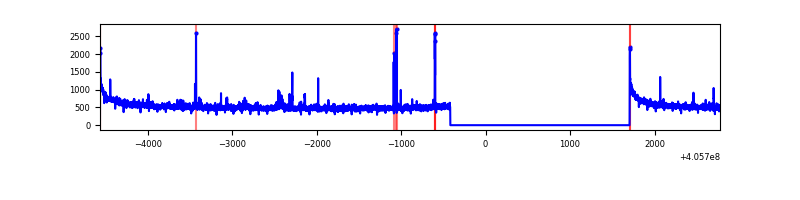 |
| B | 7340 | 5218 | 113 | 113 | 1.54% | 2.17% | 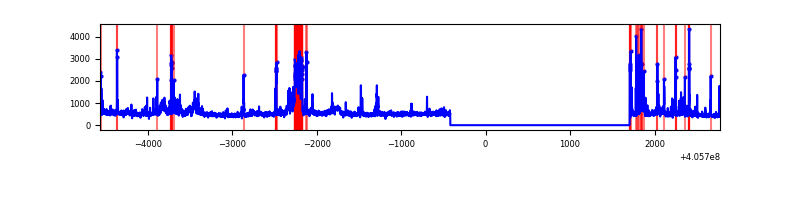 |
| C | 7340 | 5218 | 5 | 5 | 0.07% | 0.10% | 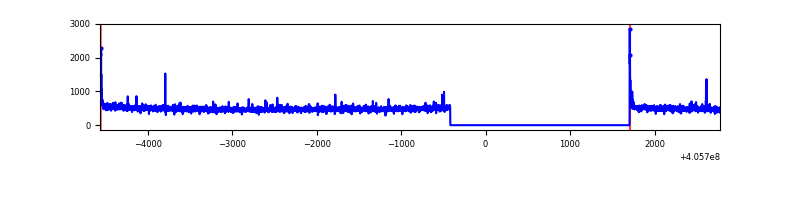 |
| D | 7340 | 5218 | 162 | 162 | 2.21% | 3.10% | 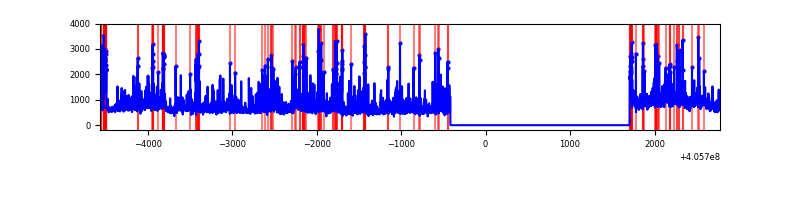 |
Top three noisy pixels from each quadrant. If the there are fewer than three noisy pixels in the level2.evt file, extra rows are filled as -1
| Pixel properties | Quadrant properties | ||||||
|---|---|---|---|---|---|---|---|
| Quadrant | DetID | PixID | Counts | Sigma | Mean | Median | Sigma |
| A | 10 | 83 | 411968 | 3439.09 | 597 | 586 | 119.6 |
| A | 12 | 189 | 40330 | 332.25 | 597 | 586 | 119.6 |
| A | 10 | 248 | 26337 | 215.27 | 597 | 586 | 119.6 |
| B | 5 | 184 | 618147 | 5617.09 | 586 | 570 | 109.9 |
| B | 8 | 3 | 158848 | 1439.6 | 586 | 570 | 109.9 |
| B | 0 | 189 | 62751 | 565.56 | 586 | 570 | 109.9 |
| C | 15 | 214 | 216582 | 1594.76 | 585 | 588 | 135.4 |
| C | 0 | 10 | 29388 | 212.64 | 585 | 588 | 135.4 |
| C | 14 | 254 | 20265 | 145.28 | 585 | 588 | 135.4 |
| D | 2 | 16 | 1240417 | 8821.99 | 582 | 566 | 140.5 |
| D | 13 | 249 | 310047 | 2202.07 | 582 | 566 | 140.5 |
| D | 2 | 250 | 105199 | 744.5 | 582 | 566 | 140.5 |
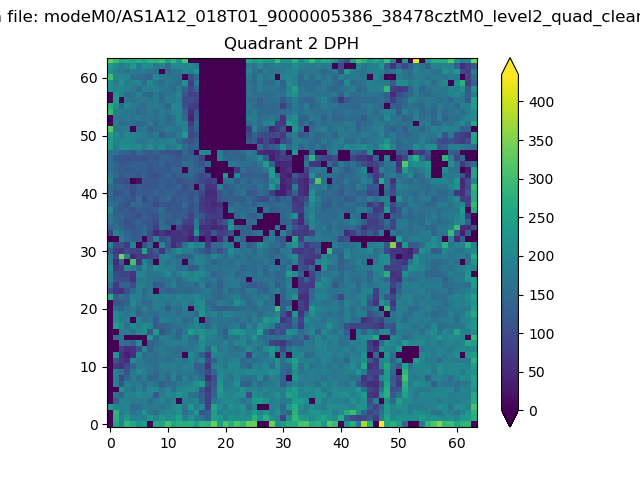
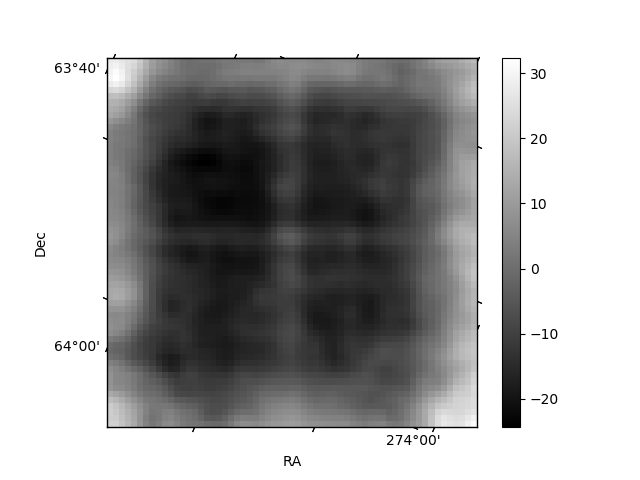
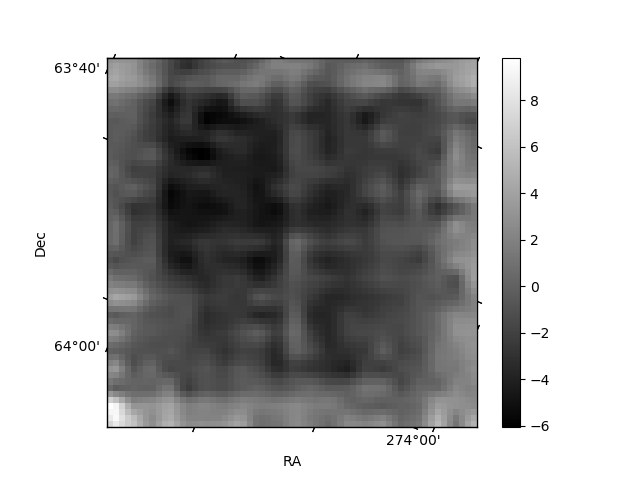
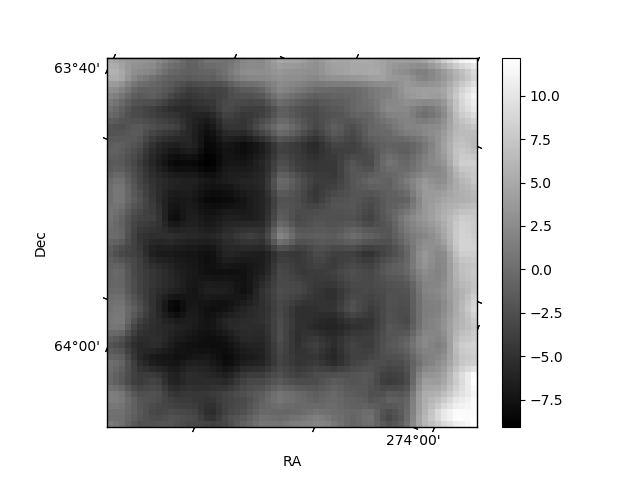
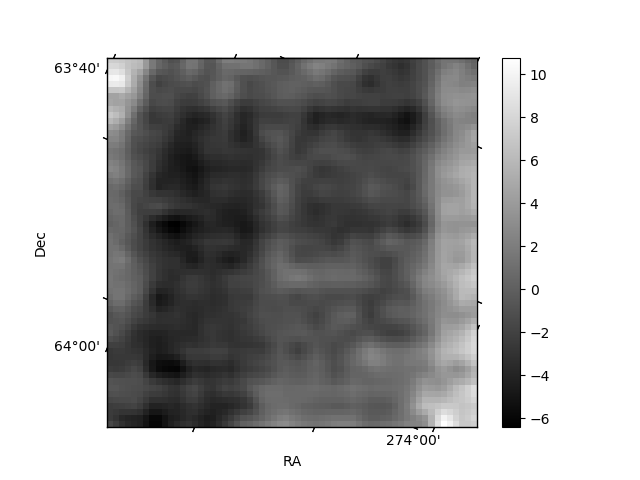
Histogram calculated using DETX and DETY for each event in the final _common_clean file
| Quadrant A | 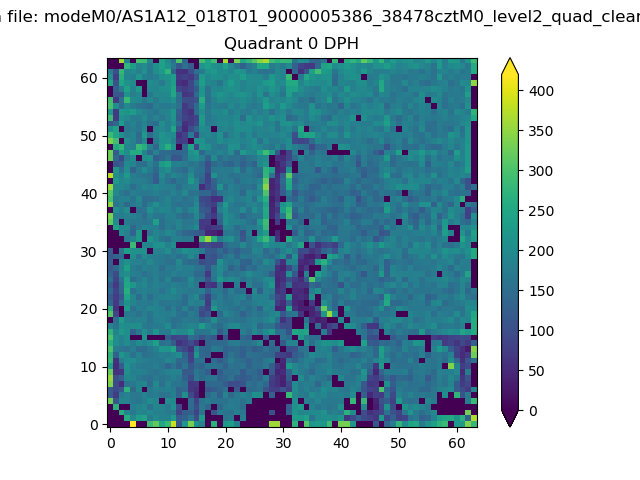 |
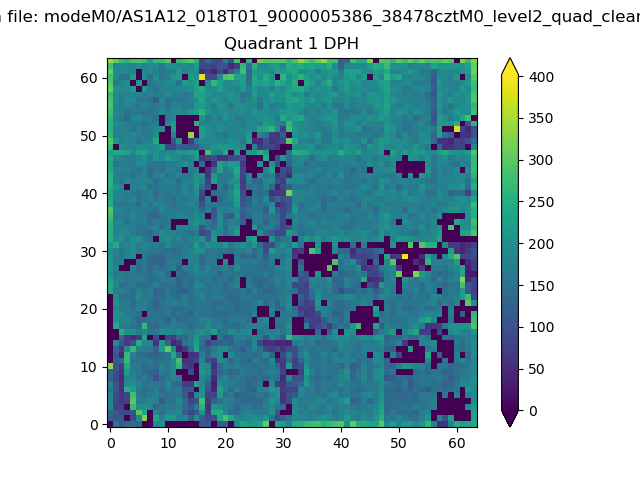 |
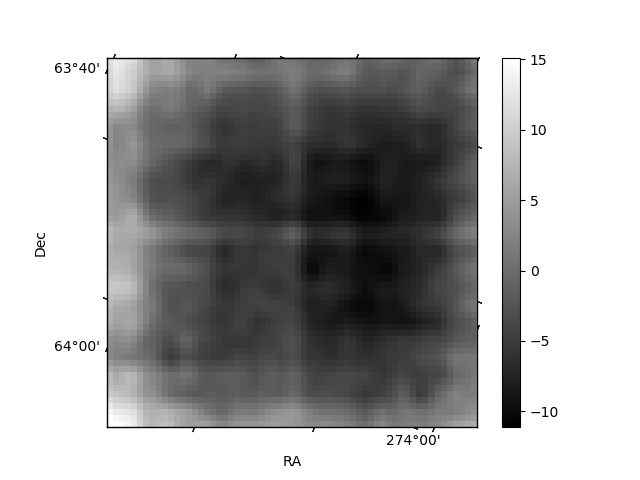
Quadrant B |
|---|---|---|---|
| Quadrant D | 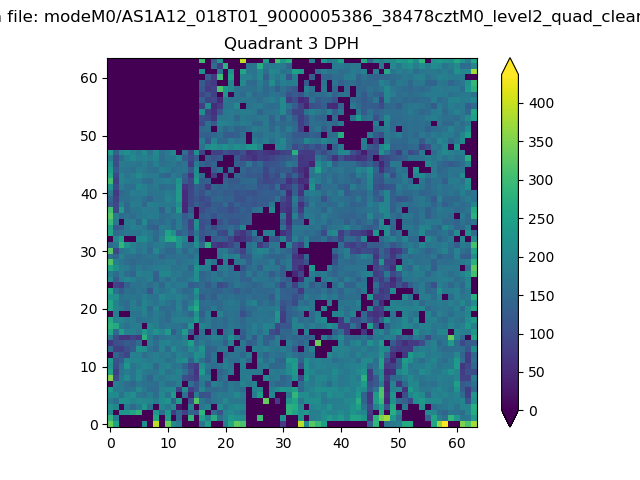 |
 |
Quadrant C |
| Plot type | Count rate plots | Images |
|---|---|---|
| Comparison with Poisson distribution Blue bars denote a histogram of data divided into 1 sec bins. Red curve is a Poisson curve with rate = median count rate of data. |
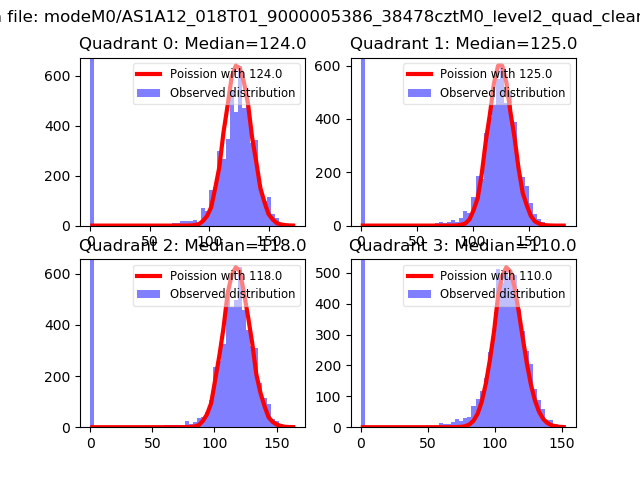 |
 |
| Quadrant-wise count rates Data is divided into 100 sec bins |
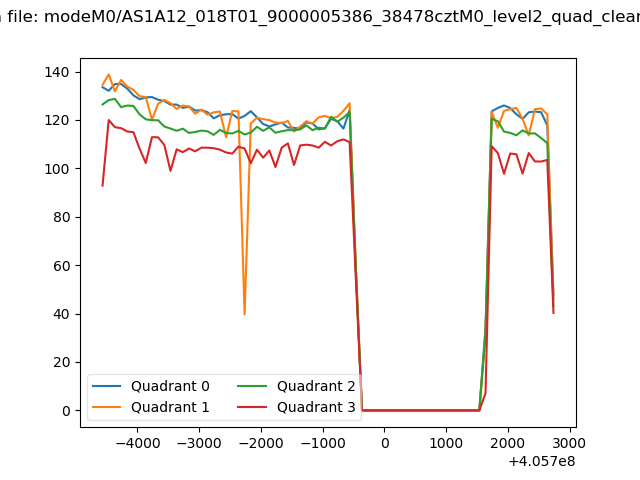 |
|
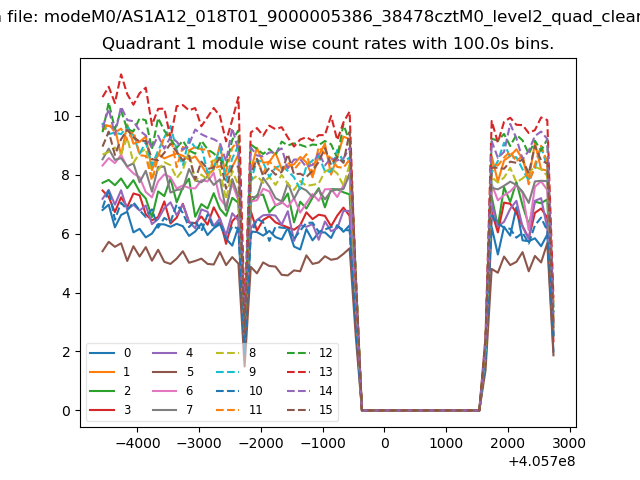
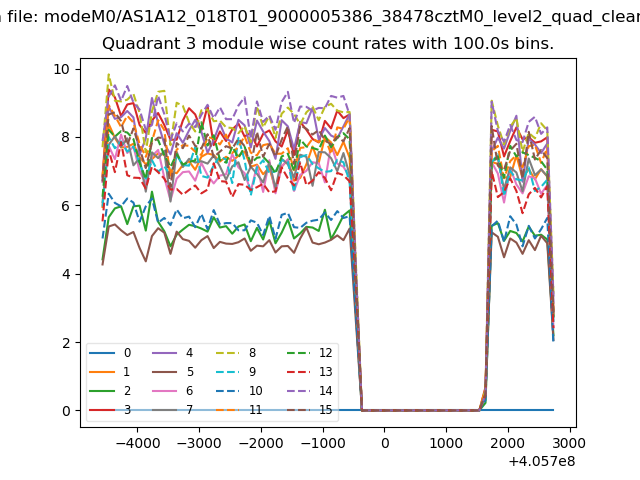
| Module-wise count rates for Quadrant A Data is divided into 100 sec bins |
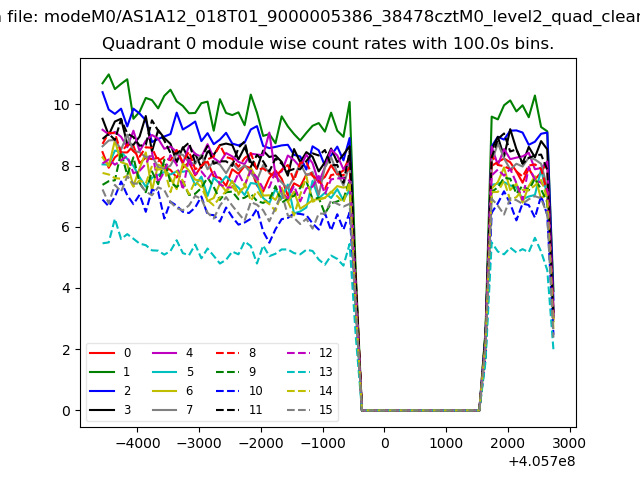 |
 |
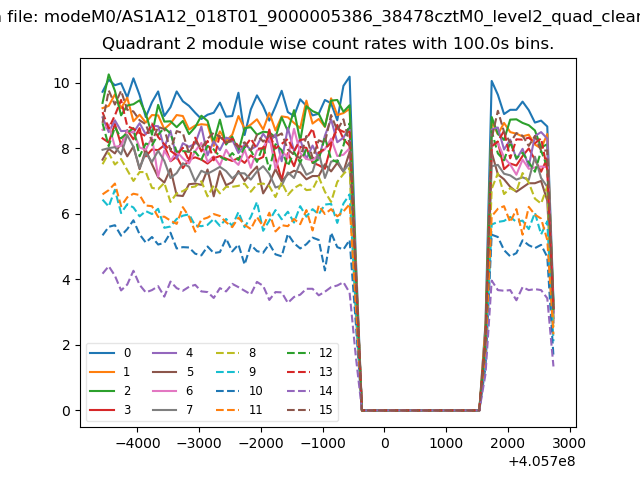
| Module-wise count rates for Quadrant B Data is divided into 100 sec bins |
 |
 |
| Module-wise count rates for Quadrant C Data is divided into 100 sec bins |
 |
 |
| Module-wise count rates for Quadrant D Data is divided into 100 sec bins |
 |
 |
| Parameter | Plot |
|---|---|
| CZT HV Monitor | 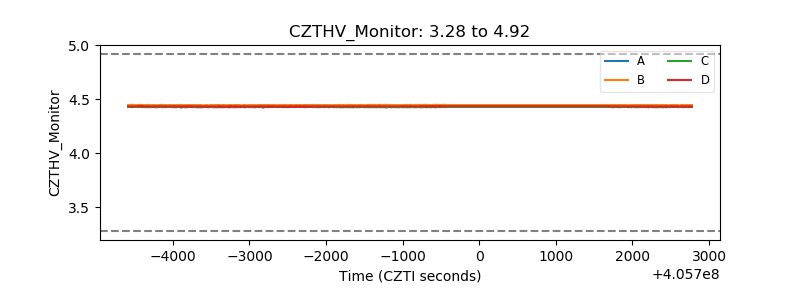 |
| D_VDD | 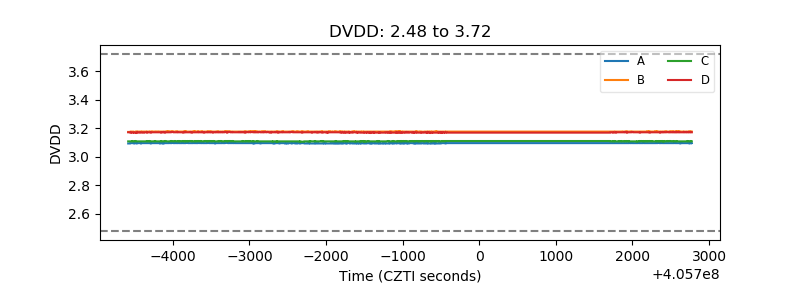 |
| Temperature 1 | 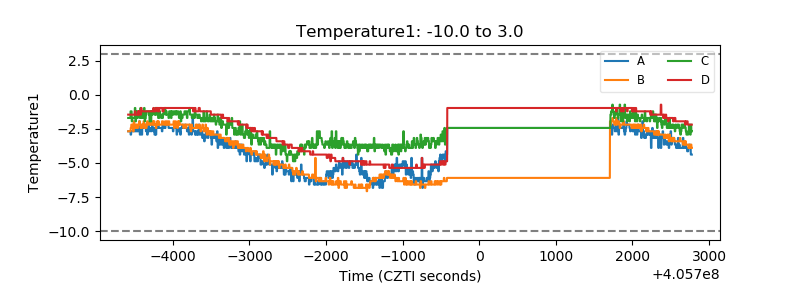 |
| Veto HV Monitor | 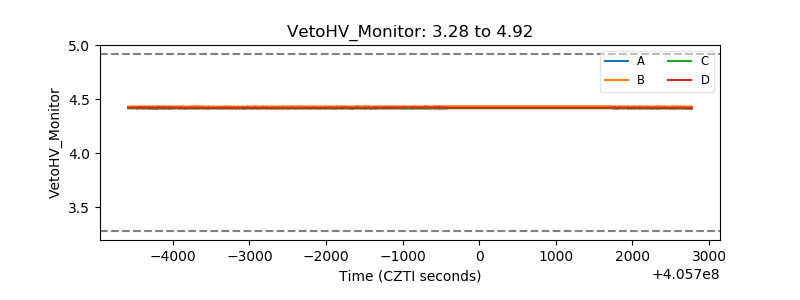 |
| Veto LLD | 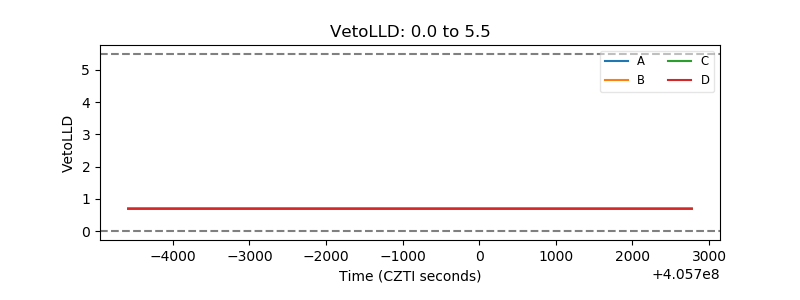 |
| Alpha Counter | 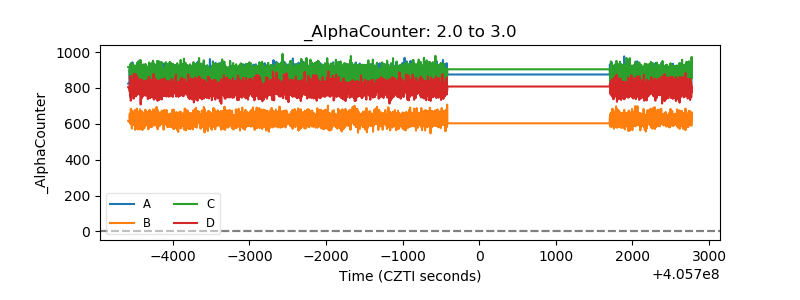 |
| _CPM_Rate | 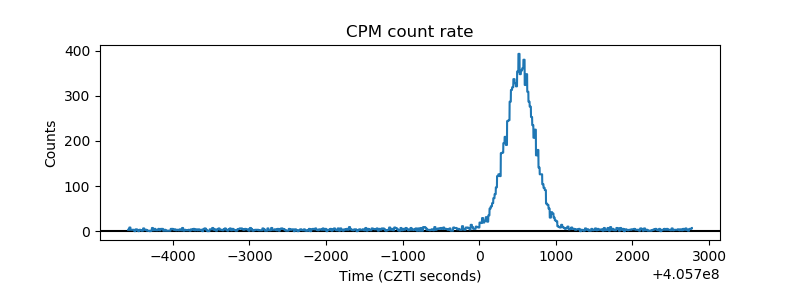 |
| CZT Counter | 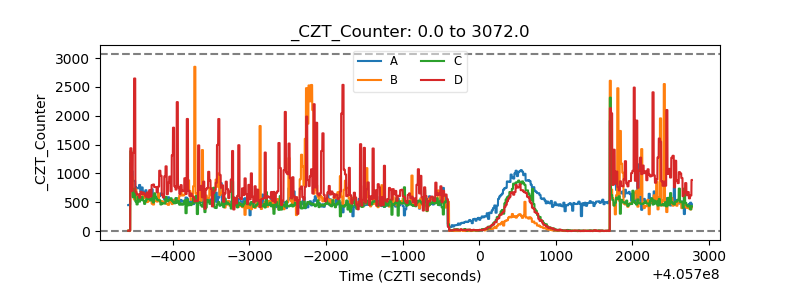 |
| +2.5 Volts monitor |  |
| +5 Volts monitor | 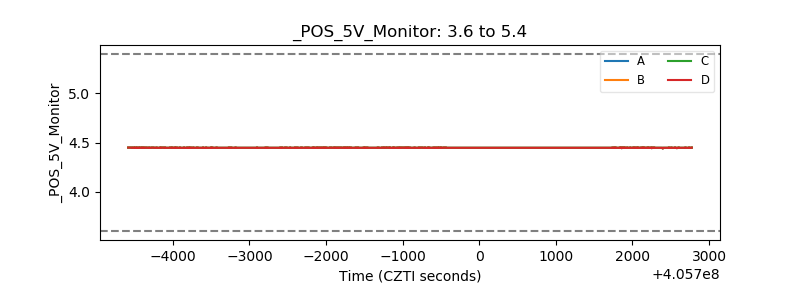 |
| _ROLL_ROT | 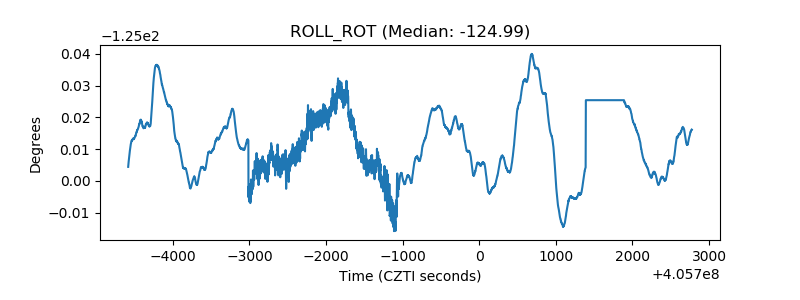 |
| _Roll_DEC | 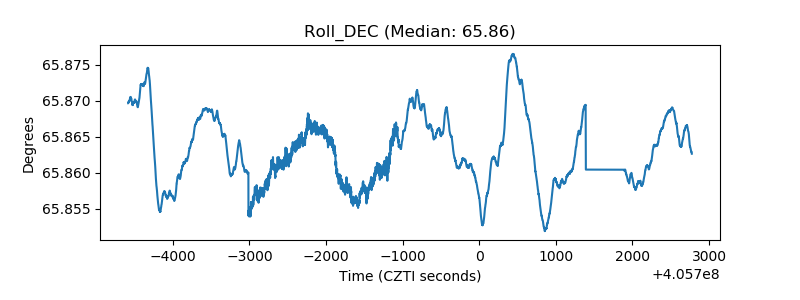 |
| _Roll_RA | 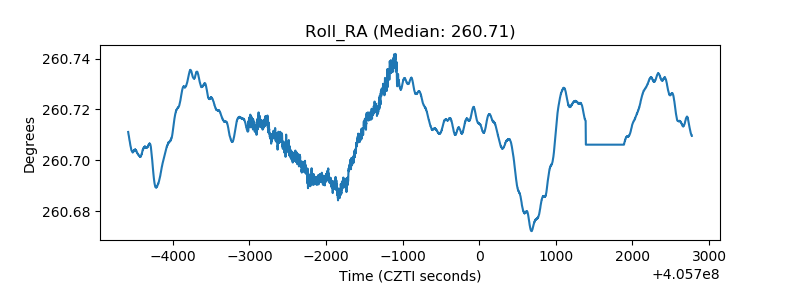 |
| Veto Counter | 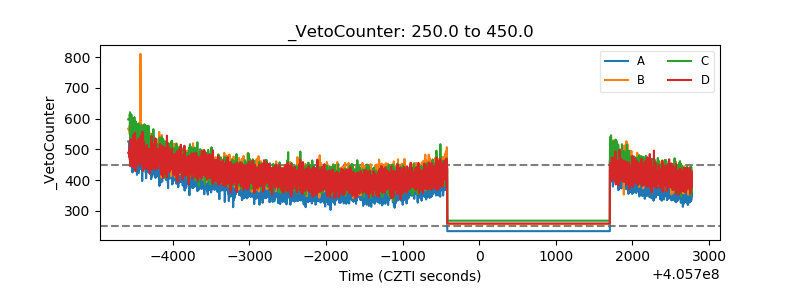 |