| Param | Original file | Final file |
|---|---|---|
| Filename | modeM0/AS1A12_018T01_9000005386_38479cztM0_level2.fits | modeM0/AS1A12_018T01_9000005386_38479cztM0_level2_quad_clean.evt |
| Size (bytes) | 348,863,040 | 87,373,440 |
| Size | 332.7 MB | 83.3 MB |
| Events in quadrant A | 2,637,309 | 601,065 |
| Events in quadrant B | 2,992,857 | 594,187 |
| Events in quadrant C | 2,431,709 | 574,571 |
| Events in quadrant D | 4,452,929 | 516,479 |
| Mode SS | |||
|---|---|---|---|
| Quadrant | BADHDUFLAG | Total packets | Discarded packets |
| A | 0 | 106 | 0 |
| B | 0 | 106 | 0 |
| C | 0 | 106 | 0 |
| D | 0 | 106 | 0 |
| Mode M9 | |||
|---|---|---|---|
| Quadrant | BADHDUFLAG | Total packets | Discarded packets |
| A | 0 | 19 | 0 |
| B | 0 | 19 | 0 |
| C | 0 | 19 | 0 |
| D | 0 | 19 | 0 |
| Mode M0 | |||
|---|---|---|---|
| Quadrant | BADHDUFLAG | Total packets | Discarded packets |
| A | 0 | 10995 | 2 |
| B | 0 | 12312 | 1 |
| C | 0 | 10403 | 1 |
| D | 0 | 16921 | 1 |
| Quadrant | Total seconds | Saturated seconds | Saturation percentage |
|---|---|---|---|
| A | 5124 | 8 | 0.156128% |
| B | 5124 | 136 | 2.654176% |
| C | 5124 | 6 | 0.117096% |
| D | 5124 | 260 | 5.074161% |
Noise dominated data is calculated using 1-second bins in cleaned event files. If a bin has >2000 counts, and if more than 50% of those come from <1% of pixels, then it is considered to be noise-dominated and hence unusable.
| Quadrant | # 1 sec bins | Bins with >0 counts | Bins with >2000 counts | High rate bins dominated by noise | Noise dominated (total time) | Noise dominated (detector-on time) | Marked lightcurve |
|---|---|---|---|---|---|---|---|
| A | 7067 | 5125 | 4 | 4 | 0.06% | 0.08% | 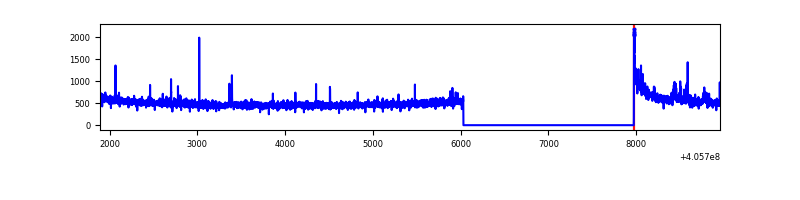 |
| B | 7067 | 5125 | 113 | 113 | 1.60% | 2.20% | 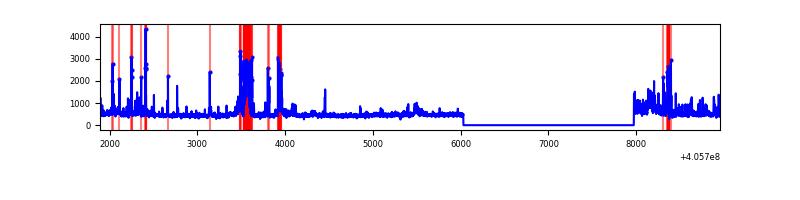 |
| C | 7067 | 5125 | 5 | 5 | 0.07% | 0.10% | 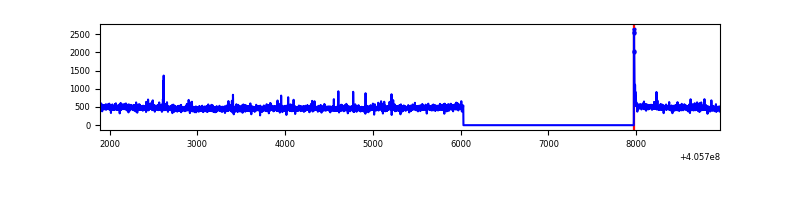 |
| D | 7067 | 5125 | 201 | 201 | 2.84% | 3.92% | 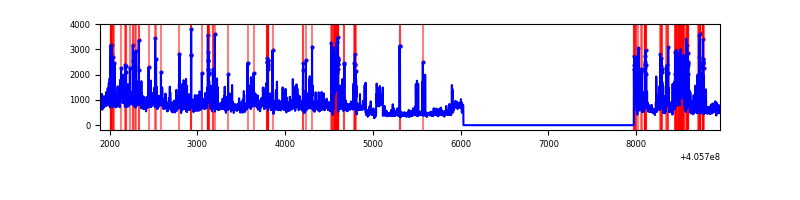 |
Top three noisy pixels from each quadrant. If the there are fewer than three noisy pixels in the level2.evt file, extra rows are filled as -1
| Pixel properties | Quadrant properties | ||||||
|---|---|---|---|---|---|---|---|
| Quadrant | DetID | PixID | Counts | Sigma | Mean | Median | Sigma |
| A | 10 | 83 | 345732 | 2978.26 | 567 | 554 | 115.9 |
| A | 0 | 8 | 40909 | 348.19 | 567 | 554 | 115.9 |
| A | 6 | 10 | 16992 | 141.83 | 567 | 554 | 115.9 |
| B | 5 | 184 | 411902 | 3859.69 | 561 | 547 | 106.6 |
| B | 4 | 171 | 83001 | 773.66 | 561 | 547 | 106.6 |
| B | 0 | 183 | 72571 | 675.79 | 561 | 547 | 106.6 |
| C | 15 | 214 | 210430 | 1612.6 | 556 | 559 | 130.1 |
| C | 14 | 254 | 21127 | 158.04 | 556 | 559 | 130.1 |
| C | 0 | 10 | 18781 | 140.01 | 556 | 559 | 130.1 |
| D | 2 | 16 | 1219463 | 9186.61 | 548 | 532 | 132.7 |
| D | 10 | 118 | 327741 | 2466.05 | 548 | 532 | 132.7 |
| D | 13 | 249 | 186420 | 1400.97 | 548 | 532 | 132.7 |
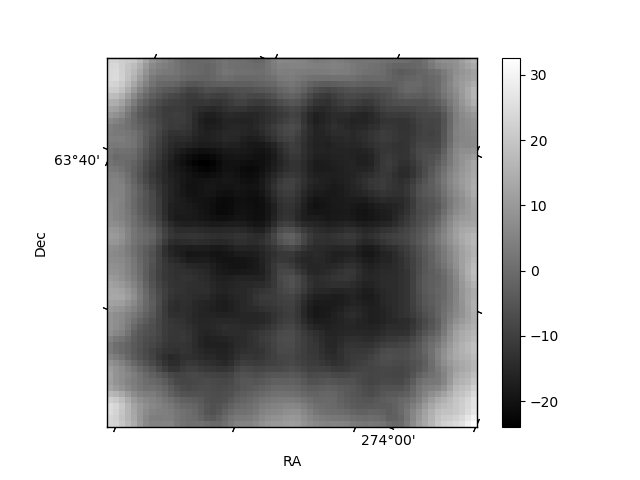
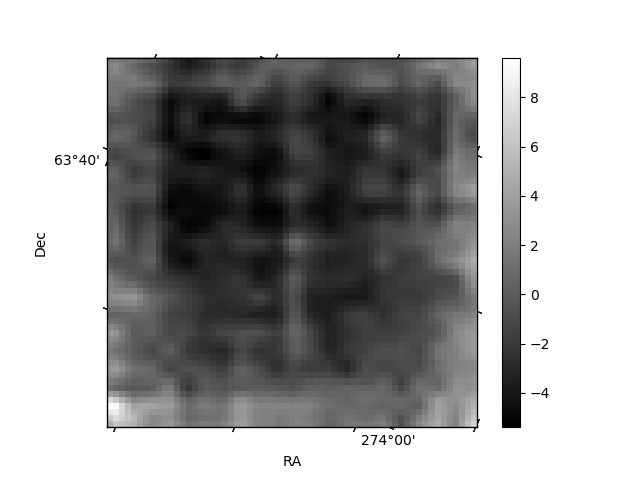
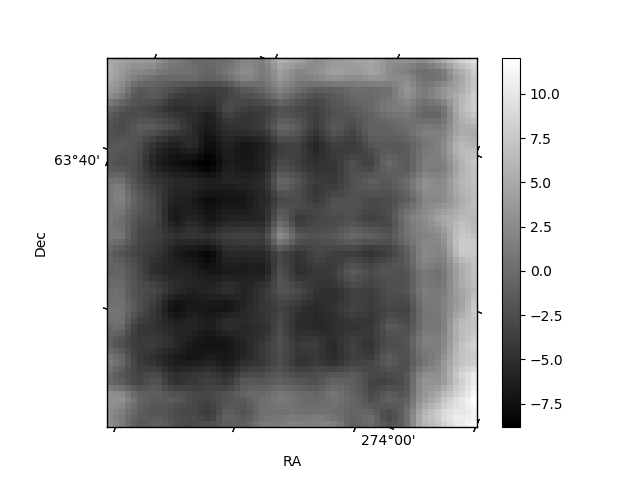
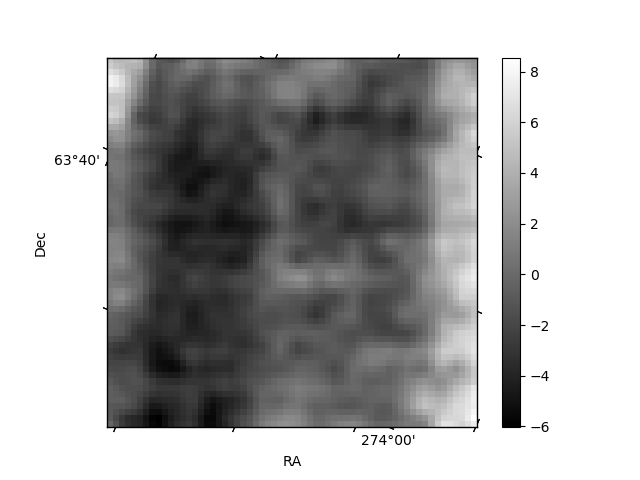
Histogram calculated using DETX and DETY for each event in the final _common_clean file
| Quadrant A | 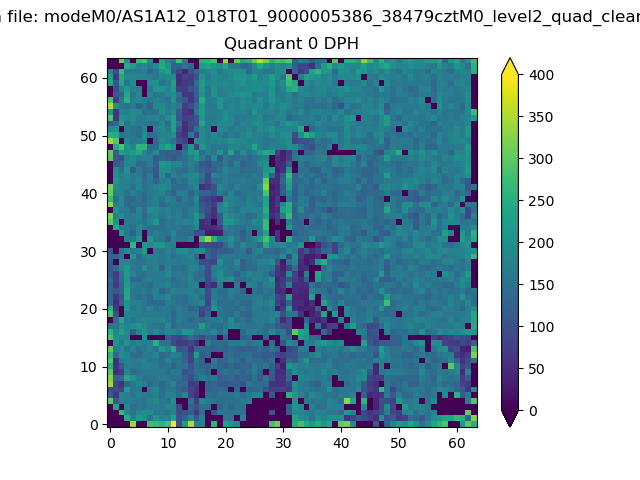 |
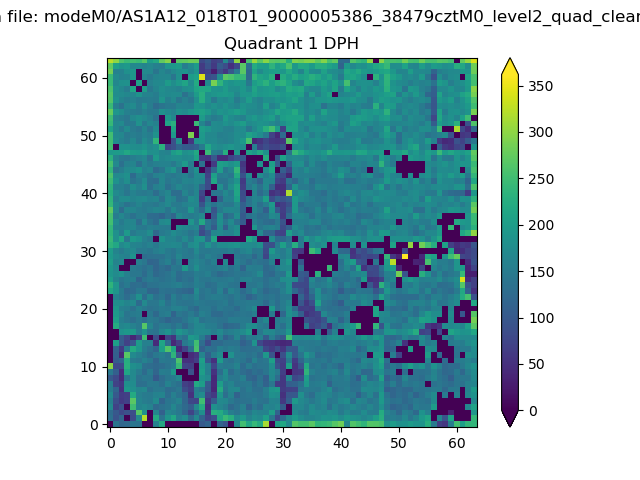 |
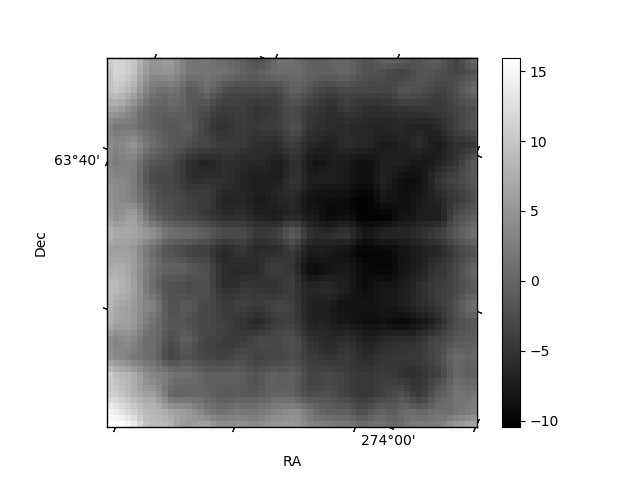
Quadrant B |
|---|---|---|---|
| Quadrant D | 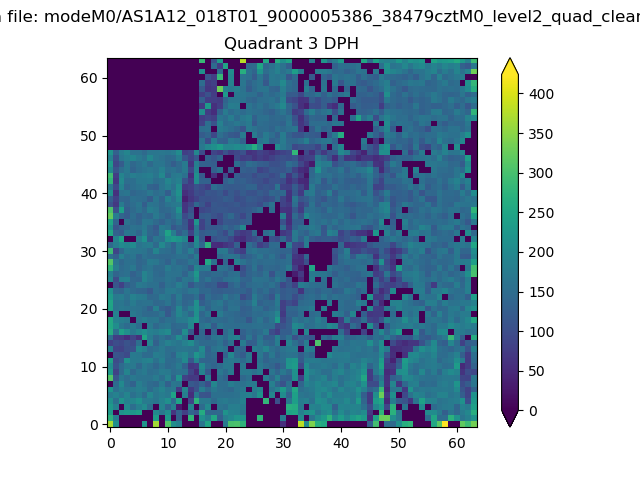 |
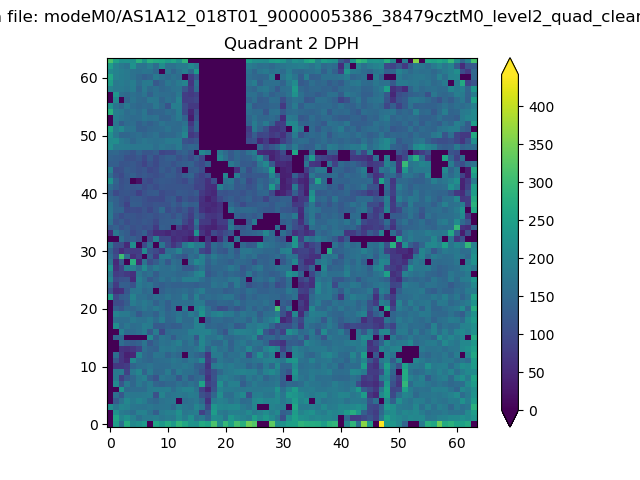 |
Quadrant C |
| Plot type | Count rate plots | Images |
|---|---|---|
| Comparison with Poisson distribution Blue bars denote a histogram of data divided into 1 sec bins. Red curve is a Poisson curve with rate = median count rate of data. |
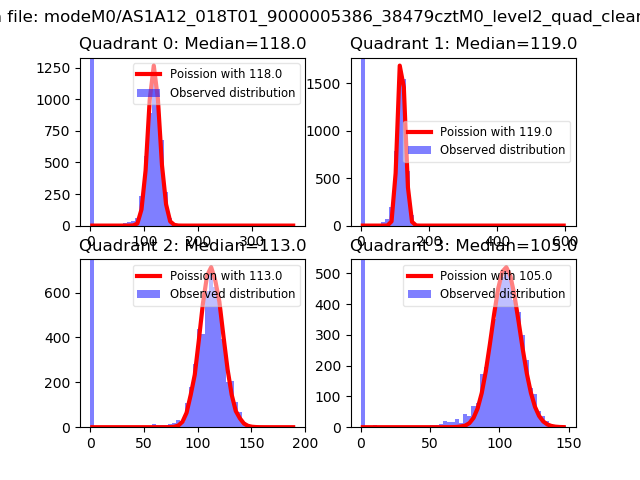 |
 |
| Quadrant-wise count rates Data is divided into 100 sec bins |
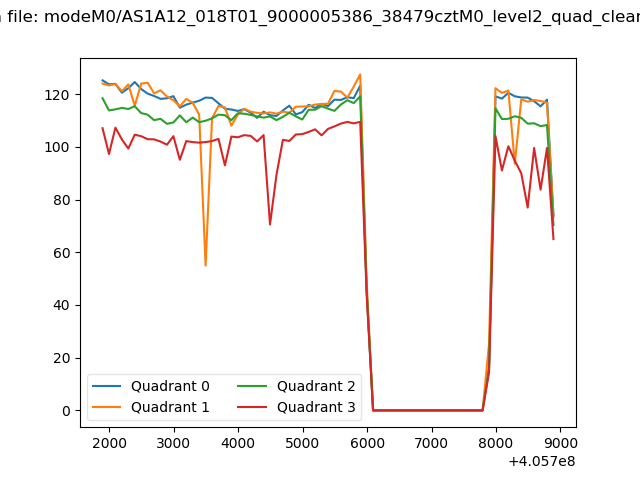 |
|
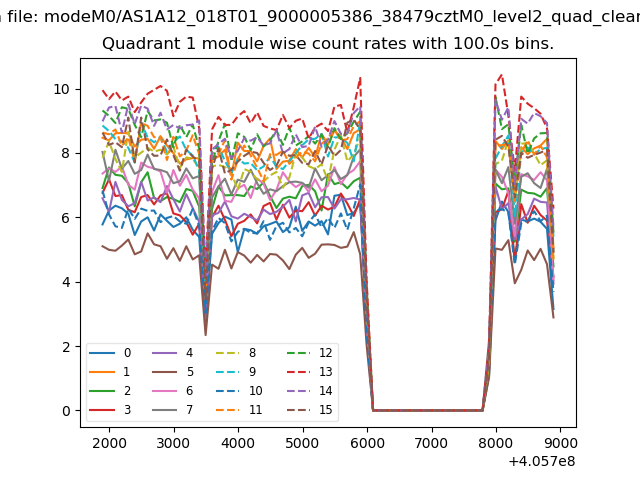
| Module-wise count rates for Quadrant A Data is divided into 100 sec bins |
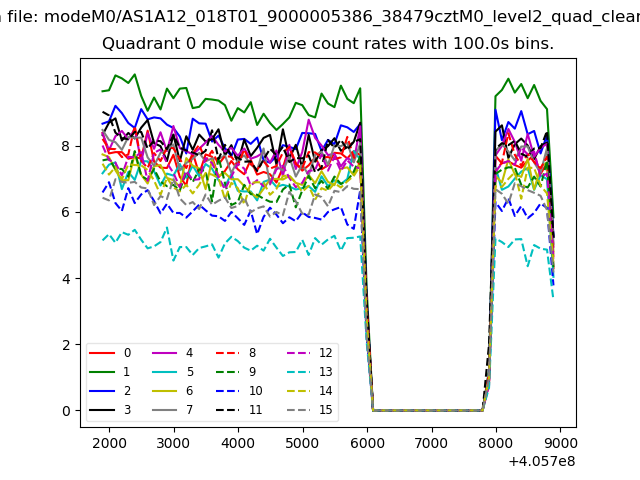 |
 |
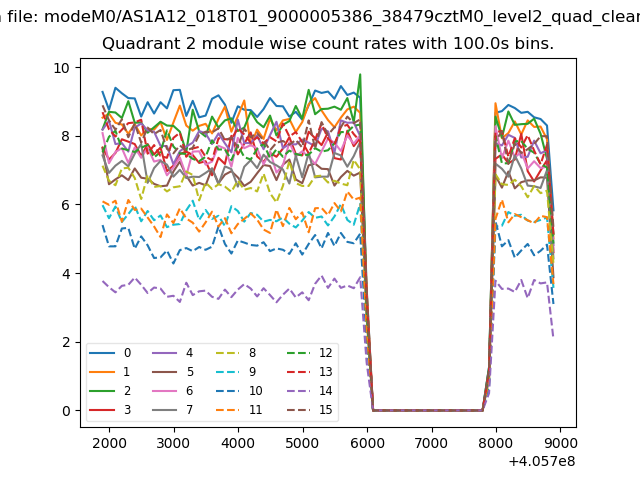
| Module-wise count rates for Quadrant B Data is divided into 100 sec bins |
 |
 |
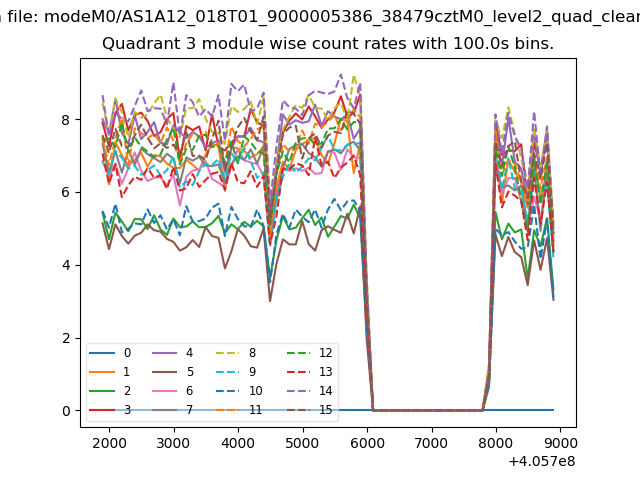
| Module-wise count rates for Quadrant C Data is divided into 100 sec bins |
 |
 |
| Module-wise count rates for Quadrant D Data is divided into 100 sec bins |
 |
 |
| Parameter | Plot |
|---|---|
| CZT HV Monitor | 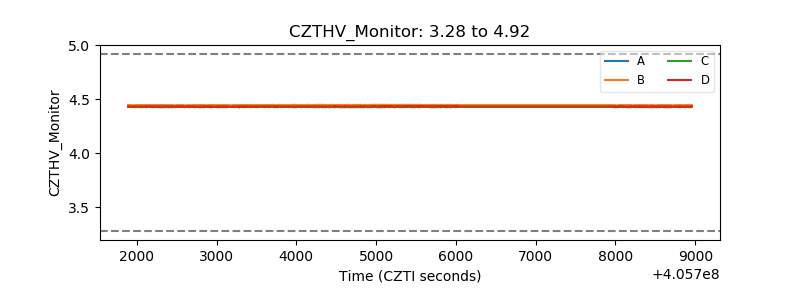 |
| D_VDD | 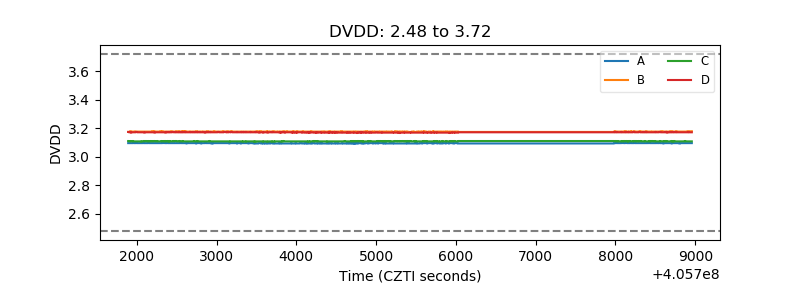 |
| Temperature 1 | 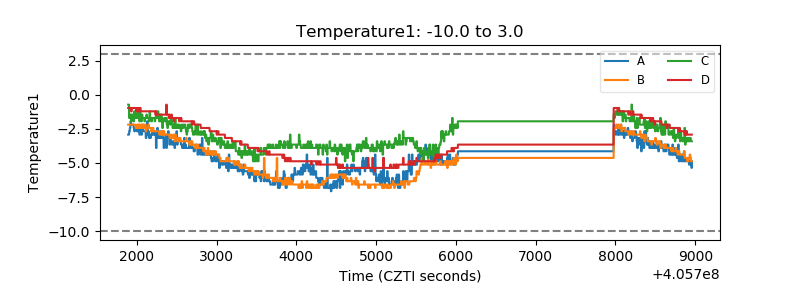 |
| Veto HV Monitor | 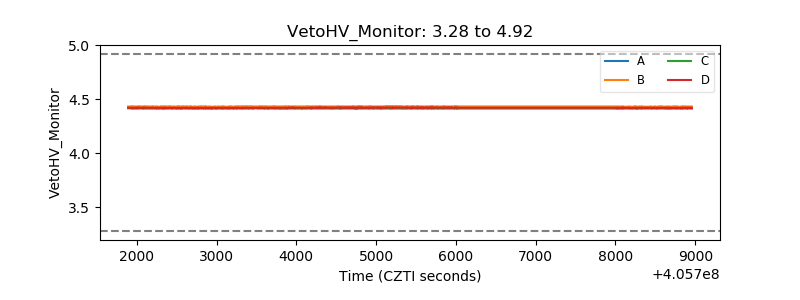 |
| Veto LLD | 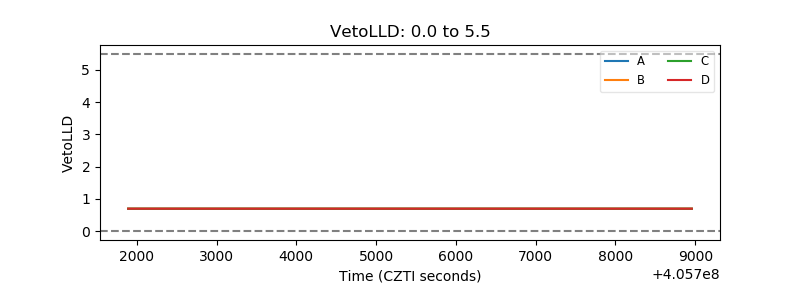 |
| Alpha Counter | 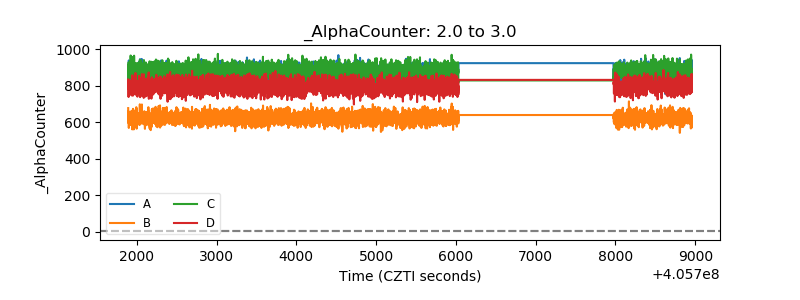 |
| _CPM_Rate | 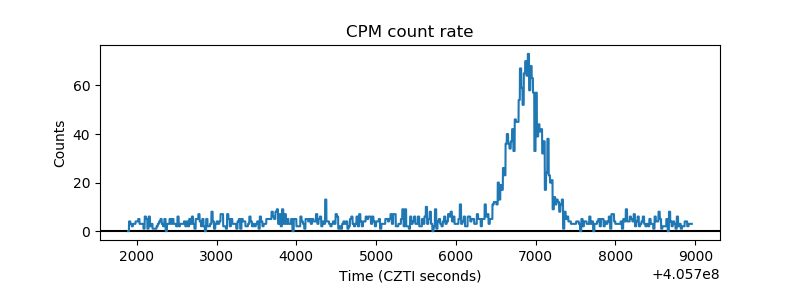 |
| CZT Counter | 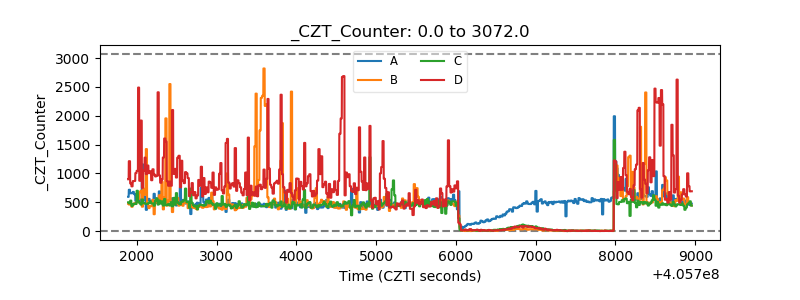 |
| +2.5 Volts monitor | 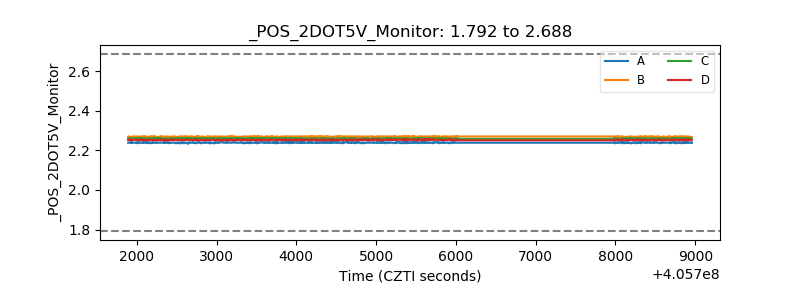 |
| +5 Volts monitor | 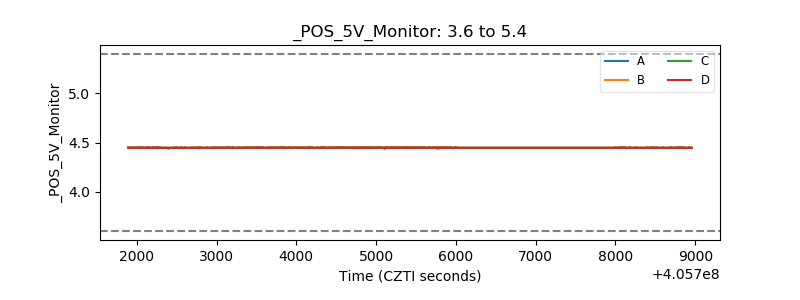 |
| _ROLL_ROT | 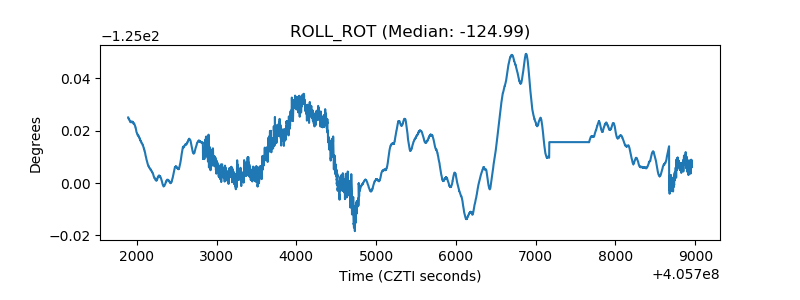 |
| _Roll_DEC | 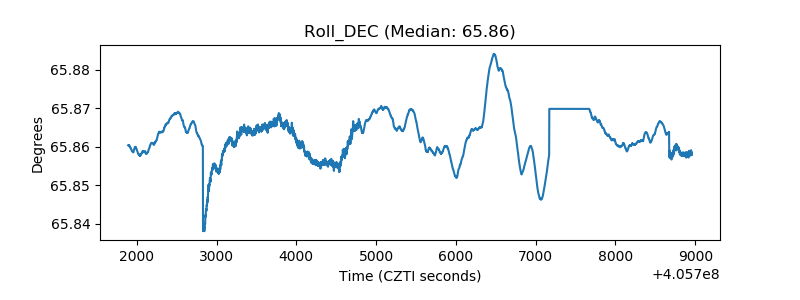 |
| _Roll_RA | 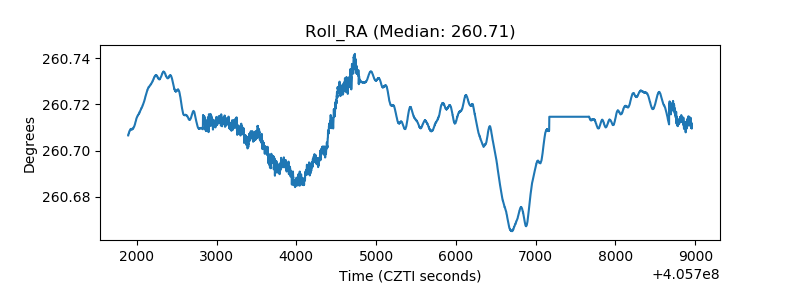 |
| Veto Counter | 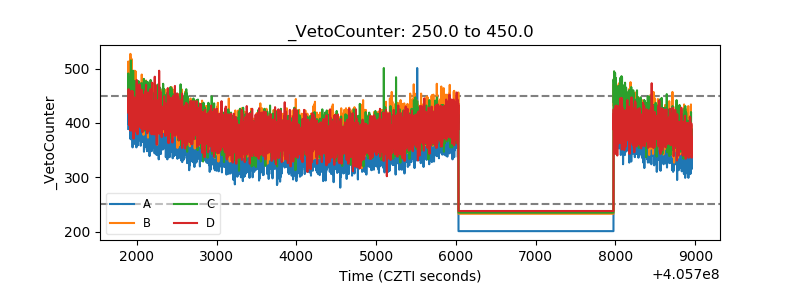 |