| Param | Original file | Final file |
|---|---|---|
| Filename | modeM0/AS1A12_018T01_9000005386_38480cztM0_level2.fits | modeM0/AS1A12_018T01_9000005386_38480cztM0_level2_quad_clean.evt |
| Size (bytes) | 372,415,680 | 89,504,640 |
| Size | 355.2 MB | 85.4 MB |
| Events in quadrant A | 2,890,931 | 613,585 |
| Events in quadrant B | 3,175,241 | 615,757 |
| Events in quadrant C | 2,523,773 | 591,114 |
| Events in quadrant D | 4,777,412 | 512,671 |
| Mode SS | |||
|---|---|---|---|
| Quadrant | BADHDUFLAG | Total packets | Discarded packets |
| A | 0 | 112 | 0 |
| B | 0 | 112 | 0 |
| C | 0 | 112 | 0 |
| D | 0 | 112 | 0 |
| Mode M9 | |||
|---|---|---|---|
| Quadrant | BADHDUFLAG | Total packets | Discarded packets |
| A | 0 | 17 | 0 |
| B | 0 | 17 | 0 |
| C | 0 | 17 | 0 |
| D | 0 | 18 | 0 |
| Mode M0 | |||
|---|---|---|---|
| Quadrant | BADHDUFLAG | Total packets | Discarded packets |
| A | 0 | 11999 | 3 |
| B | 0 | 13009 | 2 |
| C | 0 | 10892 | 2 |
| D | 0 | 17986 | 2 |
| Quadrant | Total seconds | Saturated seconds | Saturation percentage |
|---|---|---|---|
| A | 5375 | 25 | 0.465116% |
| B | 5375 | 83 | 1.544186% |
| C | 5375 | 12 | 0.223256% |
| D | 5375 | 462 | 8.595349% |
Noise dominated data is calculated using 1-second bins in cleaned event files. If a bin has >2000 counts, and if more than 50% of those come from <1% of pixels, then it is considered to be noise-dominated and hence unusable.
| Quadrant | # 1 sec bins | Bins with >0 counts | Bins with >2000 counts | High rate bins dominated by noise | Noise dominated (total time) | Noise dominated (detector-on time) | Marked lightcurve |
|---|---|---|---|---|---|---|---|
| A | 6957 | 5376 | 15 | 15 | 0.22% | 0.28% | 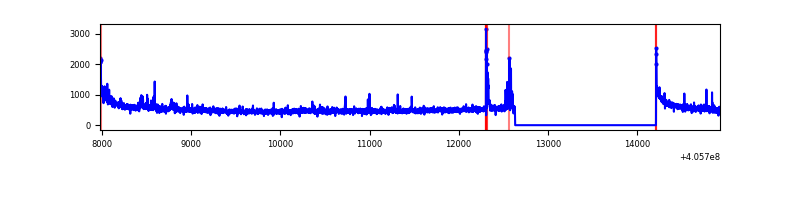 |
| B | 6957 | 5376 | 66 | 66 | 0.95% | 1.23% | 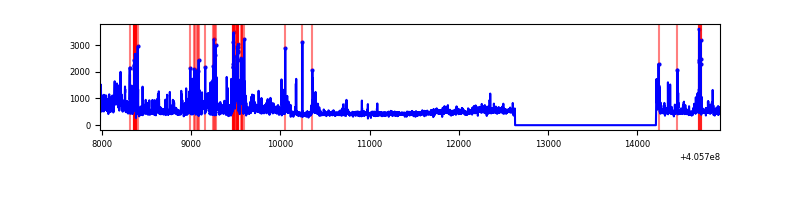 |
| C | 6957 | 5376 | 8 | 8 | 0.11% | 0.15% | 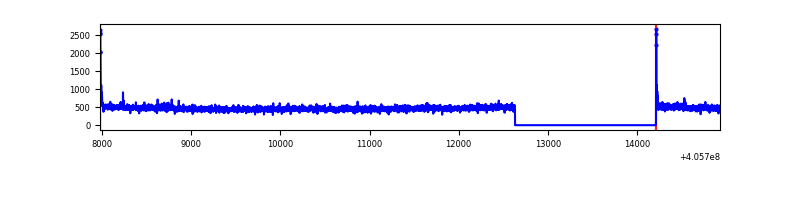 |
| D | 6957 | 5375 | 420 | 420 | 6.04% | 7.81% | 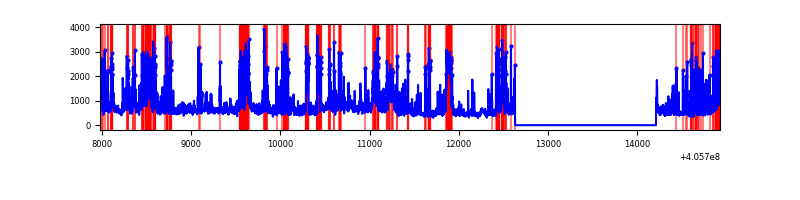 |
Top three noisy pixels from each quadrant. If the there are fewer than three noisy pixels in the level2.evt file, extra rows are filled as -1
| Pixel properties | Quadrant properties | ||||||
|---|---|---|---|---|---|---|---|
| Quadrant | DetID | PixID | Counts | Sigma | Mean | Median | Sigma |
| A | 10 | 83 | 407140 | 3368.99 | 592 | 581 | 120.7 |
| A | 15 | 222 | 56736 | 465.33 | 592 | 581 | 120.7 |
| A | 0 | 8 | 46455 | 380.14 | 592 | 581 | 120.7 |
| B | 0 | 183 | 304855 | 2698.92 | 587 | 571 | 112.7 |
| B | 5 | 184 | 176481 | 1560.28 | 587 | 571 | 112.7 |
| B | 4 | 171 | 97311 | 858.06 | 587 | 571 | 112.7 |
| C | 15 | 214 | 224050 | 1654.9 | 579 | 581 | 135.0 |
| C | 0 | 10 | 32614 | 237.22 | 579 | 581 | 135.0 |
| C | 13 | 61 | 3886 | 24.48 | 579 | 581 | 135.0 |
| D | 12 | 227 | 817035 | 5989.66 | 562 | 546 | 136.3 |
| D | 2 | 16 | 604502 | 4430.55 | 562 | 546 | 136.3 |
| D | 10 | 118 | 386855 | 2833.92 | 562 | 546 | 136.3 |
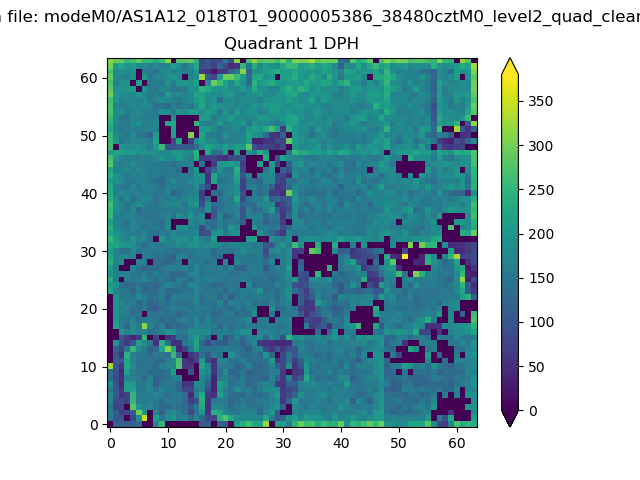
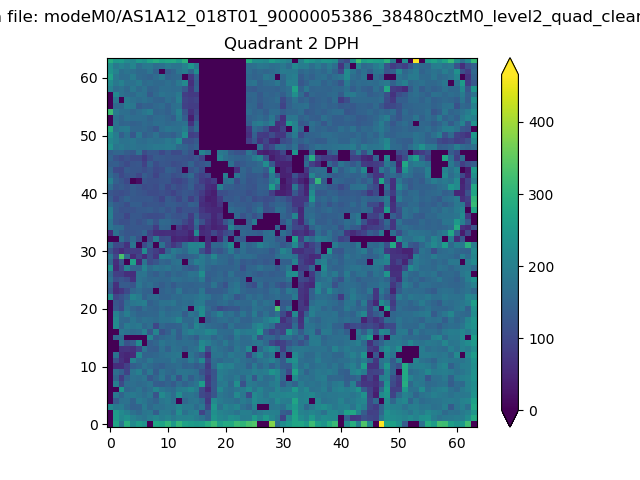
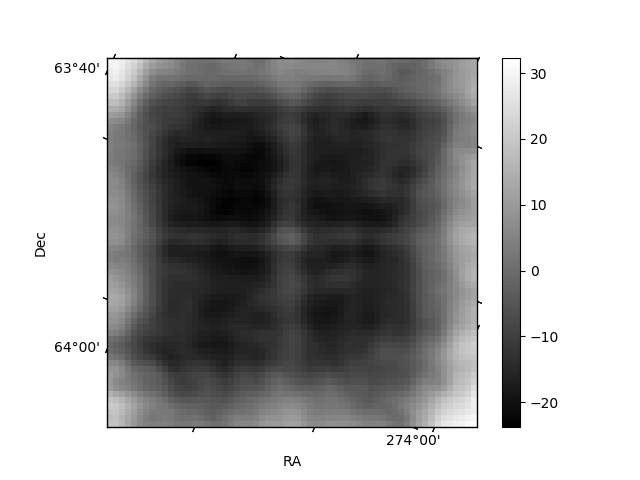
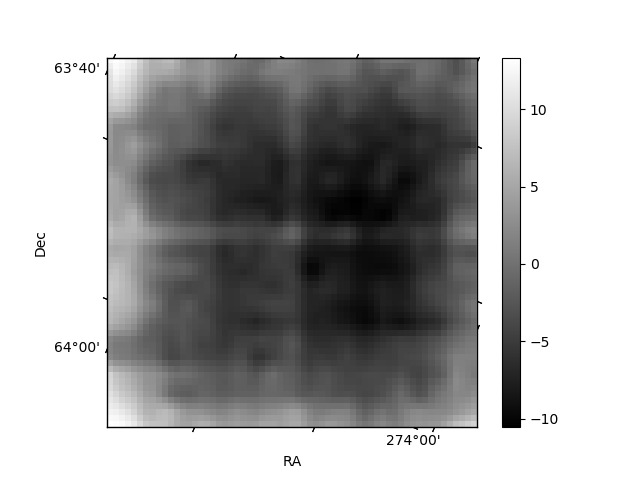
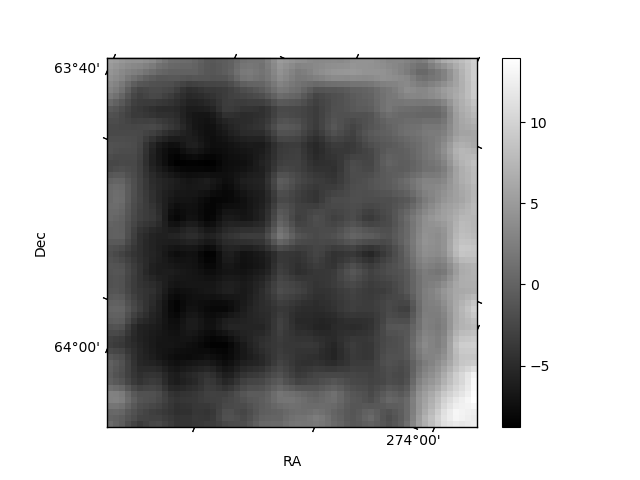
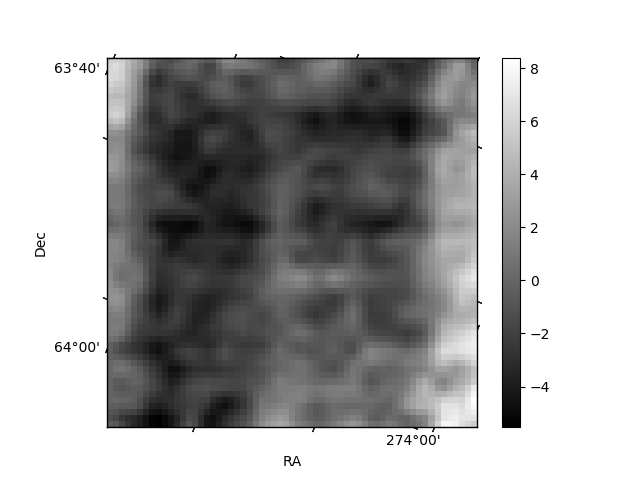
Histogram calculated using DETX and DETY for each event in the final _common_clean file
| Quadrant A |  |
 |
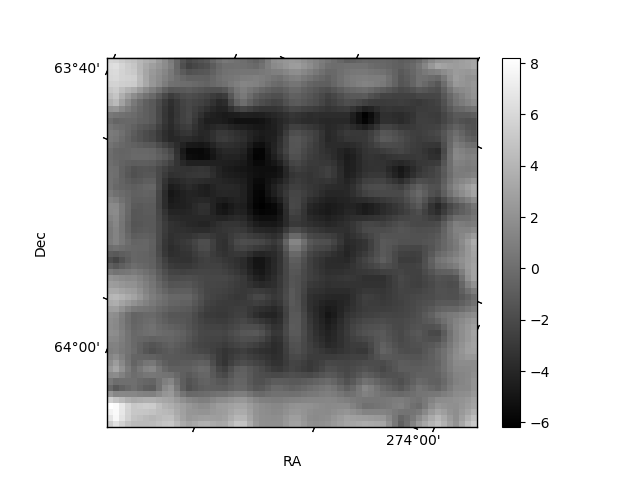
Quadrant B |
|---|---|---|---|
| Quadrant D | 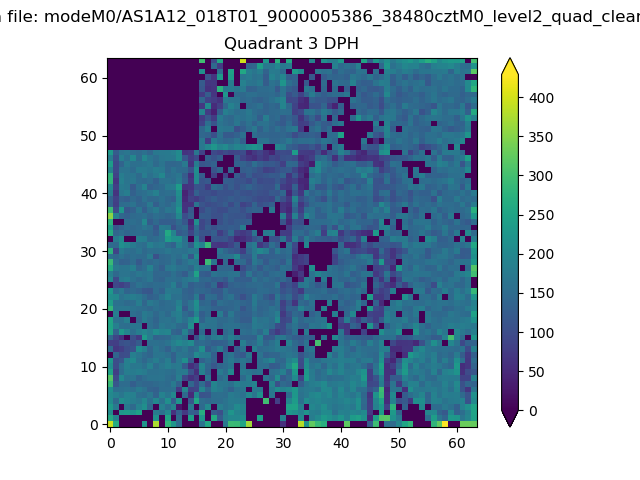 |
 |
Quadrant C |
| Plot type | Count rate plots | Images |
|---|---|---|
| Comparison with Poisson distribution Blue bars denote a histogram of data divided into 1 sec bins. Red curve is a Poisson curve with rate = median count rate of data. |
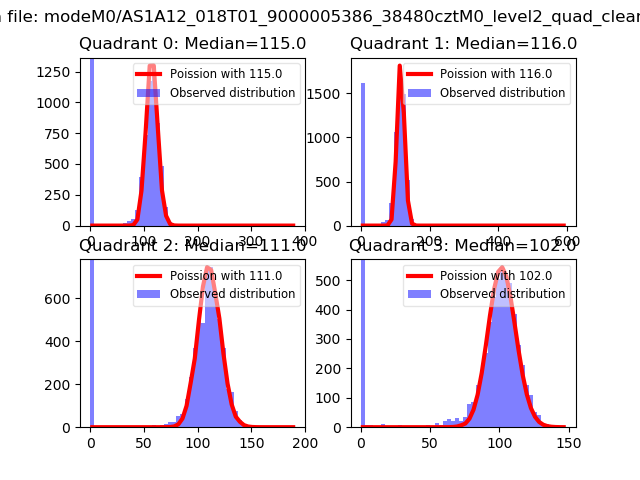 |
 |
| Quadrant-wise count rates Data is divided into 100 sec bins |
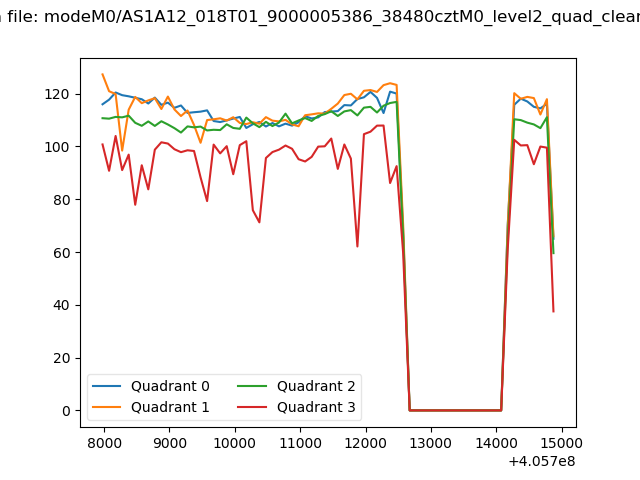 |
|
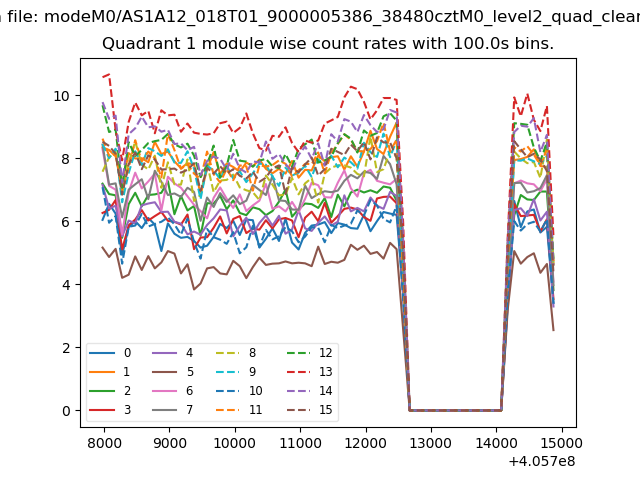
| Module-wise count rates for Quadrant A Data is divided into 100 sec bins |
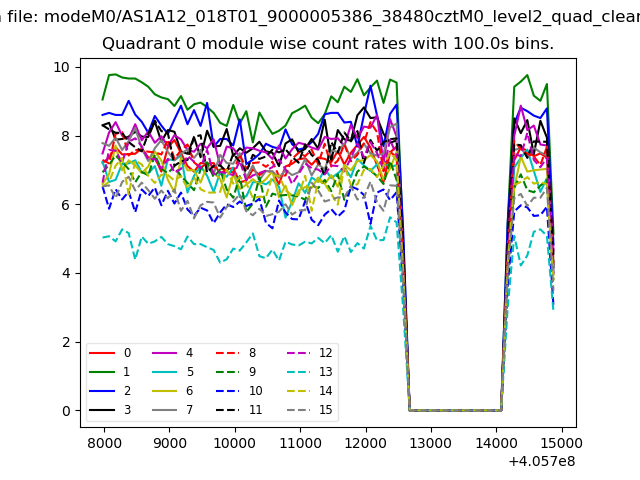 |
 |
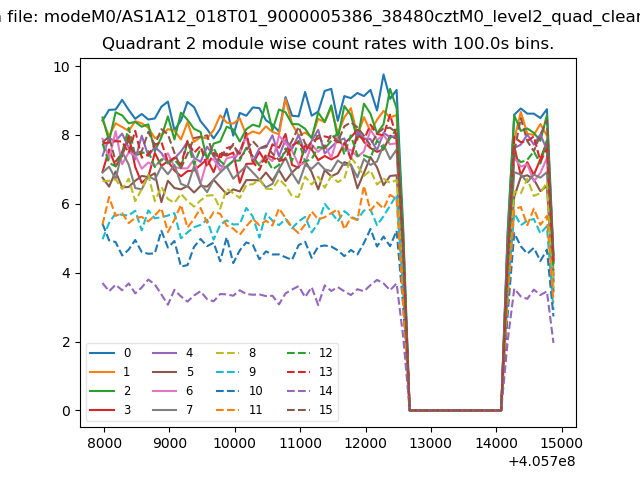
| Module-wise count rates for Quadrant B Data is divided into 100 sec bins |
 |
 |
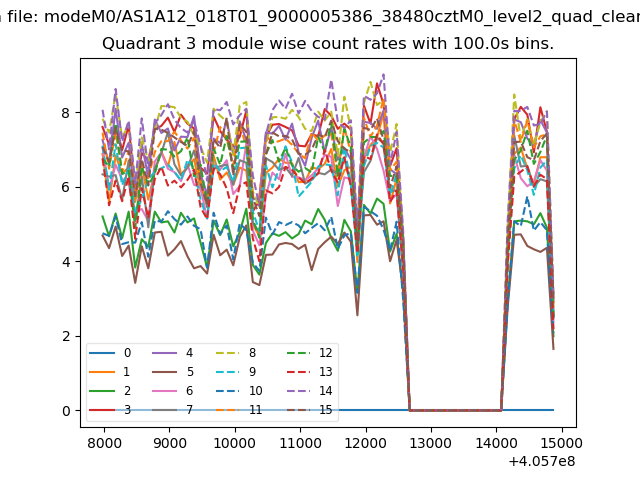
| Module-wise count rates for Quadrant C Data is divided into 100 sec bins |
 |
 |
| Module-wise count rates for Quadrant D Data is divided into 100 sec bins |
 |
 |
| Parameter | Plot |
|---|---|
| CZT HV Monitor |  |
| D_VDD | 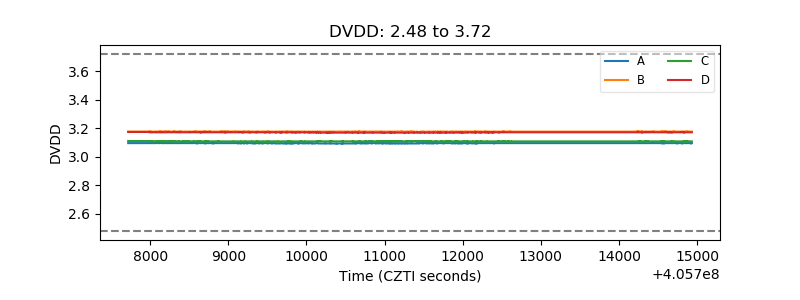 |
| Temperature 1 | 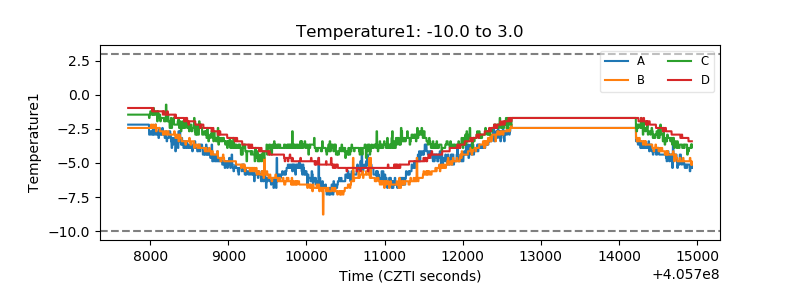 |
| Veto HV Monitor | 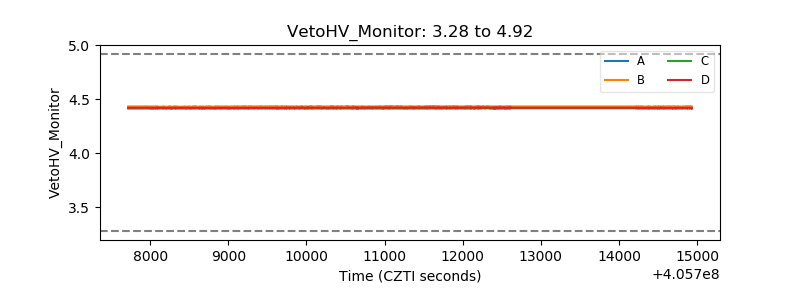 |
| Veto LLD | 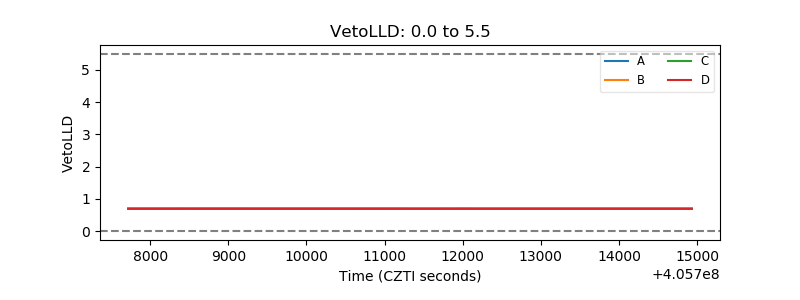 |
| Alpha Counter | 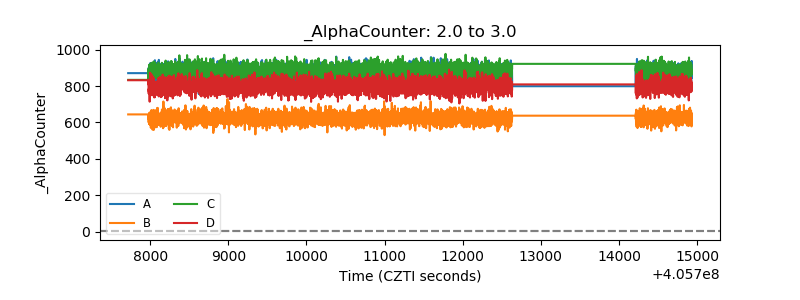 |
| _CPM_Rate | 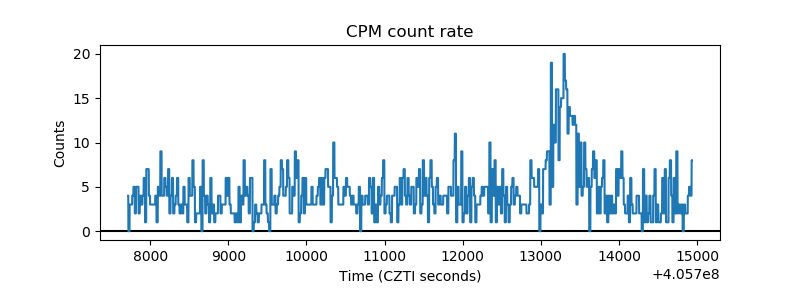 |
| CZT Counter | 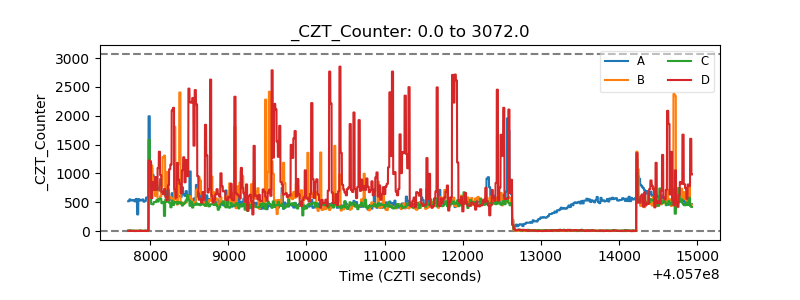 |
| +2.5 Volts monitor | 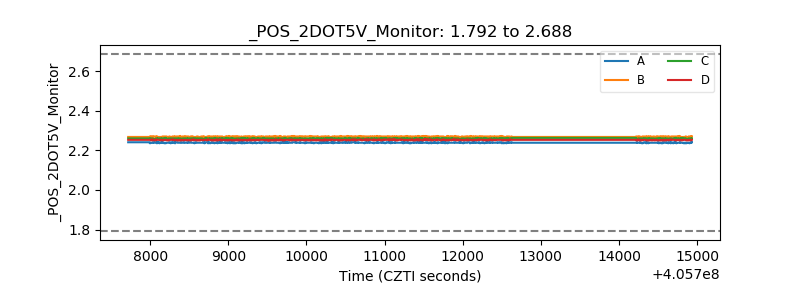 |
| +5 Volts monitor | 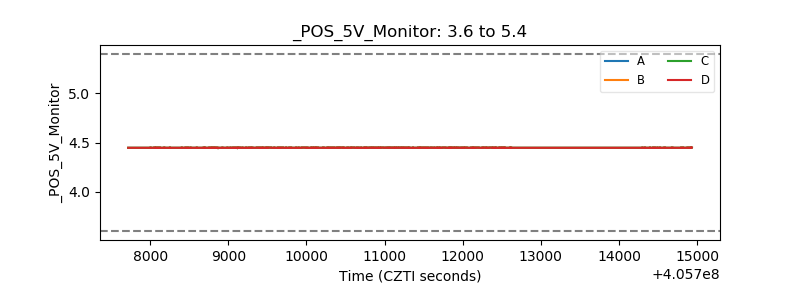 |
| _ROLL_ROT | 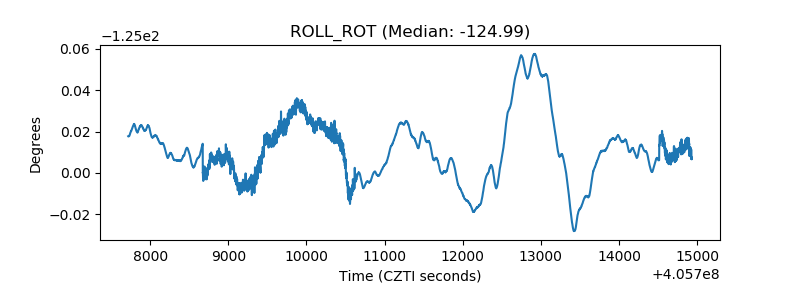 |
| _Roll_DEC | 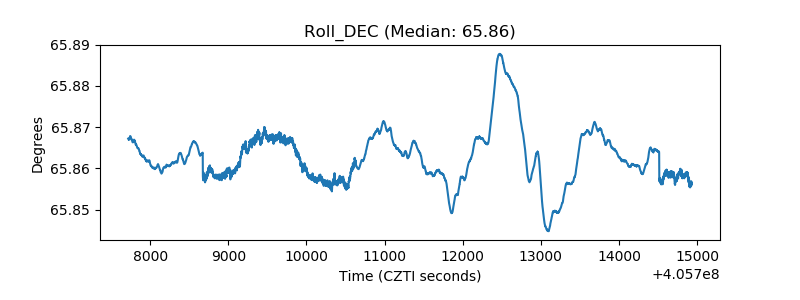 |
| _Roll_RA | 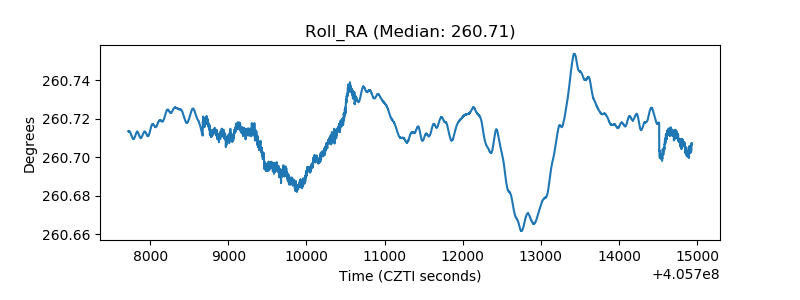 |
| Veto Counter | 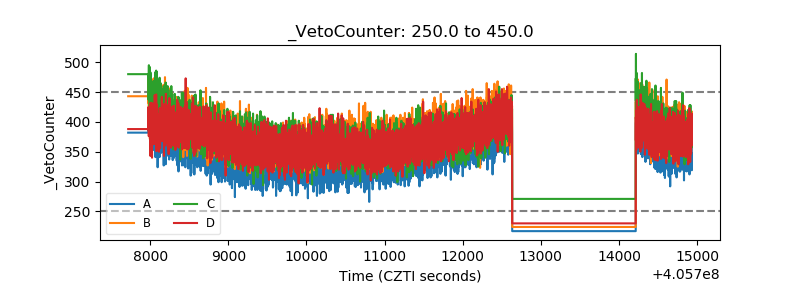 |