| Param | Original file | Final file |
|---|---|---|
| Filename | modeM0/AS1A12_018T01_9000005386_38481cztM0_level2.fits | modeM0/AS1A12_018T01_9000005386_38481cztM0_level2_quad_clean.evt |
| Size (bytes) | 410,451,840 | 93,168,000 |
| Size | 391.4 MB | 88.9 MB |
| Events in quadrant A | 3,041,402 | 645,162 |
| Events in quadrant B | 3,491,504 | 637,226 |
| Events in quadrant C | 2,725,314 | 627,139 |
| Events in quadrant D | 5,485,585 | 507,057 |
| Mode SS | |||
|---|---|---|---|
| Quadrant | BADHDUFLAG | Total packets | Discarded packets |
| A | 0 | 120 | 0 |
| B | 0 | 120 | 0 |
| C | 0 | 120 | 0 |
| D | 0 | 120 | 0 |
| Mode M9 | |||
|---|---|---|---|
| Quadrant | BADHDUFLAG | Total packets | Discarded packets |
| A | 0 | 23 | 0 |
| B | 0 | 23 | 0 |
| C | 0 | 23 | 0 |
| D | 0 | 24 | 0 |
| Mode M0 | |||
|---|---|---|---|
| Quadrant | BADHDUFLAG | Total packets | Discarded packets |
| A | 0 | 12702 | 3 |
| B | 0 | 14242 | 2 |
| C | 0 | 11733 | 2 |
| D | 0 | 20180 | 2 |
| Quadrant | Total seconds | Saturated seconds | Saturation percentage |
|---|---|---|---|
| A | 5779 | 21 | 0.363385% |
| B | 5779 | 202 | 3.495414% |
| C | 5779 | 11 | 0.190344% |
| D | 5779 | 870 | 15.054508% |
Noise dominated data is calculated using 1-second bins in cleaned event files. If a bin has >2000 counts, and if more than 50% of those come from <1% of pixels, then it is considered to be noise-dominated and hence unusable.
| Quadrant | # 1 sec bins | Bins with >0 counts | Bins with >2000 counts | High rate bins dominated by noise | Noise dominated (total time) | Noise dominated (detector-on time) | Marked lightcurve |
|---|---|---|---|---|---|---|---|
| A | 7121 | 5780 | 7 | 7 | 0.10% | 0.12% | 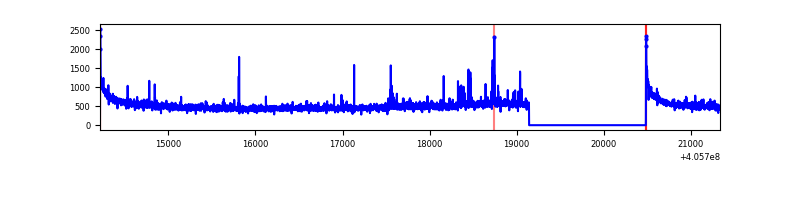 |
| B | 7121 | 5779 | 174 | 174 | 2.44% | 3.01% | 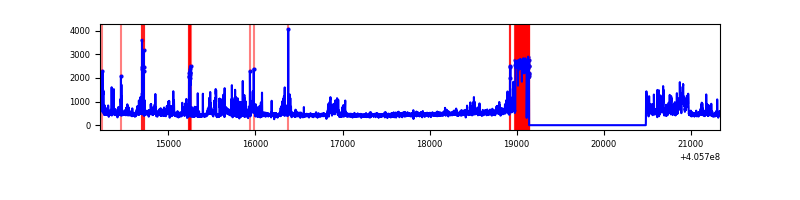 |
| C | 7121 | 5780 | 6 | 6 | 0.08% | 0.10% | 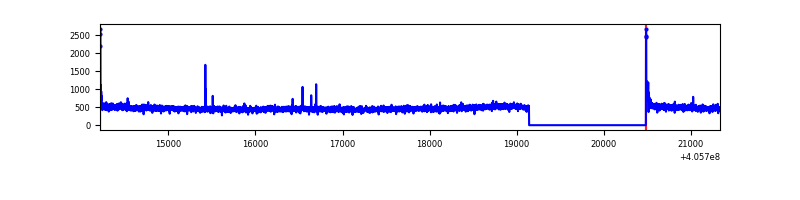 |
| D | 7121 | 5780 | 828 | 828 | 11.63% | 14.33% | 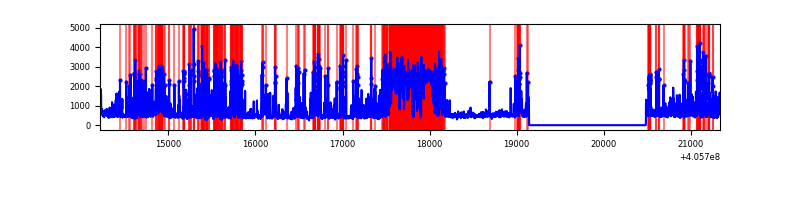 |
Top three noisy pixels from each quadrant. If the there are fewer than three noisy pixels in the level2.evt file, extra rows are filled as -1
| Pixel properties | Quadrant properties | ||||||
|---|---|---|---|---|---|---|---|
| Quadrant | DetID | PixID | Counts | Sigma | Mean | Median | Sigma |
| A | 10 | 83 | 411237 | 3145.0 | 639 | 625 | 130.6 |
| A | 15 | 222 | 48977 | 370.34 | 639 | 625 | 130.6 |
| A | 12 | 189 | 31369 | 235.48 | 639 | 625 | 130.6 |
| B | 8 | 3 | 613236 | 5183.6 | 620 | 605 | 118.2 |
| B | 4 | 171 | 240104 | 2026.45 | 620 | 605 | 118.2 |
| B | 0 | 183 | 82343 | 691.6 | 620 | 605 | 118.2 |
| C | 15 | 214 | 240768 | 1635.74 | 625 | 626 | 146.8 |
| C | 0 | 10 | 38469 | 257.77 | 625 | 626 | 146.8 |
| C | 14 | 254 | 8598 | 54.3 | 625 | 626 | 146.8 |
| D | 2 | 250 | 1904031 | 13509.1 | 578 | 561 | 140.9 |
| D | 7 | 223 | 626849 | 4444.82 | 578 | 561 | 140.9 |
| D | 13 | 249 | 204956 | 1450.61 | 578 | 561 | 140.9 |
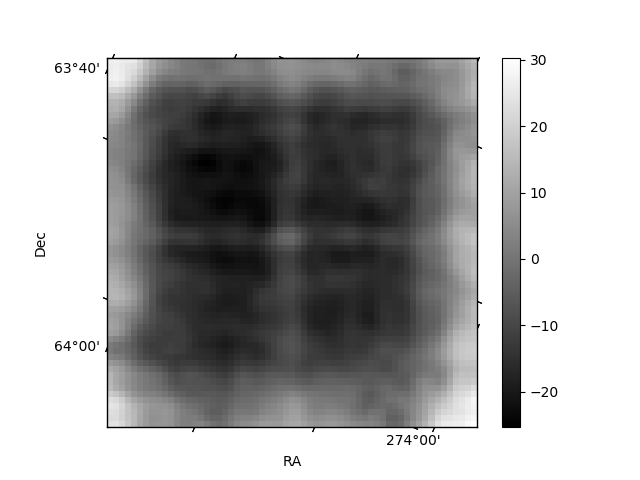
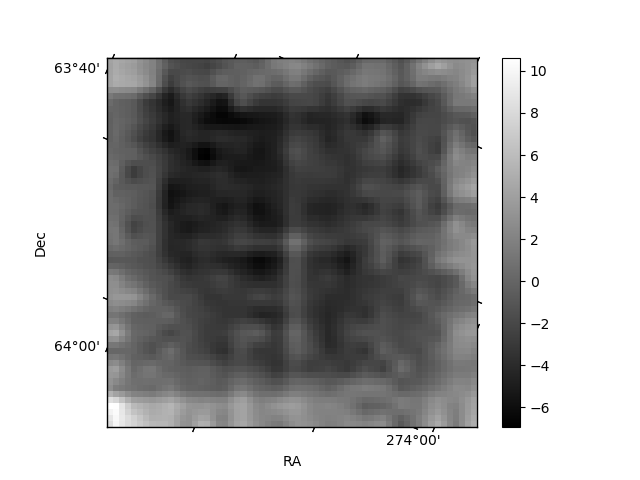
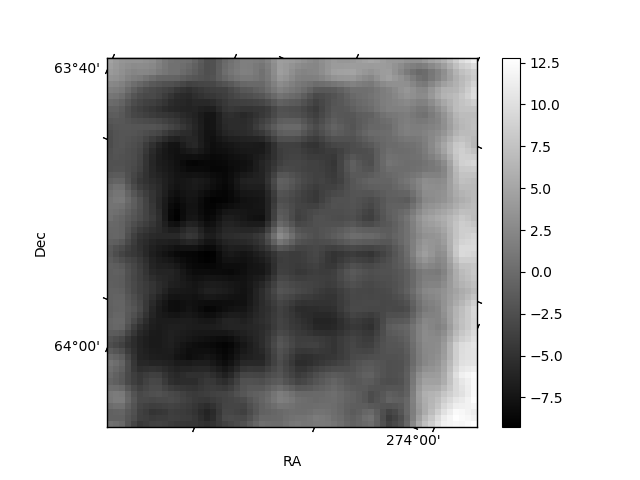
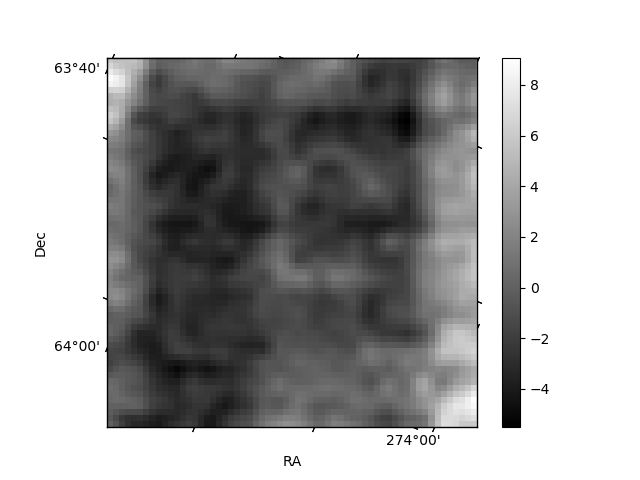
Histogram calculated using DETX and DETY for each event in the final _common_clean file
| Quadrant A | 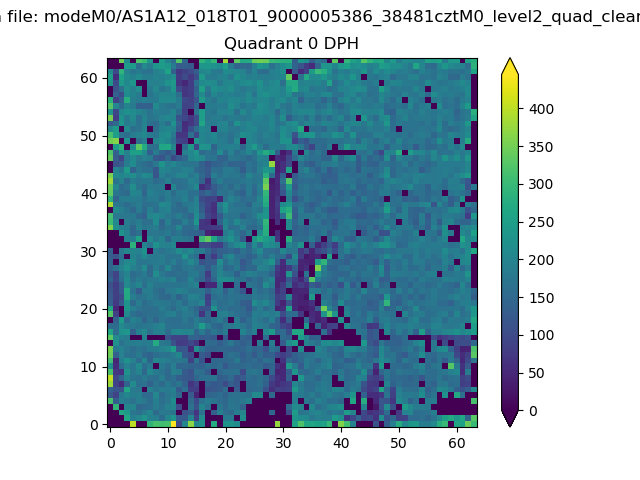 |
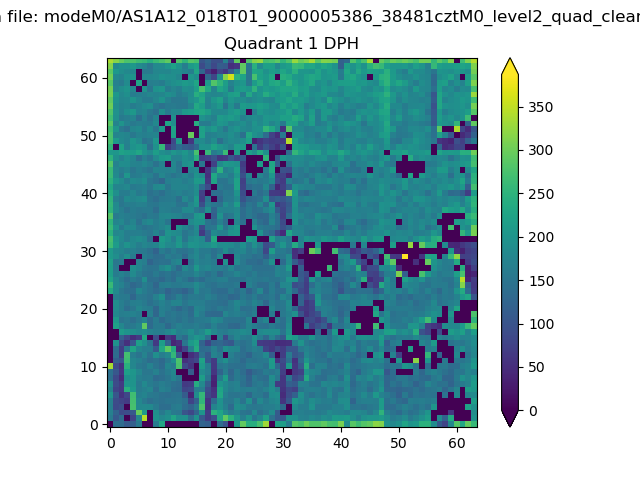 |
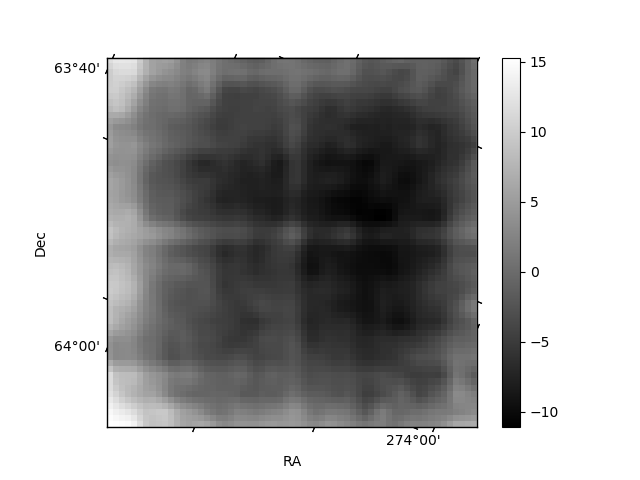
Quadrant B |
|---|---|---|---|
| Quadrant D | 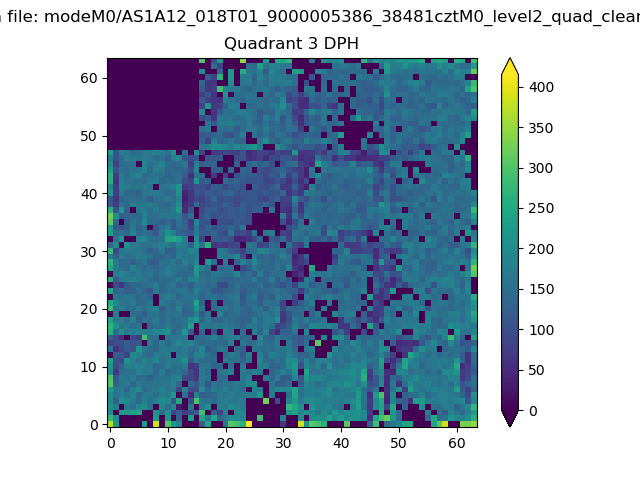 |
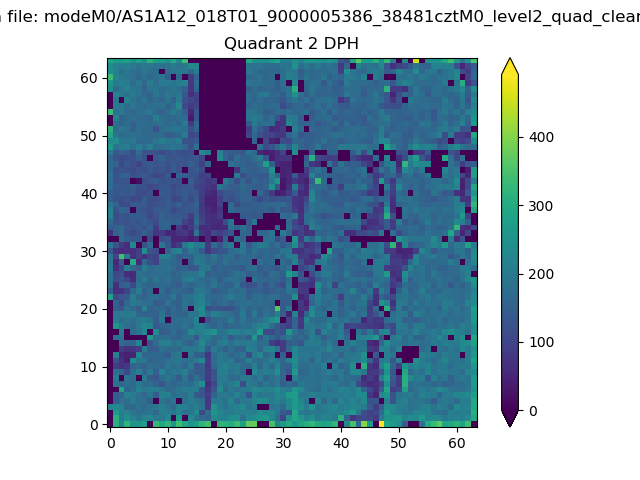 |
Quadrant C |
| Plot type | Count rate plots | Images |
|---|---|---|
| Comparison with Poisson distribution Blue bars denote a histogram of data divided into 1 sec bins. Red curve is a Poisson curve with rate = median count rate of data. |
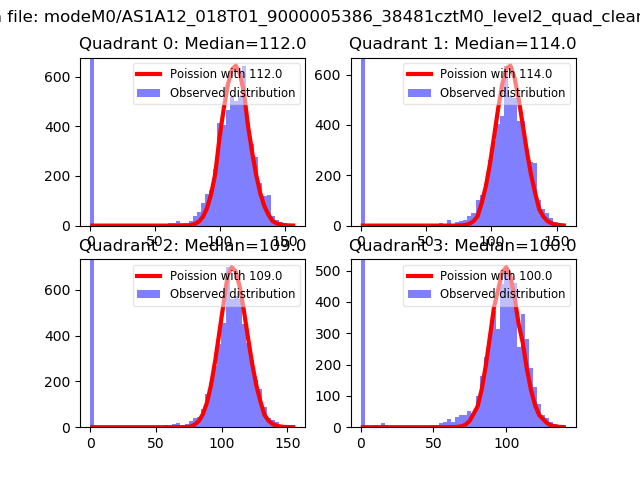 |
 |
| Quadrant-wise count rates Data is divided into 100 sec bins |
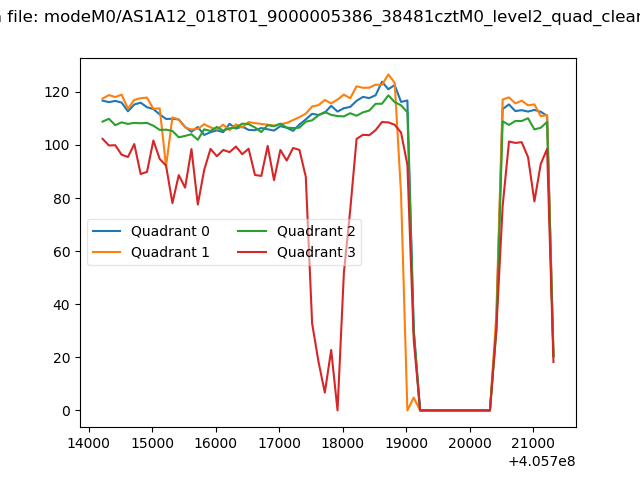 |
|
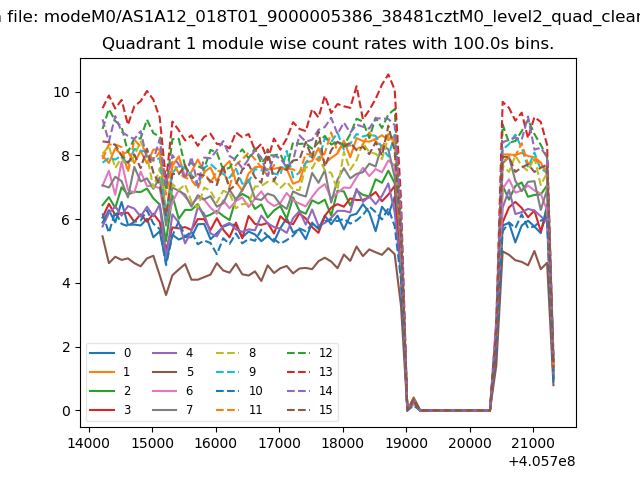
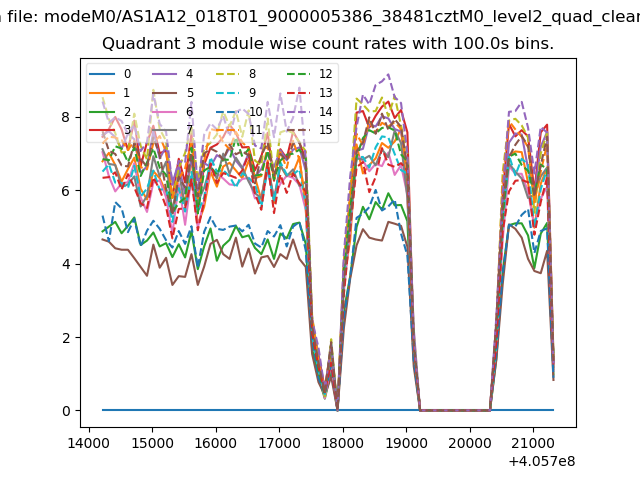
| Module-wise count rates for Quadrant A Data is divided into 100 sec bins |
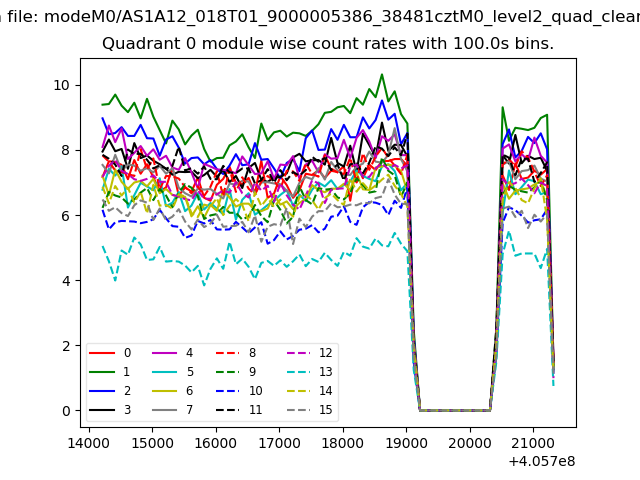 |
 |
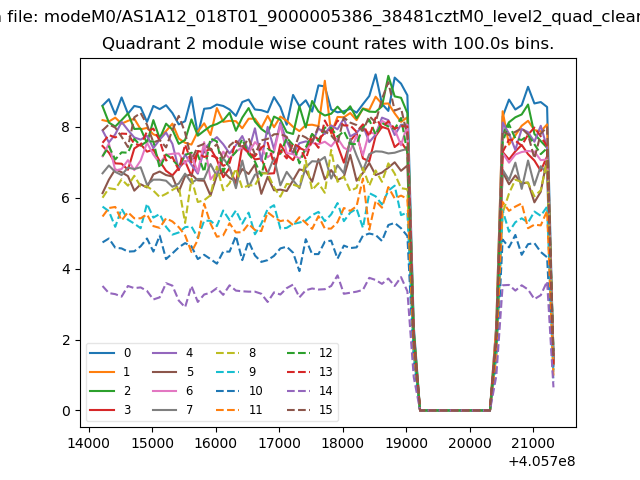
| Module-wise count rates for Quadrant B Data is divided into 100 sec bins |
 |
 |
| Module-wise count rates for Quadrant C Data is divided into 100 sec bins |
 |
 |
| Module-wise count rates for Quadrant D Data is divided into 100 sec bins |
 |
 |
| Parameter | Plot |
|---|---|
| CZT HV Monitor |  |
| D_VDD | 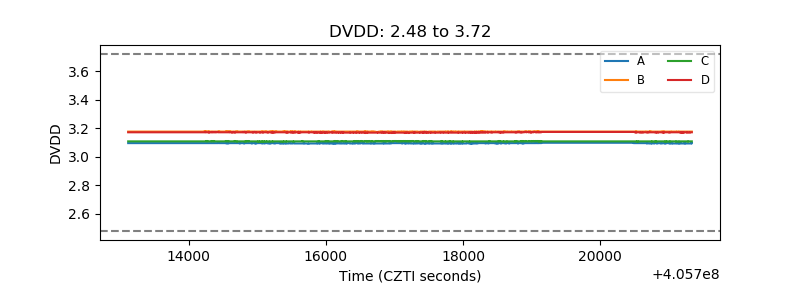 |
| Temperature 1 | 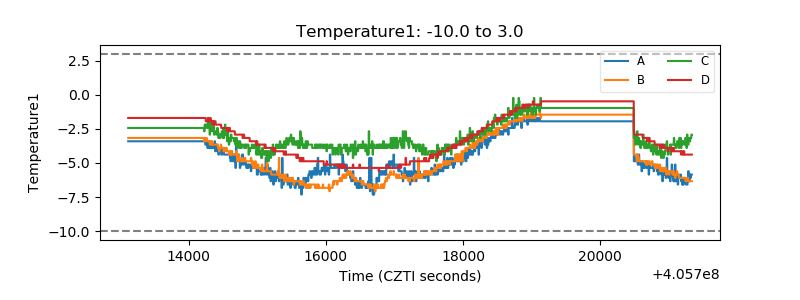 |
| Veto HV Monitor | 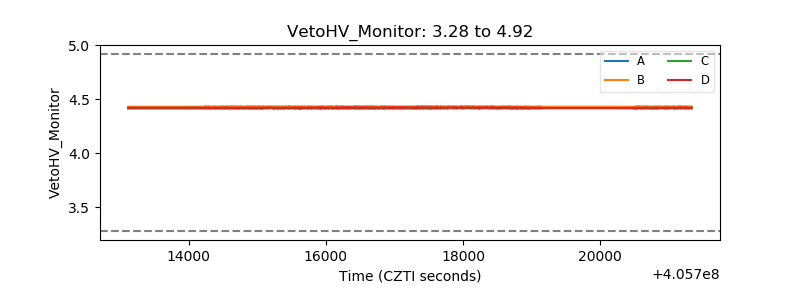 |
| Veto LLD | 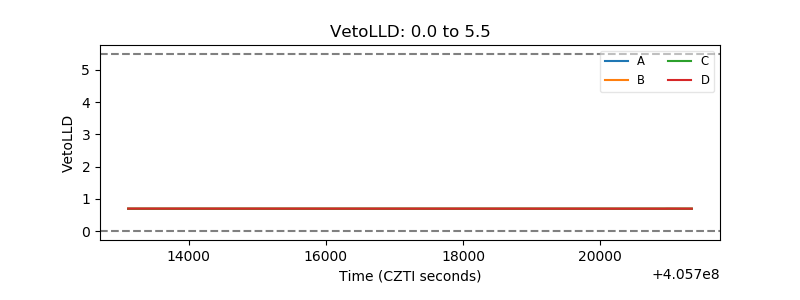 |
| Alpha Counter | 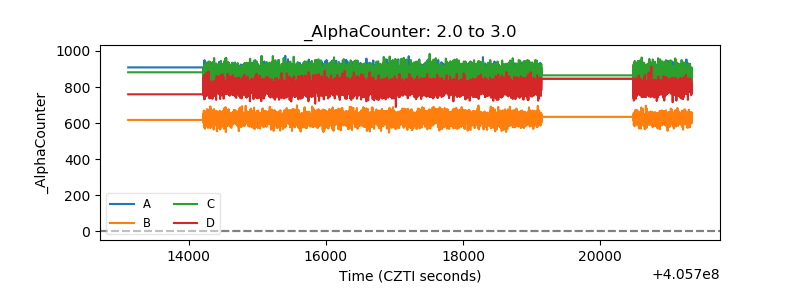 |
| _CPM_Rate | 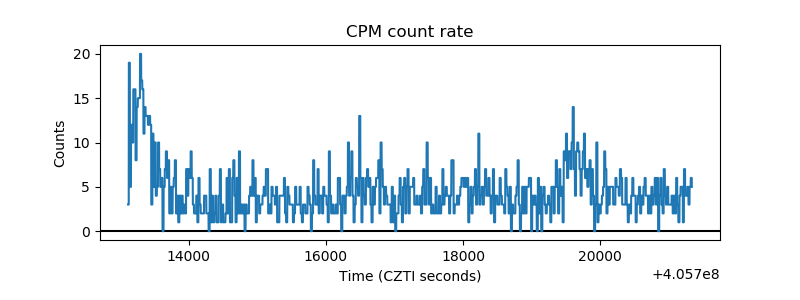 |
| CZT Counter | 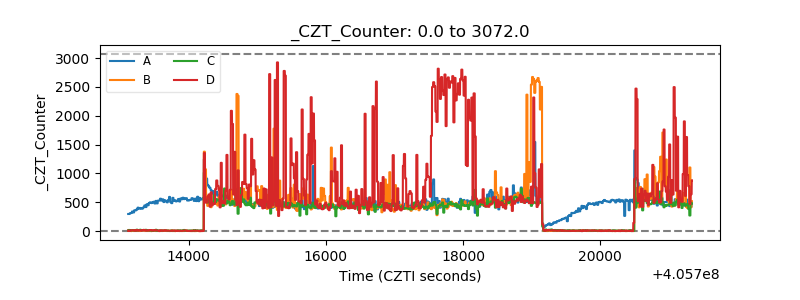 |
| +2.5 Volts monitor | 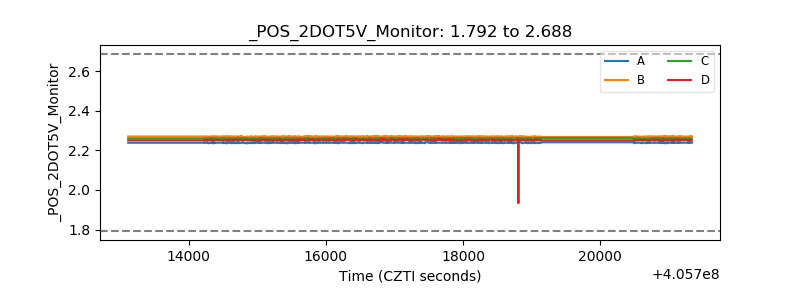 |
| +5 Volts monitor | 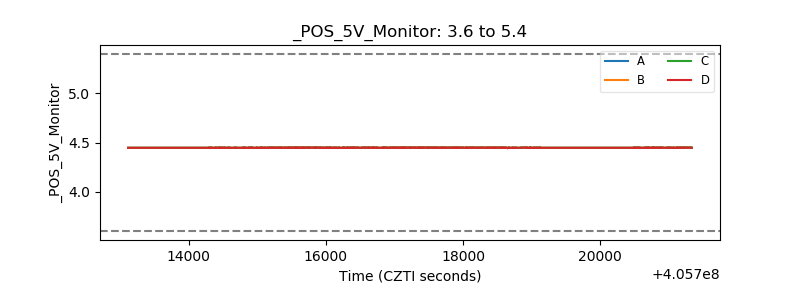 |
| _ROLL_ROT | 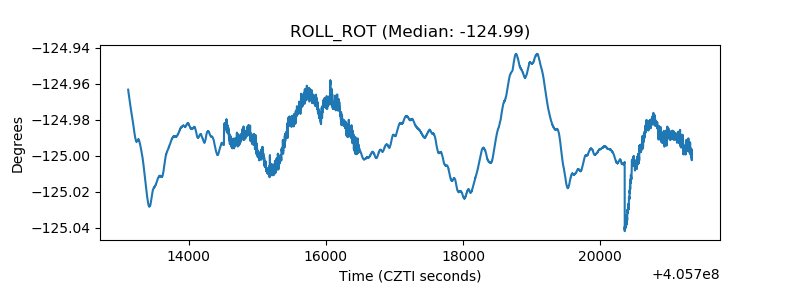 |
| _Roll_DEC | 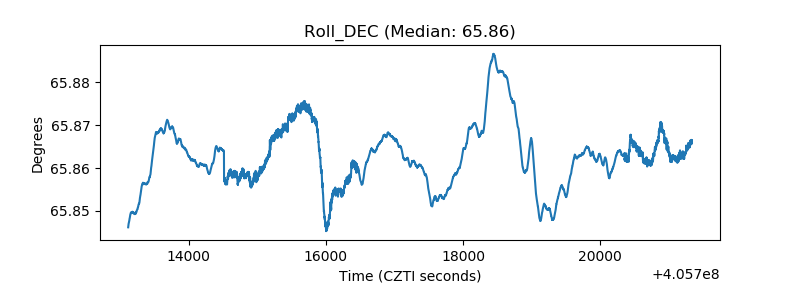 |
| _Roll_RA | 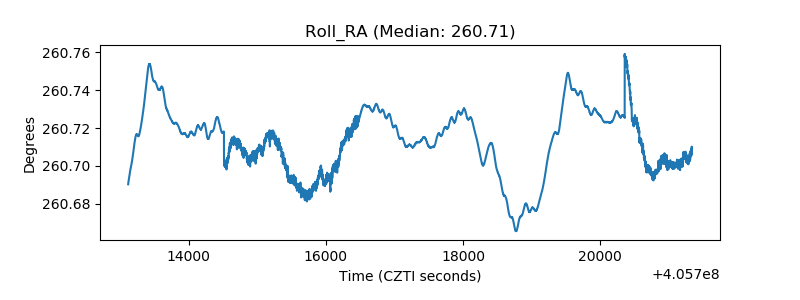 |
| Veto Counter | 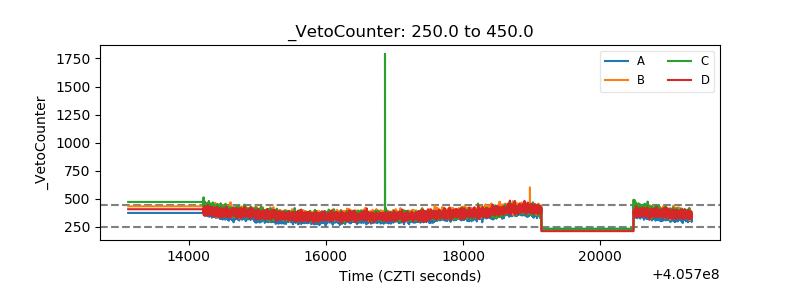 |