| Param | Original file | Final file |
|---|---|---|
| Filename | modeM0/AS1A12_018T01_9000005386_38482cztM0_level2.fits | modeM0/AS1A12_018T01_9000005386_38482cztM0_level2_quad_clean.evt |
| Size (bytes) | 404,331,840 | 98,340,480 |
| Size | 385.6 MB | 93.8 MB |
| Events in quadrant A | 3,112,838 | 668,019 |
| Events in quadrant B | 3,998,834 | 652,932 |
| Events in quadrant C | 2,853,510 | 652,500 |
| Events in quadrant D | 4,534,007 | 584,074 |
| Mode SS | |||
|---|---|---|---|
| Quadrant | BADHDUFLAG | Total packets | Discarded packets |
| A | 0 | 122 | 0 |
| B | 0 | 122 | 0 |
| C | 0 | 122 | 0 |
| D | 0 | 122 | 0 |
| Mode M9 | |||
|---|---|---|---|
| Quadrant | BADHDUFLAG | Total packets | Discarded packets |
| A | 0 | 24 | 0 |
| B | 0 | 24 | 0 |
| C | 0 | 24 | 0 |
| D | 0 | 25 | 0 |
| Mode M0 | |||
|---|---|---|---|
| Quadrant | BADHDUFLAG | Total packets | Discarded packets |
| A | 0 | 12956 | 3 |
| B | 0 | 16022 | 2 |
| C | 0 | 12262 | 2 |
| D | 0 | 17659 | 2 |
| Quadrant | Total seconds | Saturated seconds | Saturation percentage |
|---|---|---|---|
| A | 6015 | 15 | 0.249377% |
| B | 6015 | 299 | 4.970906% |
| C | 6015 | 12 | 0.199501% |
| D | 6015 | 317 | 5.270158% |
Noise dominated data is calculated using 1-second bins in cleaned event files. If a bin has >2000 counts, and if more than 50% of those come from <1% of pixels, then it is considered to be noise-dominated and hence unusable.
| Quadrant | # 1 sec bins | Bins with >0 counts | Bins with >2000 counts | High rate bins dominated by noise | Noise dominated (total time) | Noise dominated (detector-on time) | Marked lightcurve |
|---|---|---|---|---|---|---|---|
| A | 7298 | 6016 | 8 | 8 | 0.11% | 0.13% | 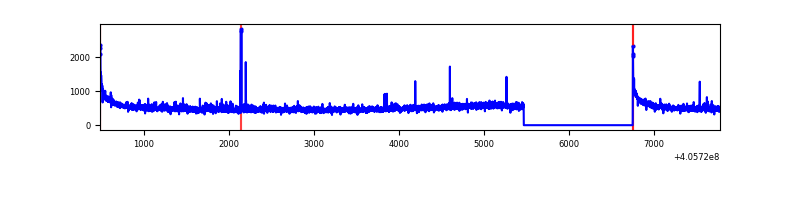 |
| B | 7298 | 6016 | 234 | 234 | 3.21% | 3.89% | 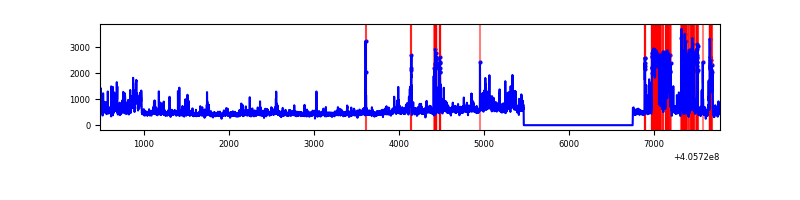 |
| C | 7298 | 6016 | 6 | 6 | 0.08% | 0.10% | 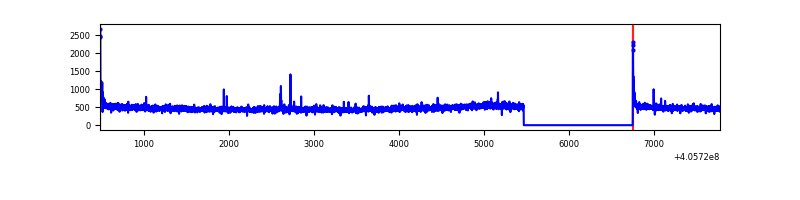 |
| D | 7298 | 6016 | 306 | 306 | 4.19% | 5.09% | 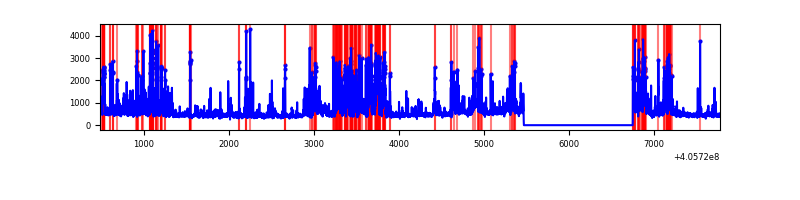 |
Top three noisy pixels from each quadrant. If the there are fewer than three noisy pixels in the level2.evt file, extra rows are filled as -1
| Pixel properties | Quadrant properties | ||||||
|---|---|---|---|---|---|---|---|
| Quadrant | DetID | PixID | Counts | Sigma | Mean | Median | Sigma |
| A | 10 | 83 | 427765 | 3166.49 | 665 | 652 | 134.9 |
| A | 12 | 189 | 48106 | 351.81 | 665 | 652 | 134.9 |
| A | 13 | 6 | 24138 | 174.12 | 665 | 652 | 134.9 |
| B | 8 | 3 | 627914 | 5019.4 | 649 | 631 | 125.0 |
| B | 4 | 171 | 495590 | 3960.57 | 649 | 631 | 125.0 |
| B | 5 | 184 | 167010 | 1331.33 | 649 | 631 | 125.0 |
| C | 15 | 214 | 251680 | 1641.04 | 653 | 655 | 153.0 |
| C | 0 | 10 | 41059 | 264.14 | 653 | 655 | 153.0 |
| C | 14 | 254 | 10664 | 65.43 | 653 | 655 | 153.0 |
| D | 2 | 250 | 735563 | 4770.21 | 640 | 624 | 154.1 |
| D | 12 | 227 | 416087 | 2696.61 | 640 | 624 | 154.1 |
| D | 7 | 223 | 342347 | 2217.99 | 640 | 624 | 154.1 |
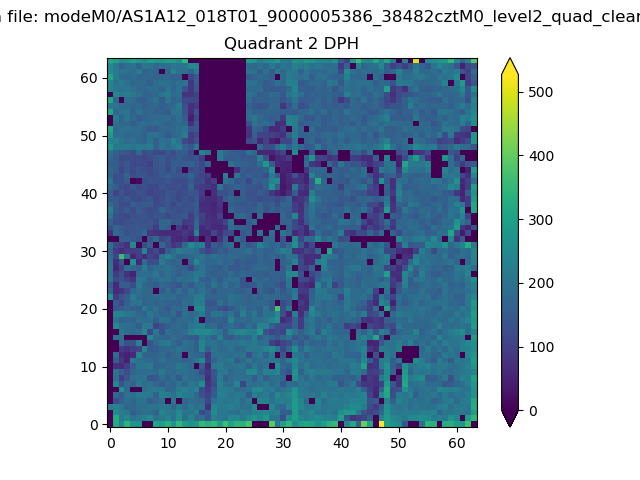
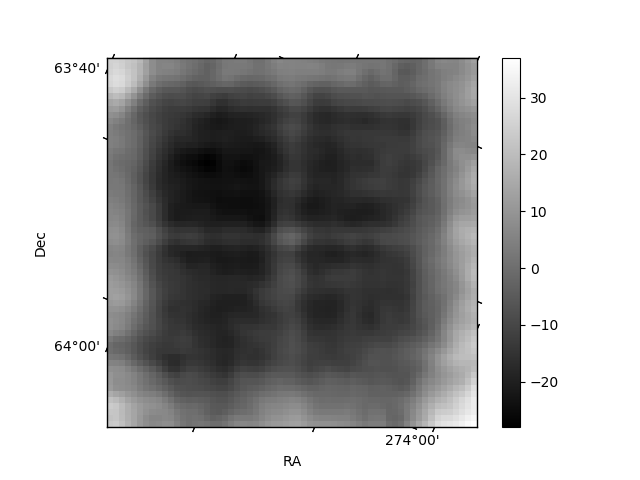
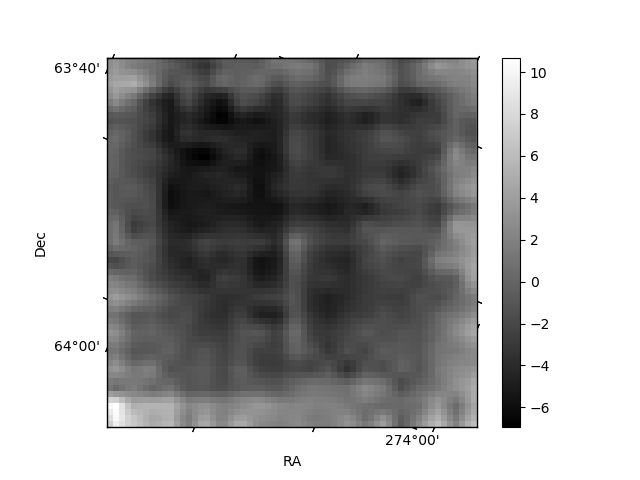
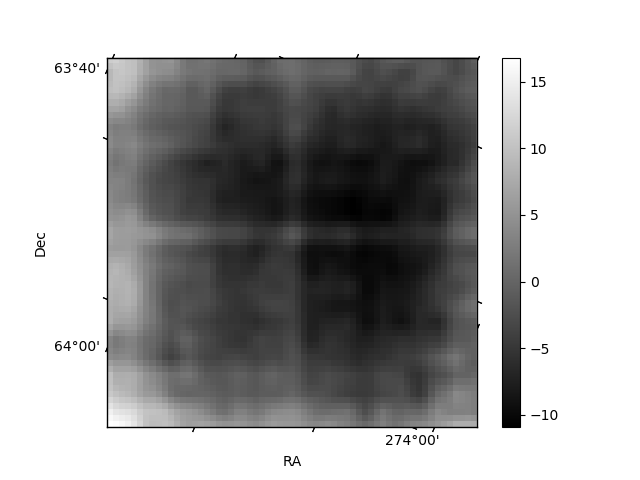
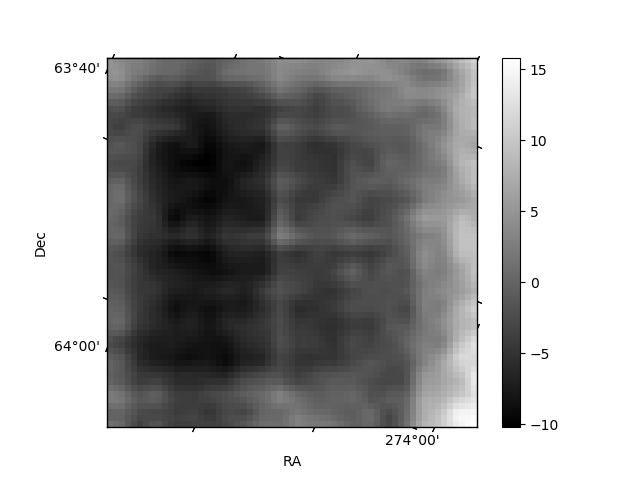
Histogram calculated using DETX and DETY for each event in the final _common_clean file
| Quadrant A | 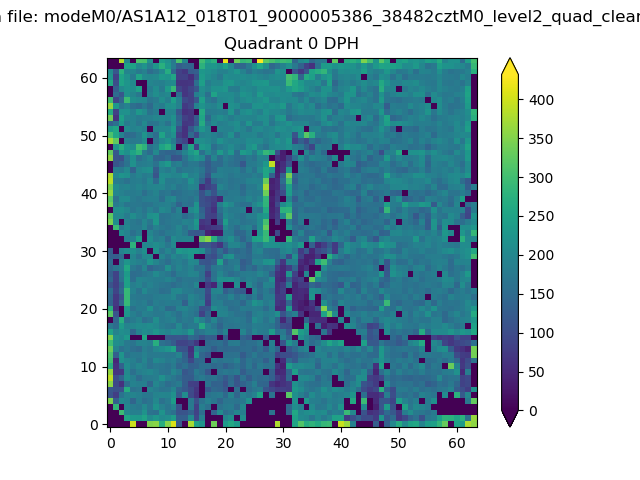 |
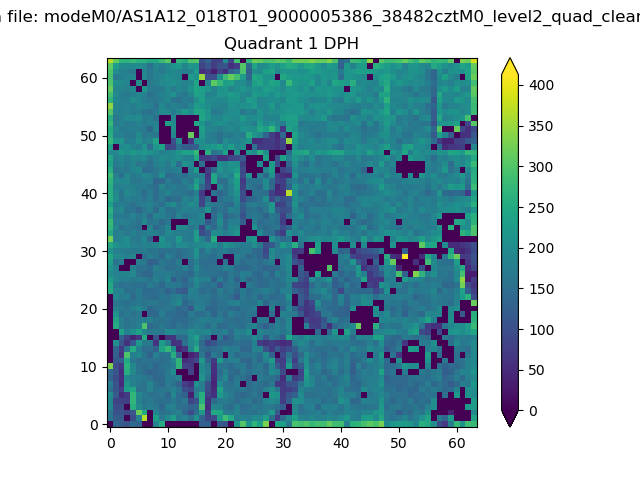 |
Quadrant B |
|---|---|---|---|
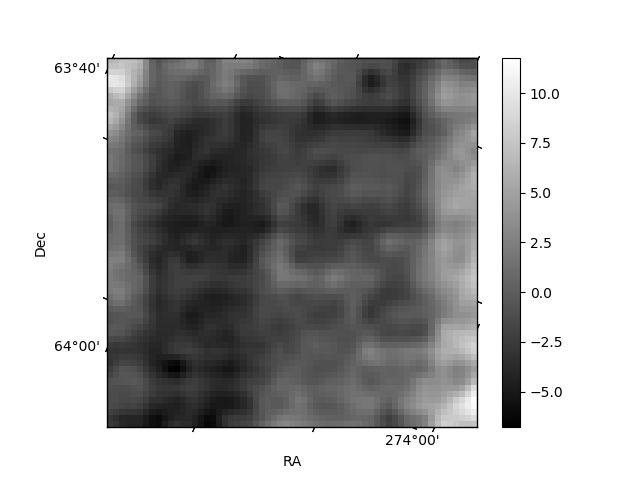
| Quadrant D | 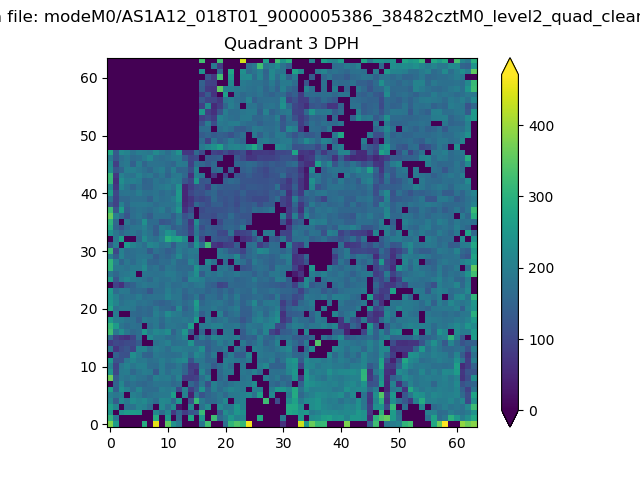 |
 |
Quadrant C |
| Plot type | Count rate plots | Images |
|---|---|---|
| Comparison with Poisson distribution Blue bars denote a histogram of data divided into 1 sec bins. Red curve is a Poisson curve with rate = median count rate of data. |
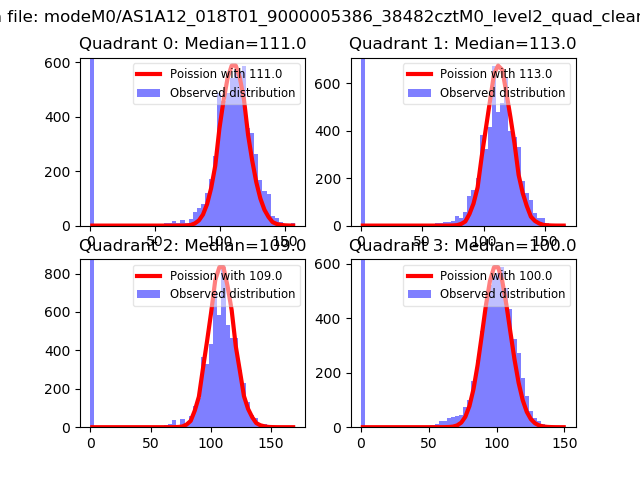 |
 |
| Quadrant-wise count rates Data is divided into 100 sec bins |
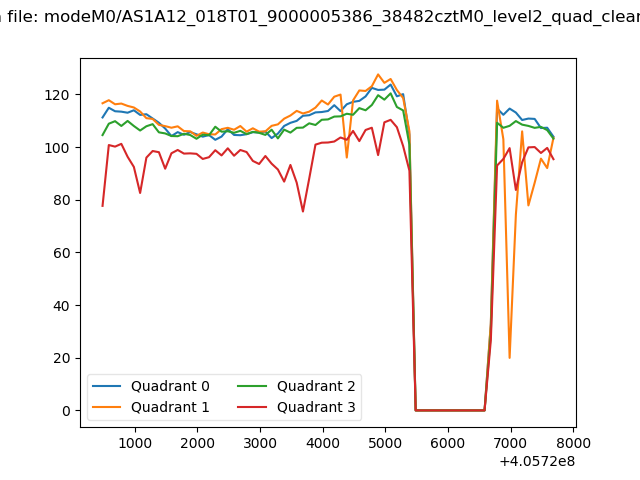 |
|
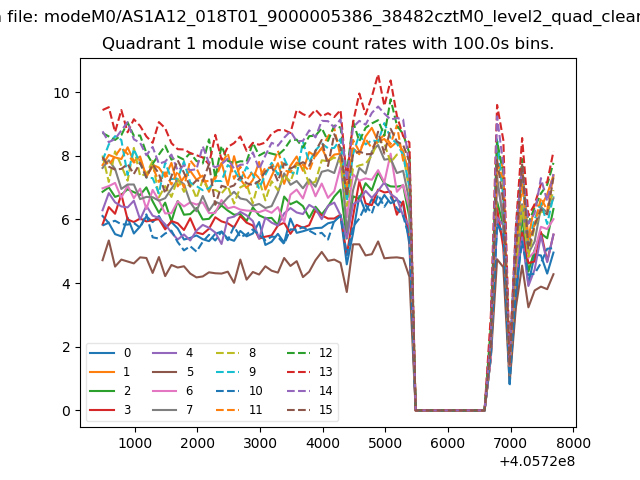
| Module-wise count rates for Quadrant A Data is divided into 100 sec bins |
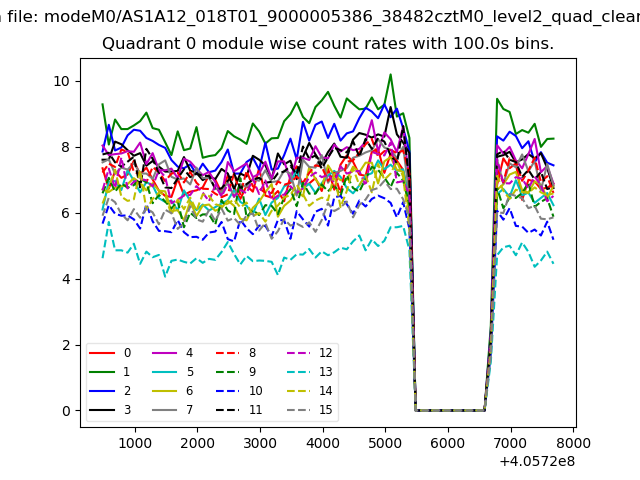 |
 |
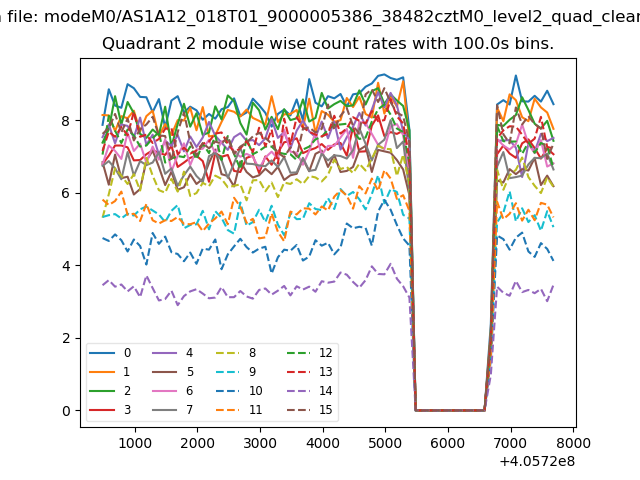
| Module-wise count rates for Quadrant B Data is divided into 100 sec bins |
 |
 |
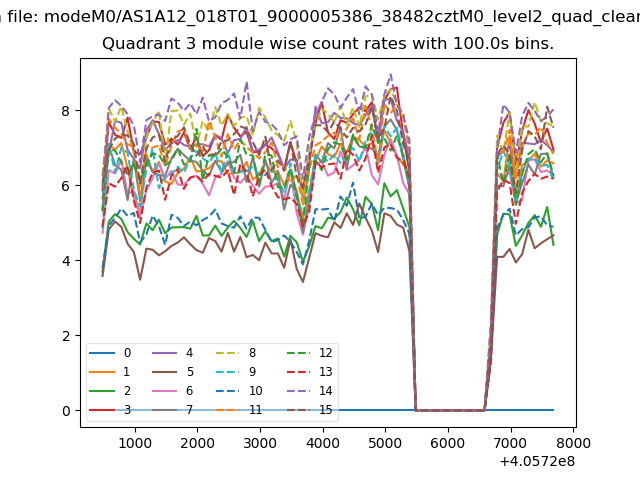
| Module-wise count rates for Quadrant C Data is divided into 100 sec bins |
 |
 |
| Module-wise count rates for Quadrant D Data is divided into 100 sec bins |
 |
 |
| Parameter | Plot |
|---|---|
| CZT HV Monitor | 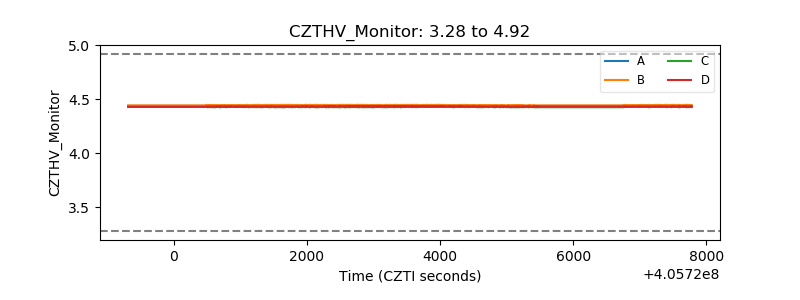 |
| D_VDD | 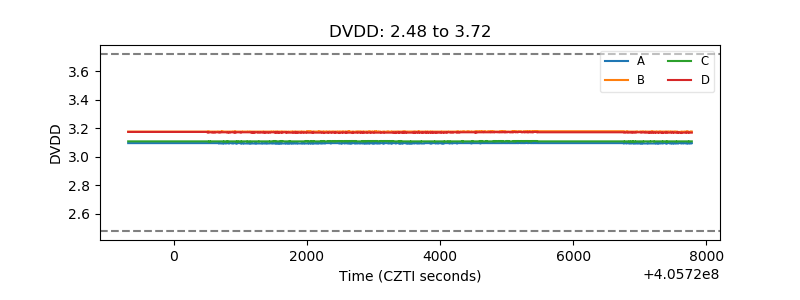 |
| Temperature 1 | 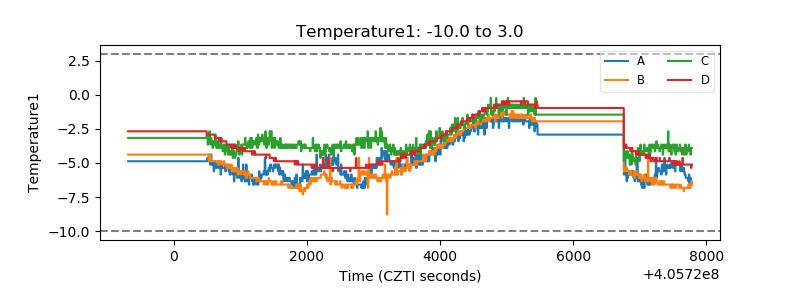 |
| Veto HV Monitor | 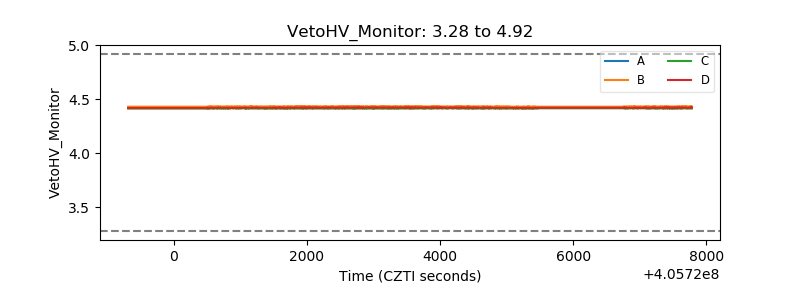 |
| Veto LLD | 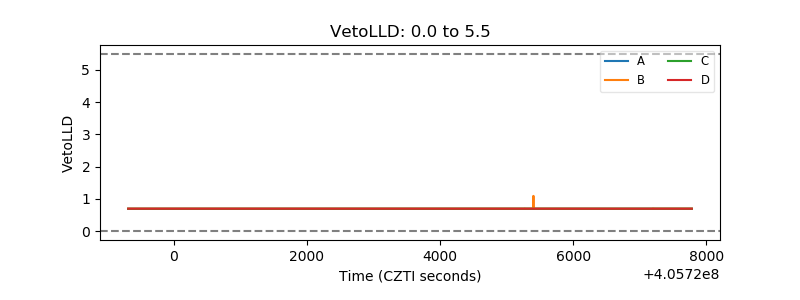 |
| Alpha Counter | 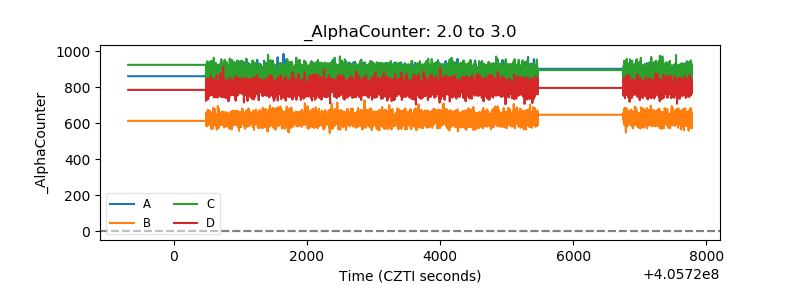 |
| _CPM_Rate | 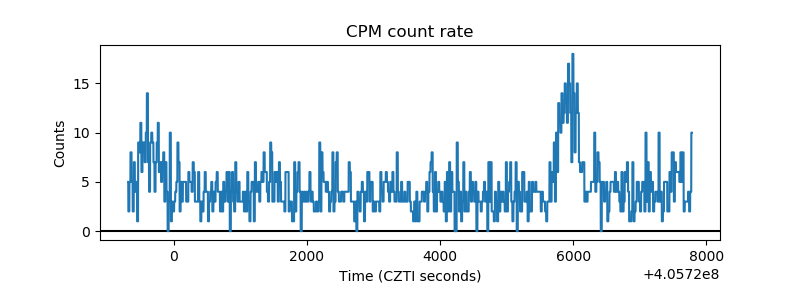 |
| CZT Counter | 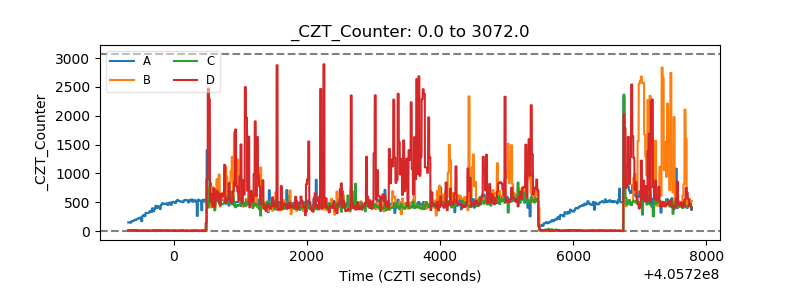 |
| +2.5 Volts monitor | 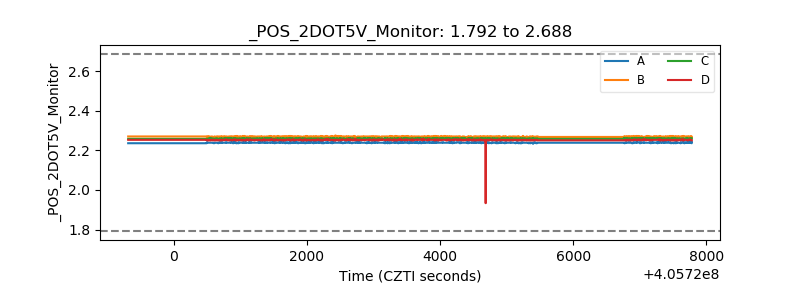 |
| +5 Volts monitor | 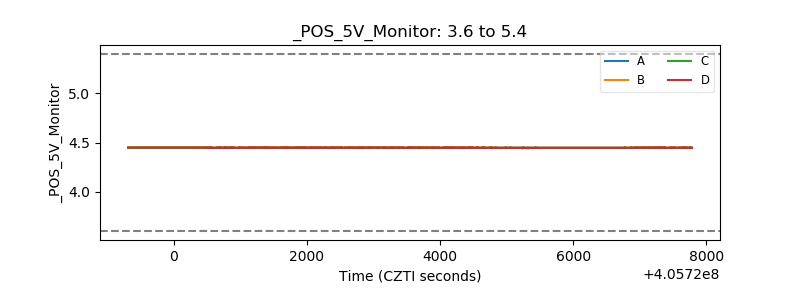 |
| _ROLL_ROT | 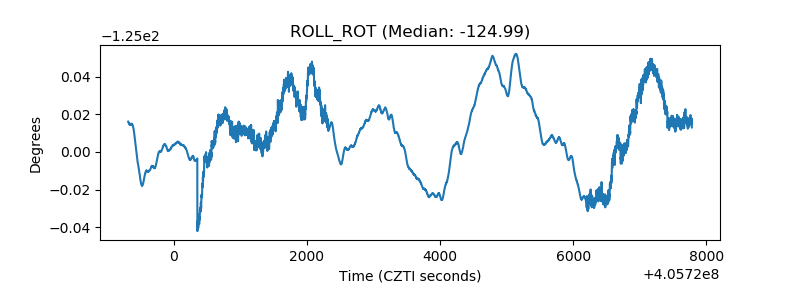 |
| _Roll_DEC | 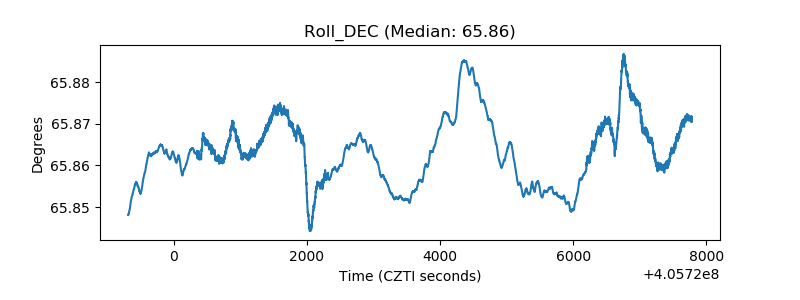 |
| _Roll_RA | 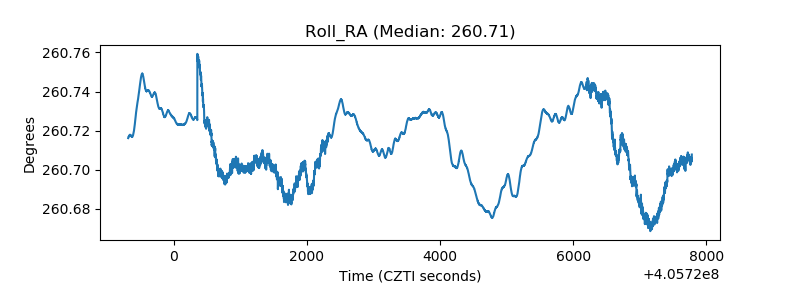 |
| Veto Counter | 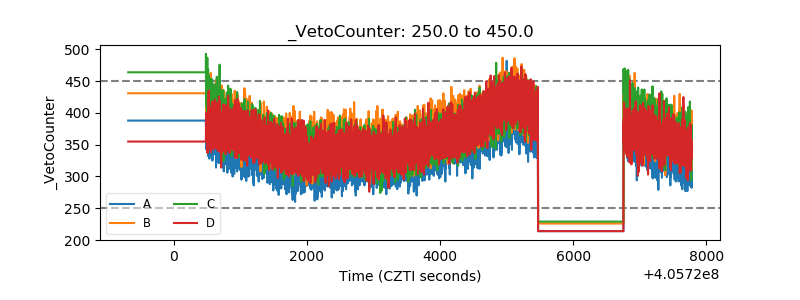 |