| Param | Original file | Final file |
|---|---|---|
| Filename | modeM0/AS1A12_018T01_9000005386_38484cztM0_level2.fits | modeM0/AS1A12_018T01_9000005386_38484cztM0_level2_quad_clean.evt |
| Size (bytes) | 773,985,600 | 151,830,720 |
| Size | 738.1 MB | 144.8 MB |
| Events in quadrant A | 6,950,248 | 1,005,976 |
| Events in quadrant B | 6,048,327 | 1,052,053 |
| Events in quadrant C | 4,568,158 | 1,056,477 |
| Events in quadrant D | 10,324,931 | 804,528 |
| Mode SS | |||
|---|---|---|---|
| Quadrant | BADHDUFLAG | Total packets | Discarded packets |
| A | 0 | 196 | 0 |
| B | 0 | 196 | 0 |
| C | 0 | 196 | 0 |
| D | 0 | 196 | 0 |
| Mode M9 | |||
|---|---|---|---|
| Quadrant | BADHDUFLAG | Total packets | Discarded packets |
| A | 0 | 24 | 0 |
| B | 0 | 24 | 0 |
| C | 0 | 24 | 0 |
| D | 0 | 25 | 0 |
| Mode M0 | |||
|---|---|---|---|
| Quadrant | BADHDUFLAG | Total packets | Discarded packets |
| A | 0 | 26970 | 3 |
| B | 0 | 24770 | 2 |
| C | 0 | 19832 | 2 |
| D | 0 | 37381 | 2 |
| Quadrant | Total seconds | Saturated seconds | Saturation percentage |
|---|---|---|---|
| A | 9787 | 676 | 6.907122% |
| B | 9787 | 455 | 4.649024% |
| C | 9787 | 6 | 0.061306% |
| D | 9787 | 1892 | 19.331767% |
Noise dominated data is calculated using 1-second bins in cleaned event files. If a bin has >2000 counts, and if more than 50% of those come from <1% of pixels, then it is considered to be noise-dominated and hence unusable.
| Quadrant | # 1 sec bins | Bins with >0 counts | Bins with >2000 counts | High rate bins dominated by noise | Noise dominated (total time) | Noise dominated (detector-on time) | Marked lightcurve |
|---|---|---|---|---|---|---|---|
| A | 11099 | 9787 | 605 | 605 | 5.45% | 6.18% | 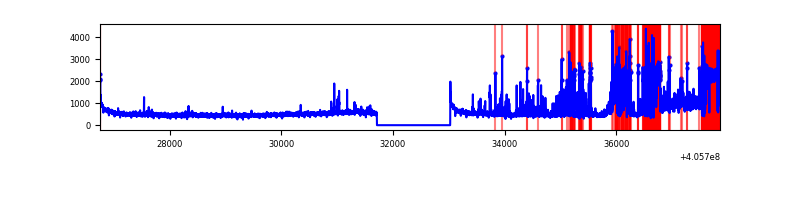 |
| B | 11100 | 9788 | 343 | 343 | 3.09% | 3.50% | 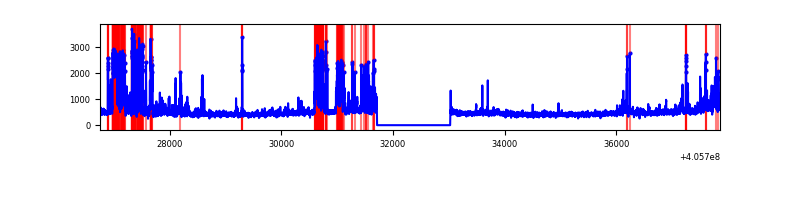 |
| C | 11100 | 9788 | 4 | 4 | 0.04% | 0.04% | 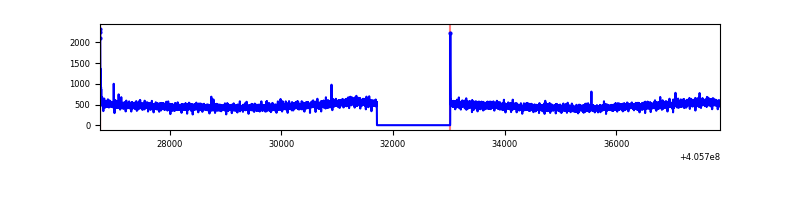 |
| D | 11100 | 9788 | 1837 | 1837 | 16.55% | 18.77% | 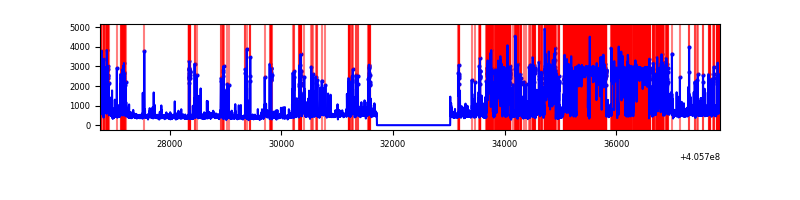 |
Top three noisy pixels from each quadrant. If the there are fewer than three noisy pixels in the level2.evt file, extra rows are filled as -1
| Pixel properties | Quadrant properties | ||||||
|---|---|---|---|---|---|---|---|
| Quadrant | DetID | PixID | Counts | Sigma | Mean | Median | Sigma |
| A | 15 | 222 | 2196596 | 10336.65 | 1048 | 1025 | 212.4 |
| A | 10 | 83 | 584446 | 2746.72 | 1048 | 1025 | 212.4 |
| A | 12 | 189 | 66854 | 309.92 | 1048 | 1025 | 212.4 |
| B | 8 | 3 | 650911 | 3177.57 | 1065 | 1035 | 204.5 |
| B | 5 | 184 | 559231 | 2729.3 | 1065 | 1035 | 204.5 |
| B | 4 | 171 | 500724 | 2443.23 | 1065 | 1035 | 204.5 |
| C | 15 | 214 | 400487 | 1613.16 | 1061 | 1066 | 247.6 |
| C | 0 | 10 | 23056 | 88.81 | 1061 | 1066 | 247.6 |
| C | 13 | 61 | 7218 | 24.85 | 1061 | 1066 | 247.6 |
| D | 12 | 227 | 4998839 | 21055.5 | 966 | 939 | 237.4 |
| D | 13 | 249 | 314085 | 1319.24 | 966 | 939 | 237.4 |
| D | 10 | 118 | 275365 | 1156.12 | 966 | 939 | 237.4 |
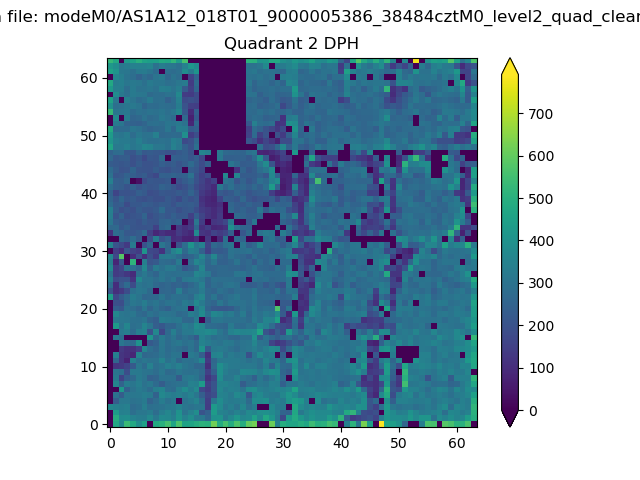
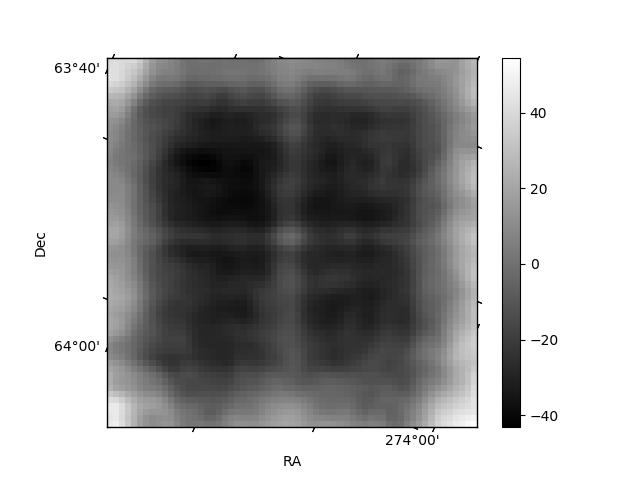
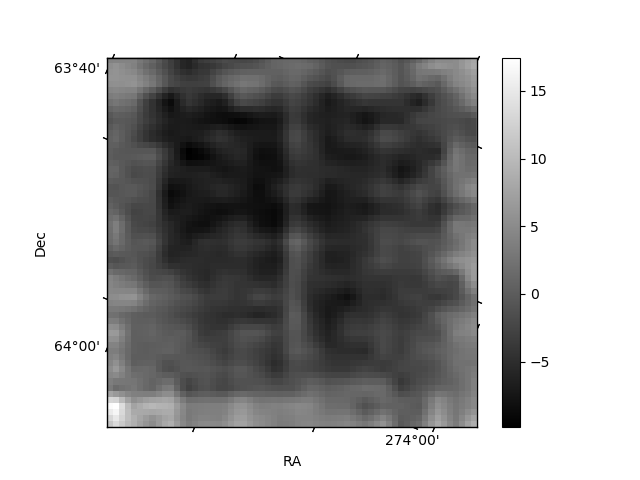
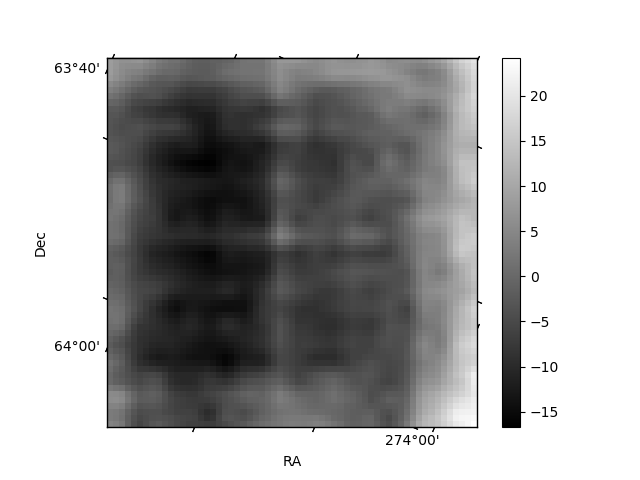
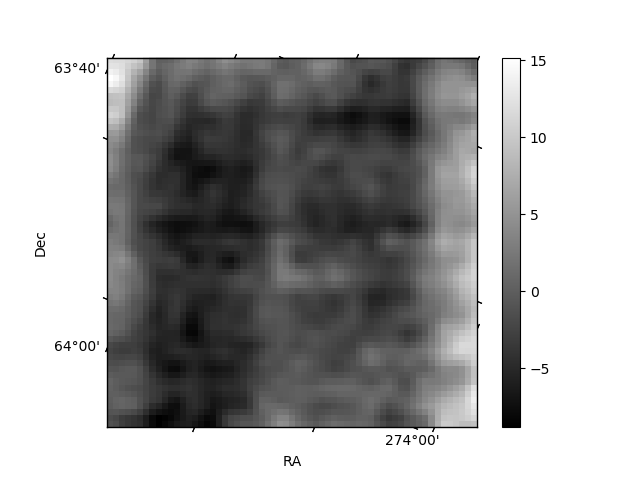
Histogram calculated using DETX and DETY for each event in the final _common_clean file
| Quadrant A | 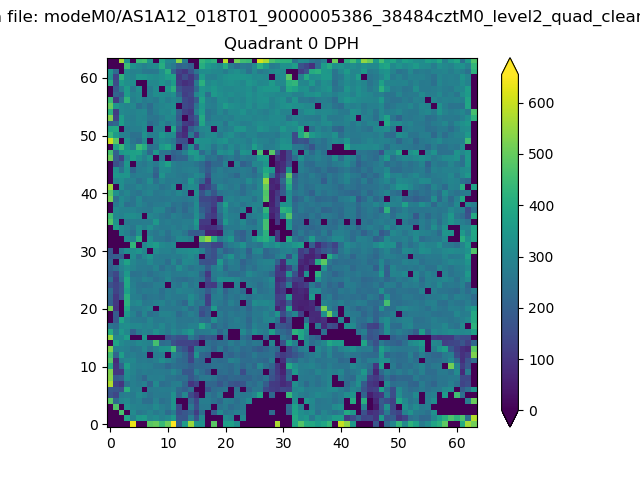 |
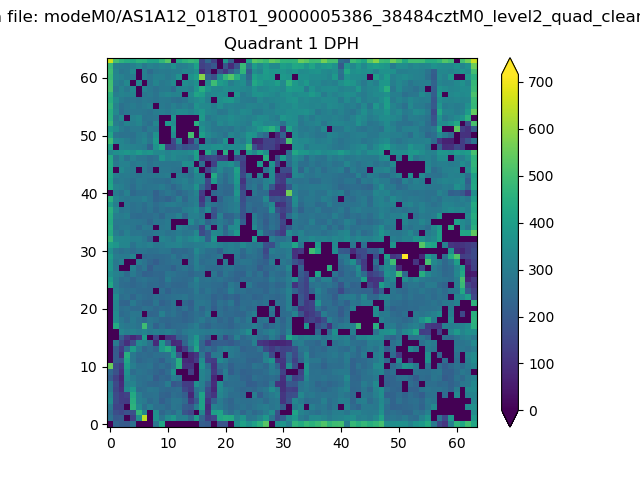 |
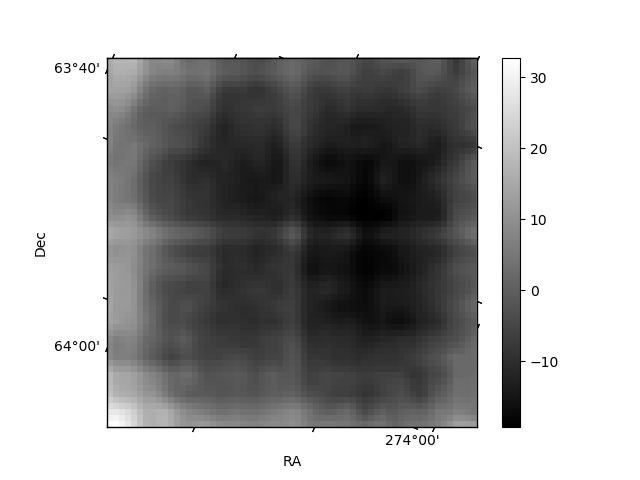
Quadrant B |
|---|---|---|---|
| Quadrant D | 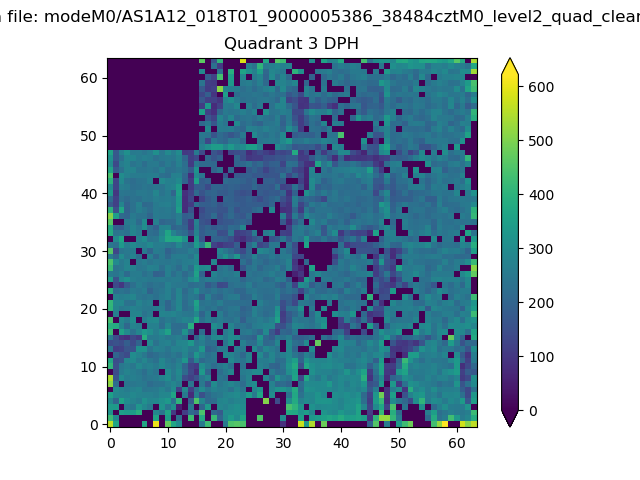 |
 |
Quadrant C |
| Plot type | Count rate plots | Images |
|---|---|---|
| Comparison with Poisson distribution Blue bars denote a histogram of data divided into 1 sec bins. Red curve is a Poisson curve with rate = median count rate of data. |
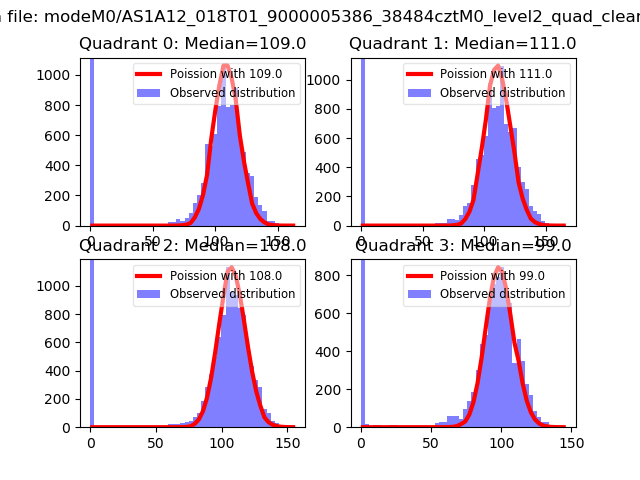 |
 |
| Quadrant-wise count rates Data is divided into 100 sec bins |
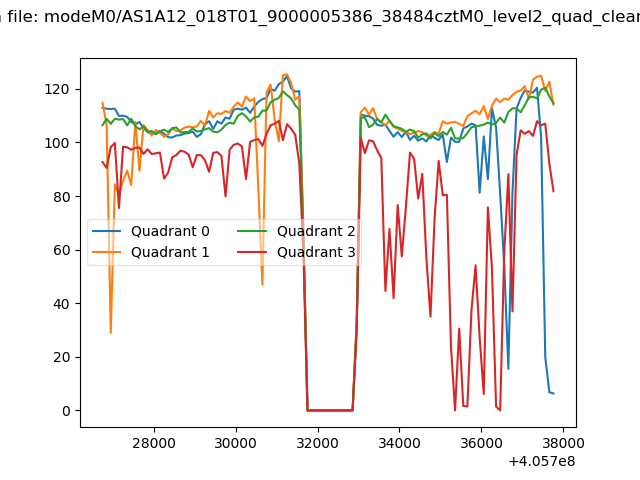 |
|
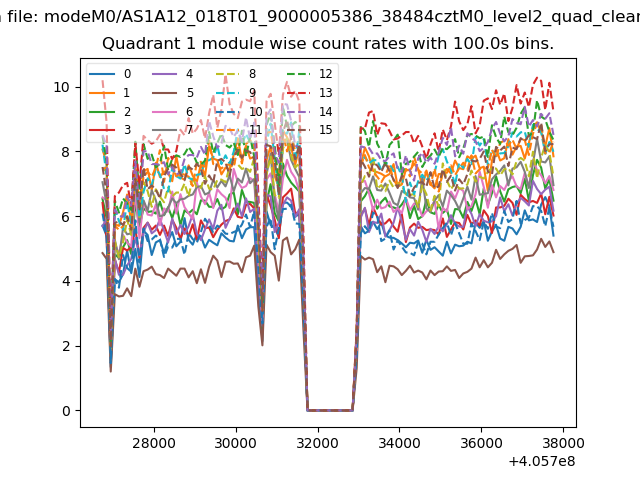
| Module-wise count rates for Quadrant A Data is divided into 100 sec bins |
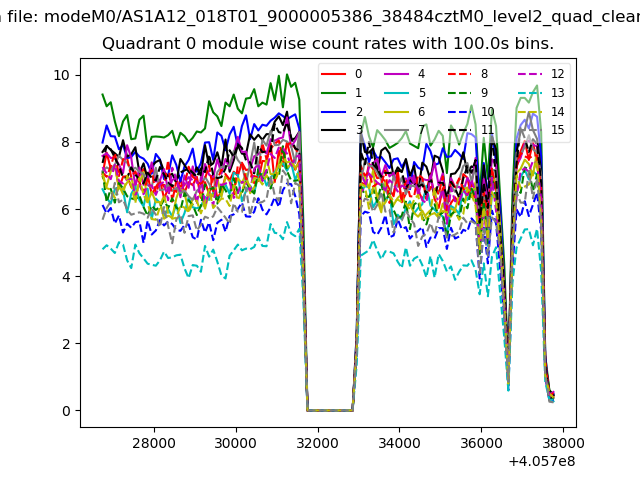 |
 |
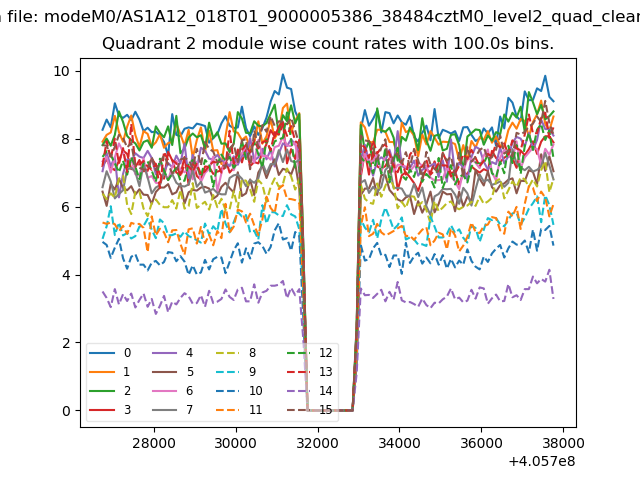
| Module-wise count rates for Quadrant B Data is divided into 100 sec bins |
 |
 |
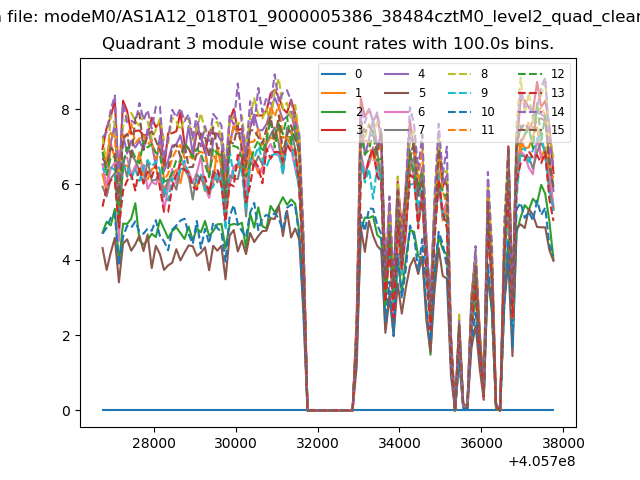
| Module-wise count rates for Quadrant C Data is divided into 100 sec bins |
 |
 |
| Module-wise count rates for Quadrant D Data is divided into 100 sec bins |
 |
 |
| Parameter | Plot |
|---|---|
| CZT HV Monitor | 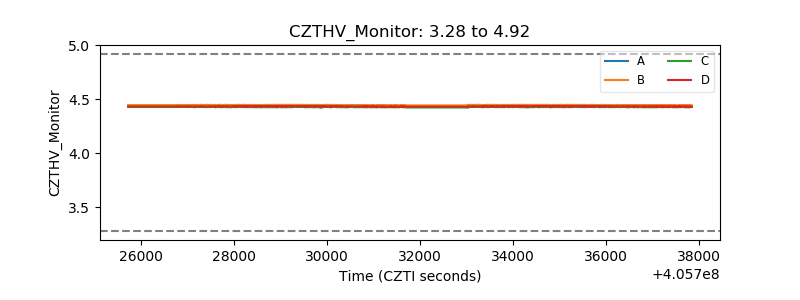 |
| D_VDD | 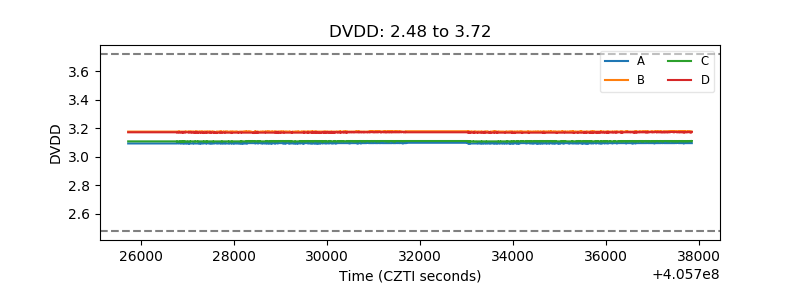 |
| Temperature 1 | 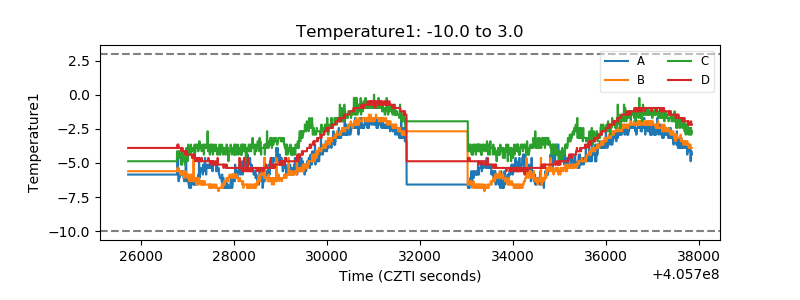 |
| Veto HV Monitor | 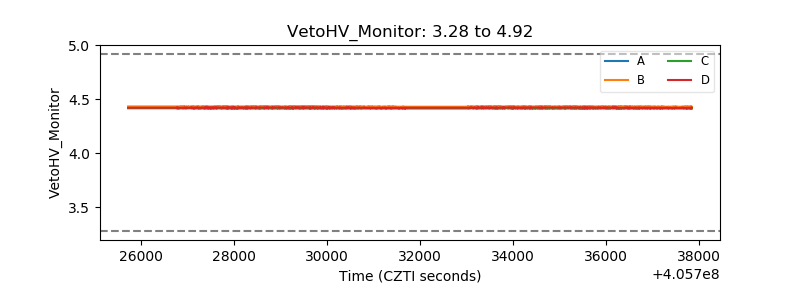 |
| Veto LLD | 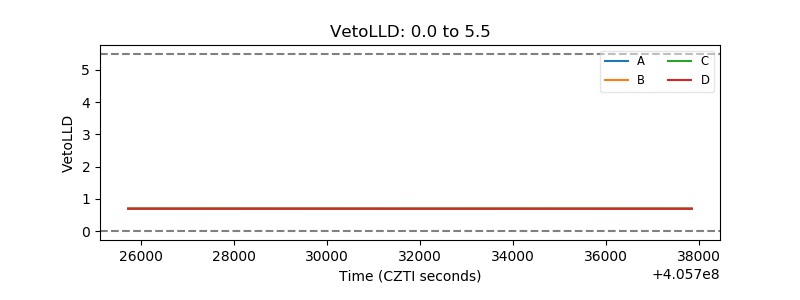 |
| Alpha Counter | 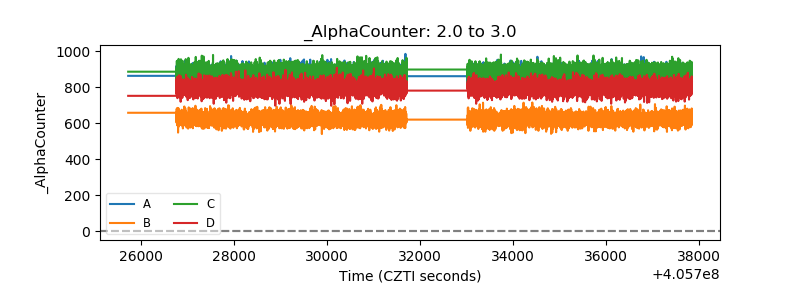 |
| _CPM_Rate | 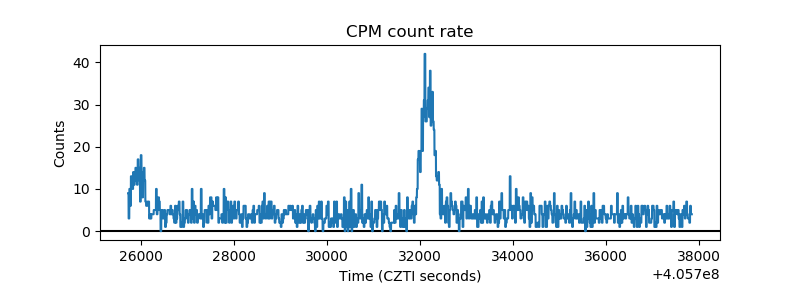 |
| CZT Counter | 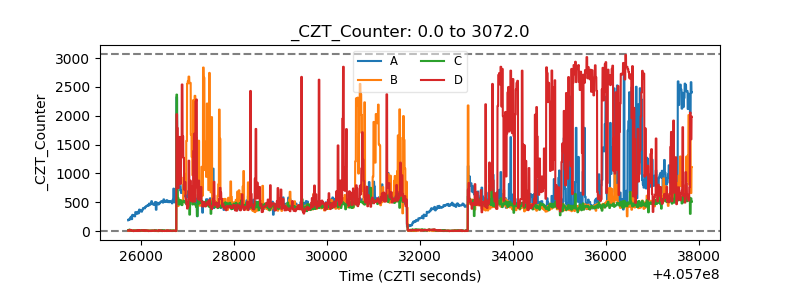 |
| +2.5 Volts monitor | 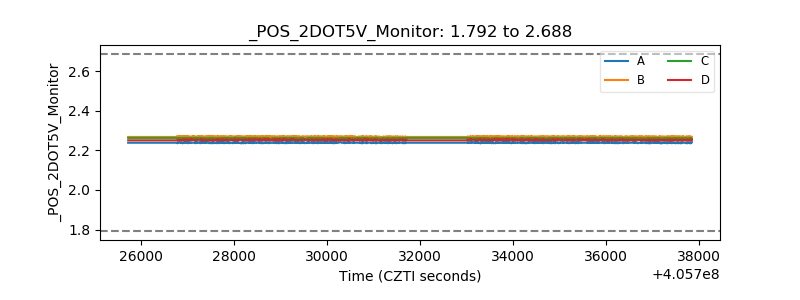 |
| +5 Volts monitor | 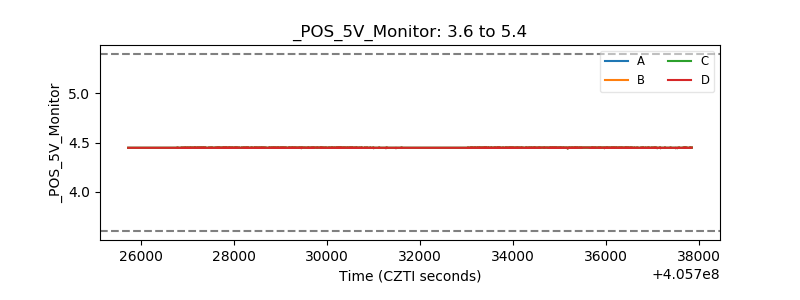 |
| _ROLL_ROT | 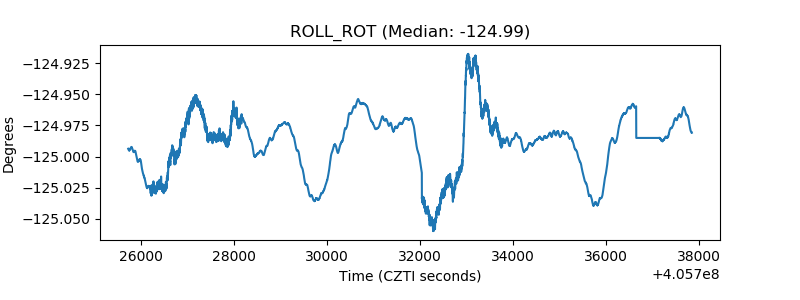 |
| _Roll_DEC | 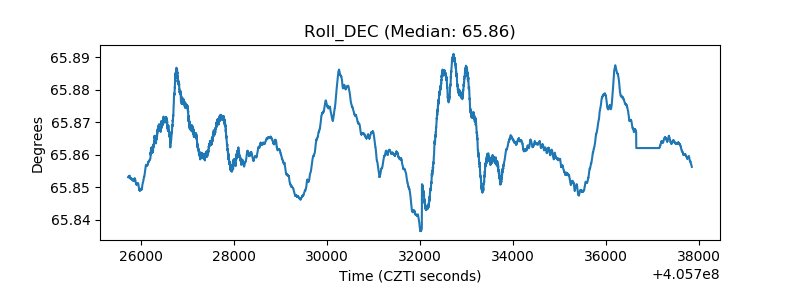 |
| _Roll_RA | 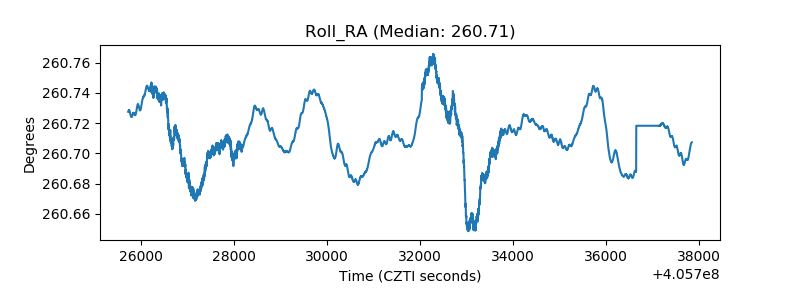 |
| Veto Counter | 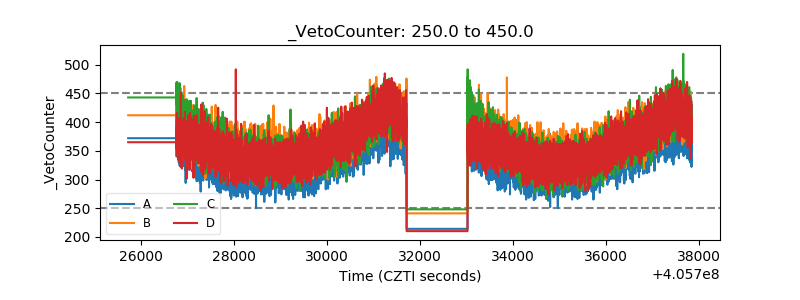 |