| Param | Original file | Final file |
|---|---|---|
| Filename | modeM0/AS1A12_018T01_9000005386_38485cztM0_level2.fits | modeM0/AS1A12_018T01_9000005386_38485cztM0_level2_quad_clean.evt |
| Size (bytes) | 462,015,360 | 105,909,120 |
| Size | 440.6 MB | 101.0 MB |
| Events in quadrant A | 5,794,161 | 674,691 |
| Events in quadrant B | 3,783,153 | 741,385 |
| Events in quadrant C | 3,079,665 | 708,970 |
| Events in quadrant D | 3,942,076 | 629,477 |
| Mode SS | |||
|---|---|---|---|
| Quadrant | BADHDUFLAG | Total packets | Discarded packets |
| A | 0 | 134 | 0 |
| B | 0 | 134 | 0 |
| C | 0 | 134 | 0 |
| D | 0 | 134 | 0 |
| Mode M9 | |||
|---|---|---|---|
| Quadrant | BADHDUFLAG | Total packets | Discarded packets |
| A | 0 | 29 | 0 |
| B | 0 | 29 | 0 |
| C | 0 | 29 | 0 |
| D | 0 | 29 | 0 |
| Mode M0 | |||
|---|---|---|---|
| Quadrant | BADHDUFLAG | Total packets | Discarded packets |
| A | 0 | 21553 | 3 |
| B | 0 | 15542 | 2 |
| C | 0 | 13177 | 2 |
| D | 0 | 16322 | 2 |
| Quadrant | Total seconds | Saturated seconds | Saturation percentage |
|---|---|---|---|
| A | 6480 | 566 | 8.734568% |
| B | 6480 | 65 | 1.003086% |
| C | 6480 | 5 | 0.077160% |
| D | 6480 | 289 | 4.459877% |
Noise dominated data is calculated using 1-second bins in cleaned event files. If a bin has >2000 counts, and if more than 50% of those come from <1% of pixels, then it is considered to be noise-dominated and hence unusable.
| Quadrant | # 1 sec bins | Bins with >0 counts | Bins with >2000 counts | High rate bins dominated by noise | Noise dominated (total time) | Noise dominated (detector-on time) | Marked lightcurve |
|---|---|---|---|---|---|---|---|
| A | 9407 | 6481 | 469 | 469 | 4.99% | 7.24% | 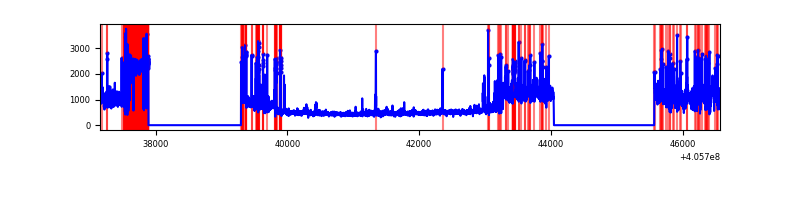 |
| B | 9407 | 6482 | 28 | 28 | 0.30% | 0.43% | 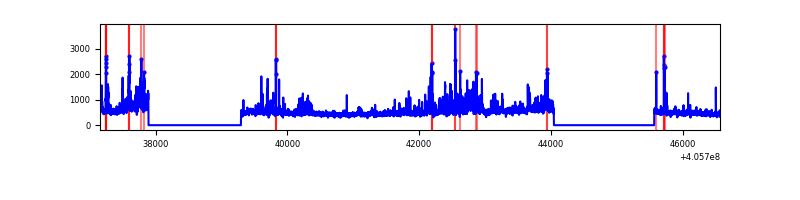 |
| C | 9407 | 6482 | 0 | 0 | 0.00% | 0.00% | 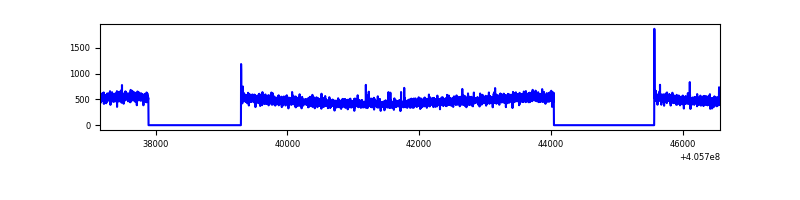 |
| D | 9407 | 6482 | 234 | 234 | 2.49% | 3.61% | 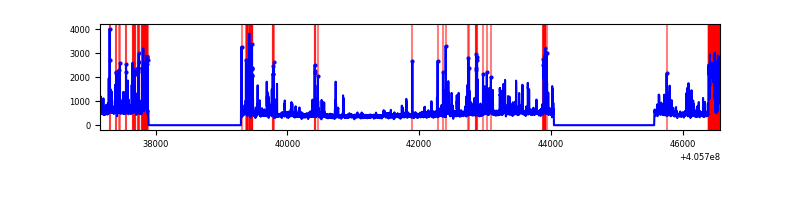 |
Top three noisy pixels from each quadrant. If the there are fewer than three noisy pixels in the level2.evt file, extra rows are filled as -1
| Pixel properties | Quadrant properties | ||||||
|---|---|---|---|---|---|---|---|
| Quadrant | DetID | PixID | Counts | Sigma | Mean | Median | Sigma |
| A | 15 | 222 | 2563930 | 17976.87 | 697 | 682 | 142.6 |
| A | 10 | 83 | 431687 | 3022.77 | 697 | 682 | 142.6 |
| A | 12 | 189 | 61119 | 423.86 | 697 | 682 | 142.6 |
| B | 4 | 171 | 746709 | 5290.58 | 730 | 711 | 141.0 |
| B | 8 | 3 | 61403 | 430.42 | 730 | 711 | 141.0 |
| B | 0 | 155 | 33354 | 231.5 | 730 | 711 | 141.0 |
| C | 15 | 214 | 268045 | 1591.36 | 718 | 721 | 168.0 |
| C | 0 | 10 | 10707 | 59.45 | 718 | 721 | 168.0 |
| C | 13 | 61 | 4551 | 22.8 | 718 | 721 | 168.0 |
| D | 10 | 118 | 527602 | 3075.86 | 705 | 685 | 171.3 |
| D | 2 | 250 | 173815 | 1010.64 | 705 | 685 | 171.3 |
| D | 13 | 249 | 158675 | 922.26 | 705 | 685 | 171.3 |
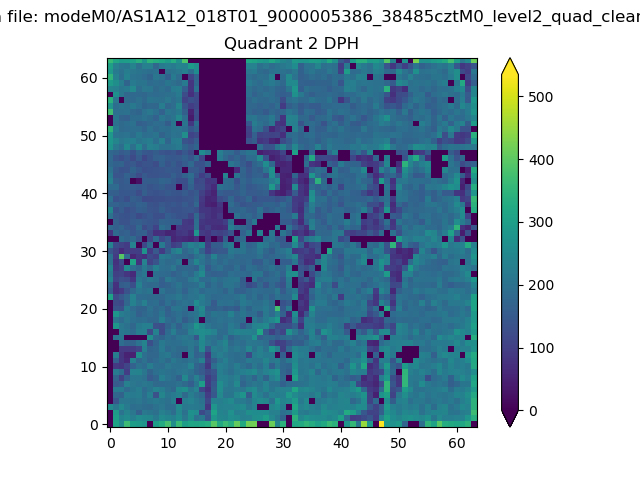
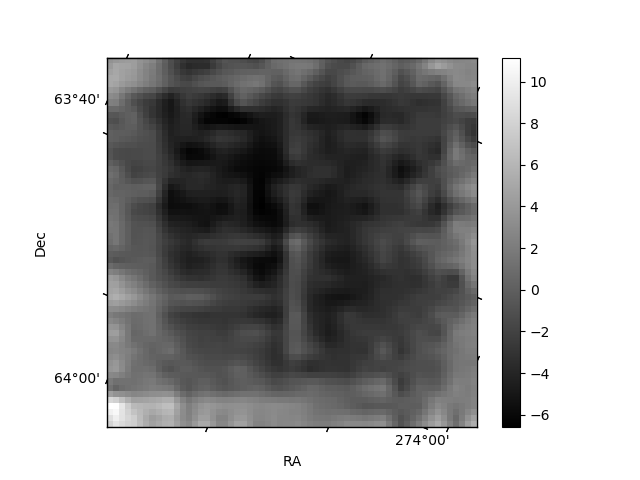
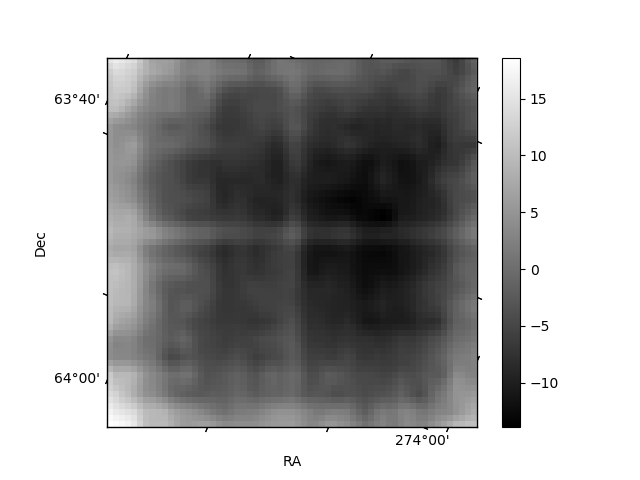
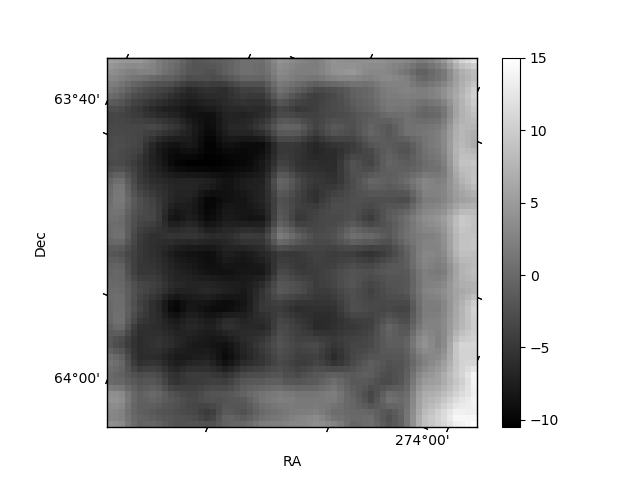
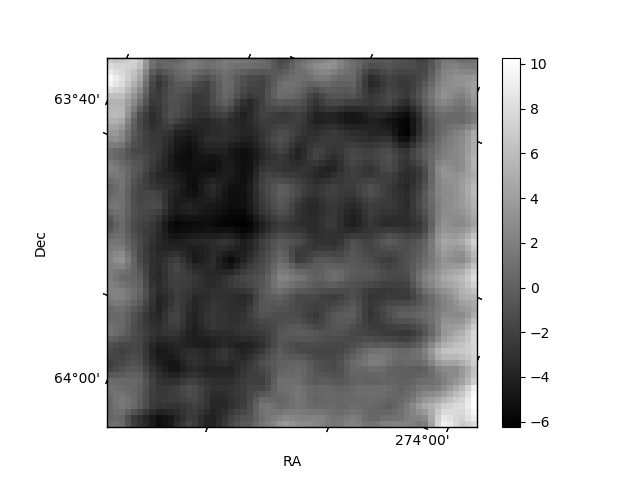
Histogram calculated using DETX and DETY for each event in the final _common_clean file
| Quadrant A |  |
 |
Quadrant B |
|---|---|---|---|
| Quadrant D | 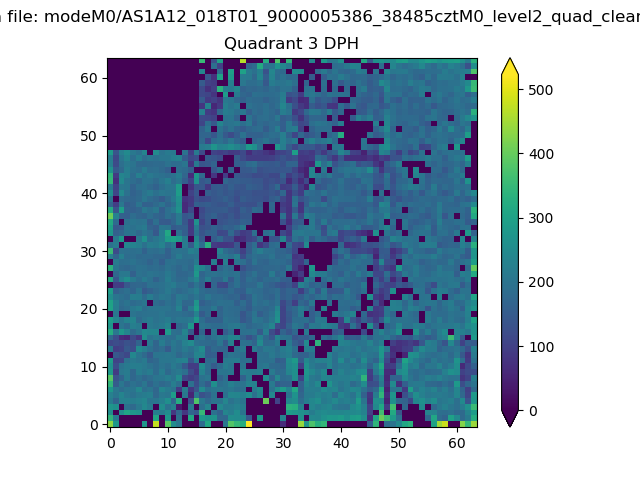 |
 |
Quadrant C |
| Plot type | Count rate plots | Images |
|---|---|---|
| Comparison with Poisson distribution Blue bars denote a histogram of data divided into 1 sec bins. Red curve is a Poisson curve with rate = median count rate of data. |
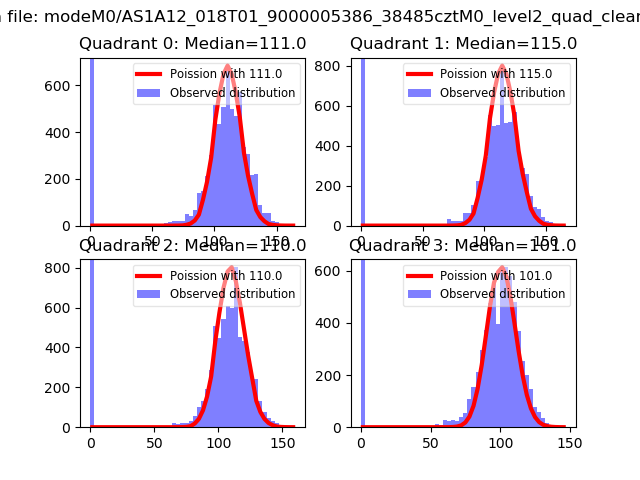 |
 |
| Quadrant-wise count rates Data is divided into 100 sec bins |
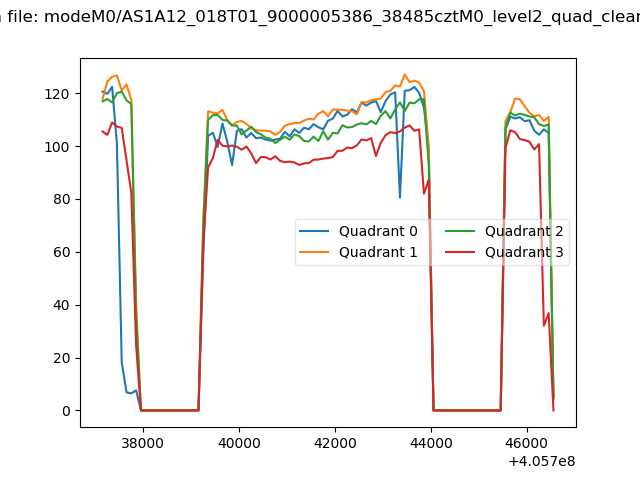 |
|
| Module-wise count rates for Quadrant A Data is divided into 100 sec bins |
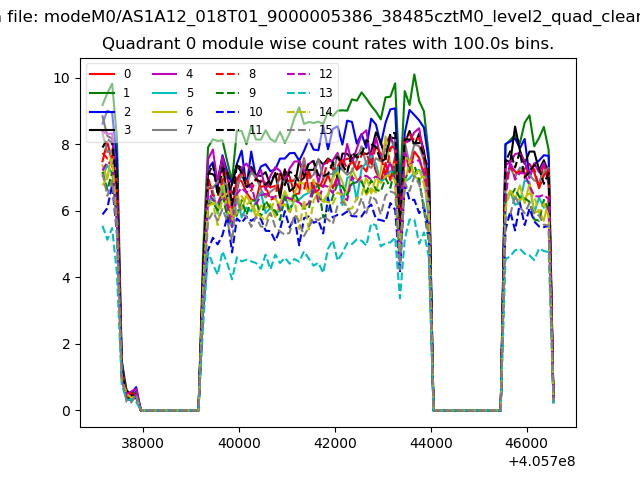 |
 |
| Module-wise count rates for Quadrant B Data is divided into 100 sec bins |
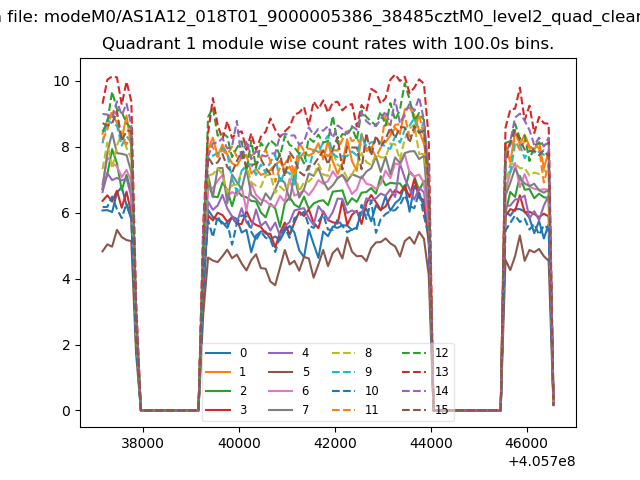 |
 |
| Module-wise count rates for Quadrant C Data is divided into 100 sec bins |
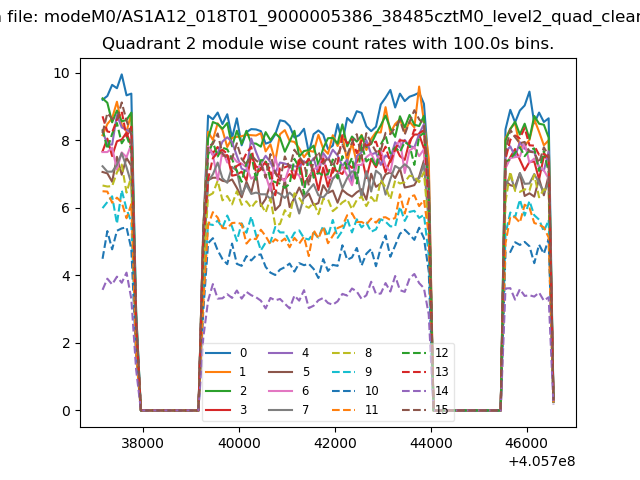 |
 |
| Module-wise count rates for Quadrant D Data is divided into 100 sec bins |
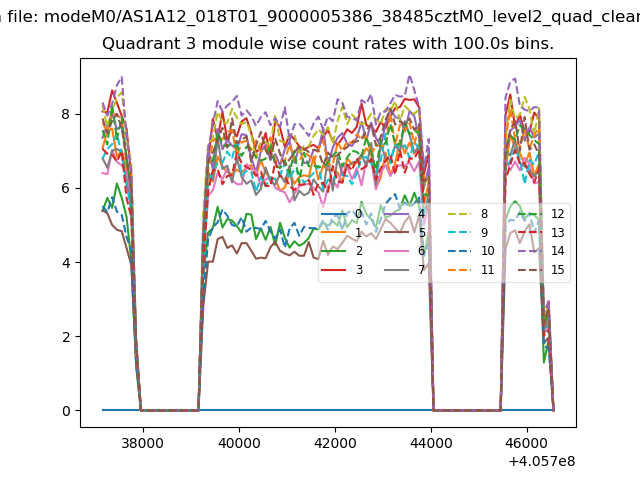 |
 |
| Parameter | Plot |
|---|---|
| CZT HV Monitor | 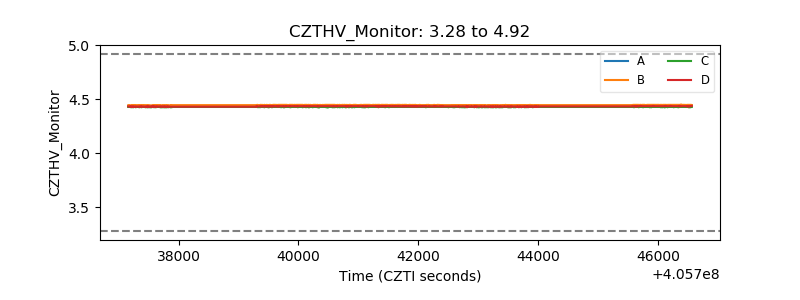 |
| D_VDD | 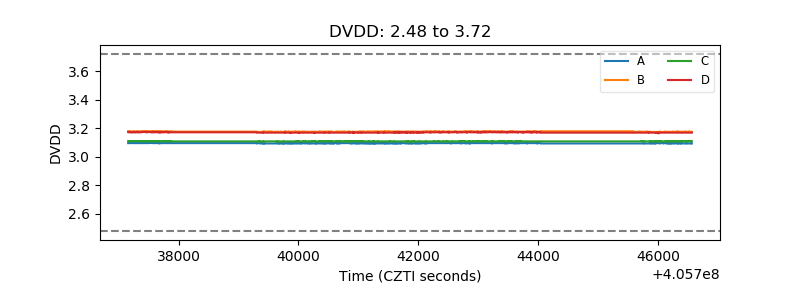 |
| Temperature 1 | 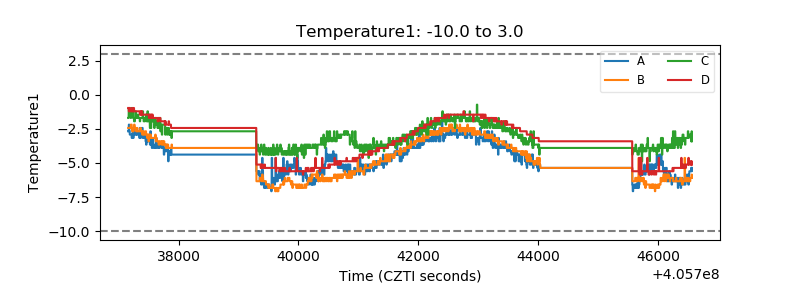 |
| Veto HV Monitor | 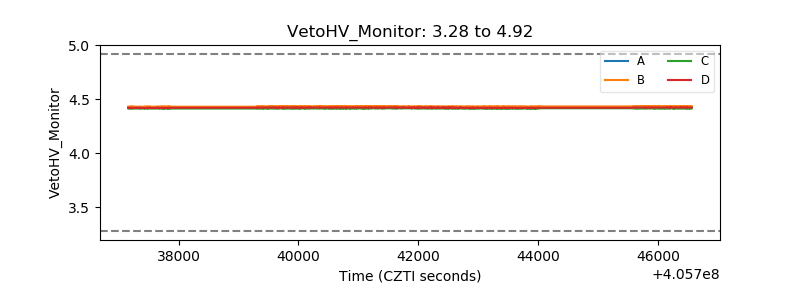 |
| Veto LLD | 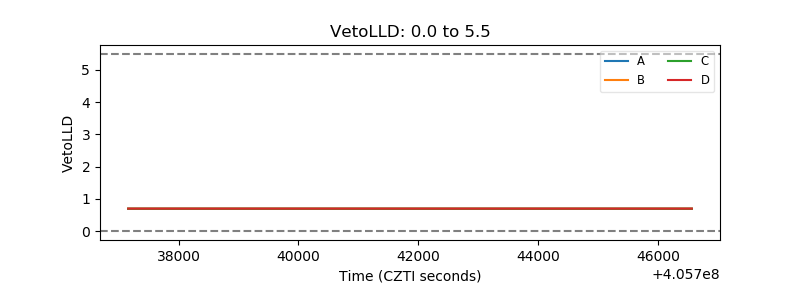 |
| Alpha Counter | 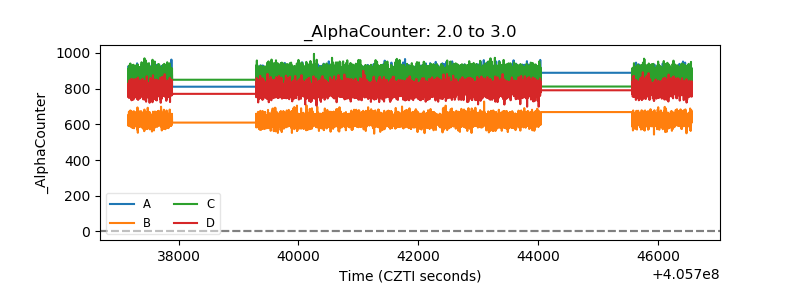 |
| _CPM_Rate | 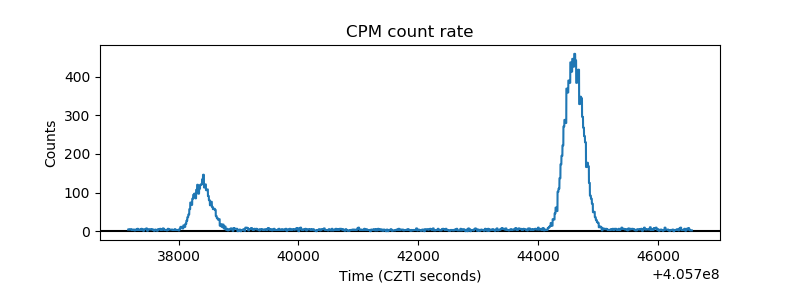 |
| CZT Counter | 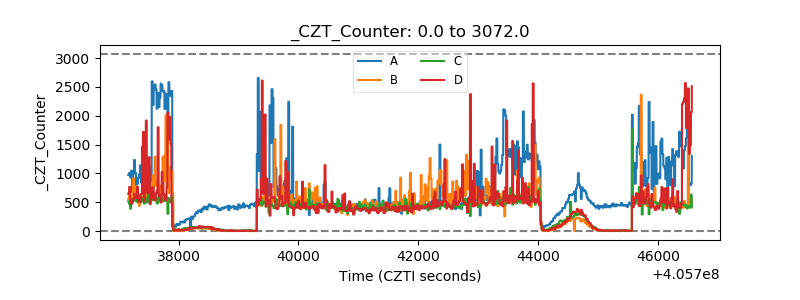 |
| +2.5 Volts monitor | 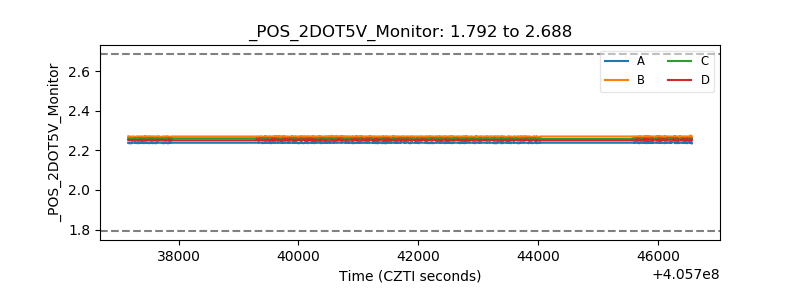 |
| +5 Volts monitor | 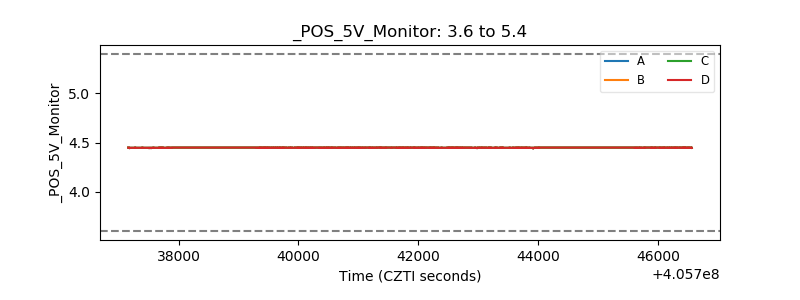 |
| _ROLL_ROT |  |
| _Roll_DEC | 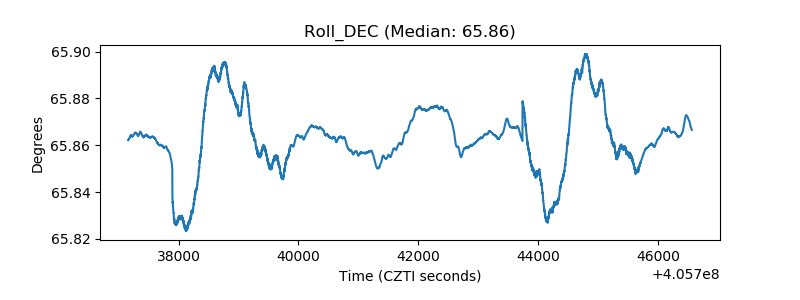 |
| _Roll_RA | 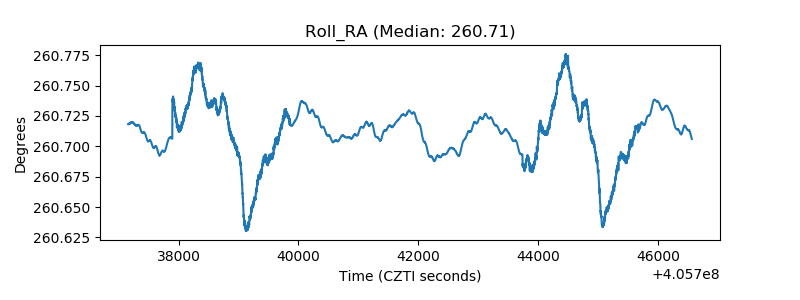 |
| Veto Counter | 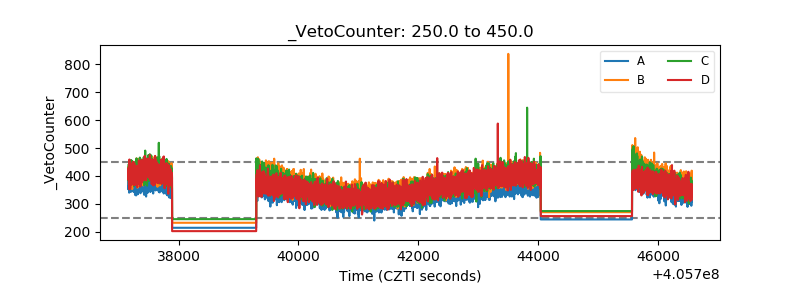 |