| Param | Original file | Final file |
|---|---|---|
| Filename | modeM0/AS1A12_018T01_9000005386_38486cztM0_level2.fits | modeM0/AS1A12_018T01_9000005386_38486cztM0_level2_quad_clean.evt |
| Size (bytes) | 492,160,320 | 89,216,640 |
| Size | 469.4 MB | 85.1 MB |
| Events in quadrant A | 6,575,453 | 597,621 |
| Events in quadrant B | 3,010,267 | 634,153 |
| Events in quadrant C | 2,627,685 | 605,674 |
| Events in quadrant D | 5,578,324 | 478,908 |
| Mode SS | |||
|---|---|---|---|
| Quadrant | BADHDUFLAG | Total packets | Discarded packets |
| A | 0 | 112 | 0 |
| B | 0 | 112 | 0 |
| C | 0 | 112 | 0 |
| D | 0 | 112 | 0 |
| Mode M9 | |||
|---|---|---|---|
| Quadrant | BADHDUFLAG | Total packets | Discarded packets |
| A | 0 | 22 | 0 |
| B | 0 | 22 | 0 |
| C | 0 | 22 | 0 |
| D | 0 | 23 | 0 |
| Mode M0 | |||
|---|---|---|---|
| Quadrant | BADHDUFLAG | Total packets | Discarded packets |
| A | 0 | 23381 | 3 |
| B | 0 | 12597 | 2 |
| C | 0 | 11285 | 2 |
| D | 0 | 20413 | 2 |
| Quadrant | Total seconds | Saturated seconds | Saturation percentage |
|---|---|---|---|
| A | 5498 | 487 | 8.857766% |
| B | 5498 | 96 | 1.746089% |
| C | 5498 | 7 | 0.127319% |
| D | 5498 | 958 | 17.424518% |
Noise dominated data is calculated using 1-second bins in cleaned event files. If a bin has >2000 counts, and if more than 50% of those come from <1% of pixels, then it is considered to be noise-dominated and hence unusable.
| Quadrant | # 1 sec bins | Bins with >0 counts | Bins with >2000 counts | High rate bins dominated by noise | Noise dominated (total time) | Noise dominated (detector-on time) | Marked lightcurve |
|---|---|---|---|---|---|---|---|
| A | 7171 | 5499 | 435 | 435 | 6.07% | 7.91% | 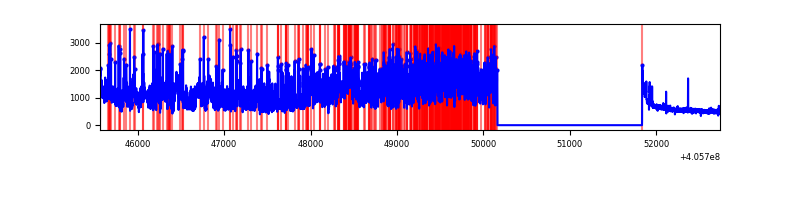 |
| B | 7171 | 5499 | 51 | 51 | 0.71% | 0.93% | 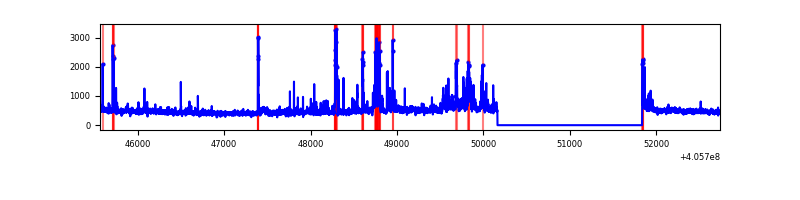 |
| C | 7171 | 5499 | 2 | 2 | 0.03% | 0.04% | 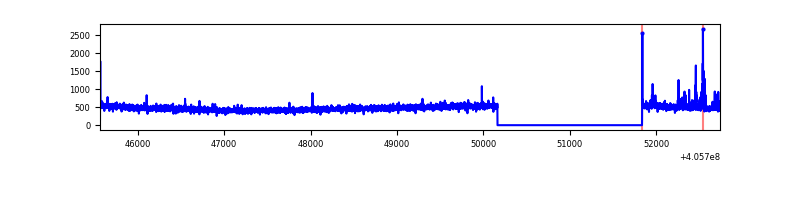 |
| D | 7171 | 5499 | 879 | 879 | 12.26% | 15.98% | 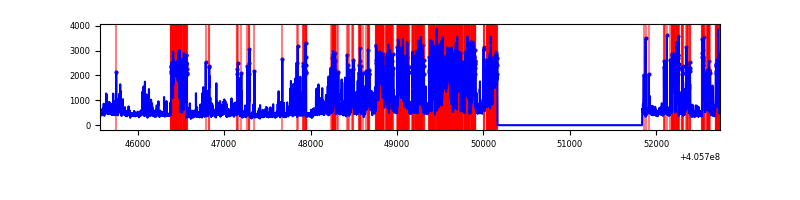 |
Top three noisy pixels from each quadrant. If the there are fewer than three noisy pixels in the level2.evt file, extra rows are filled as -1
| Pixel properties | Quadrant properties | ||||||
|---|---|---|---|---|---|---|---|
| Quadrant | DetID | PixID | Counts | Sigma | Mean | Median | Sigma |
| A | 15 | 222 | 3786801 | 30670.48 | 604 | 591 | 123.4 |
| A | 10 | 83 | 395340 | 3197.69 | 604 | 591 | 123.4 |
| A | 12 | 189 | 30656 | 243.54 | 604 | 591 | 123.4 |
| B | 4 | 171 | 439166 | 3749.95 | 610 | 595 | 117.0 |
| B | 8 | 3 | 65086 | 551.42 | 610 | 595 | 117.0 |
| B | 0 | 183 | 38389 | 323.15 | 610 | 595 | 117.0 |
| C | 15 | 214 | 232294 | 1675.07 | 595 | 599 | 138.3 |
| C | 5 | 250 | 59594 | 426.51 | 595 | 599 | 138.3 |
| C | 0 | 10 | 11568 | 79.3 | 595 | 599 | 138.3 |
| D | 12 | 227 | 1830008 | 13566.09 | 554 | 539 | 134.9 |
| D | 10 | 118 | 372440 | 2757.76 | 554 | 539 | 134.9 |
| D | 13 | 171 | 354744 | 2626.54 | 554 | 539 | 134.9 |
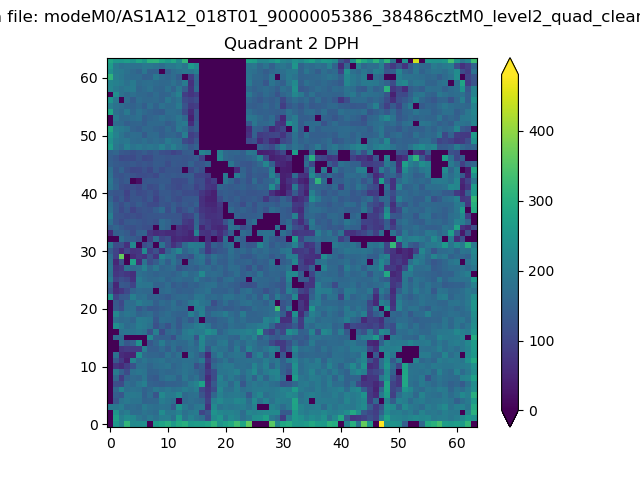
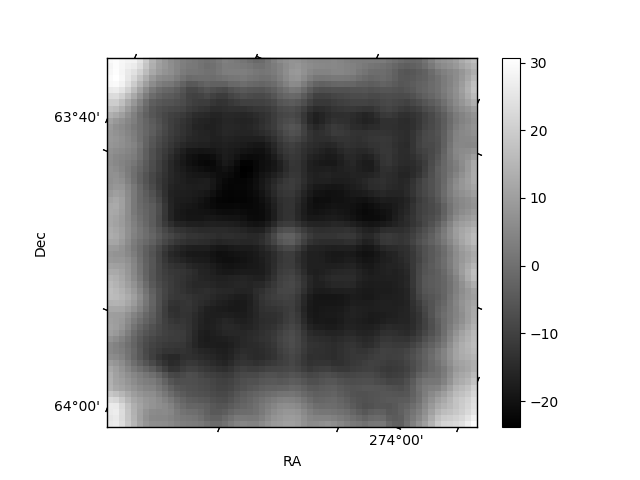
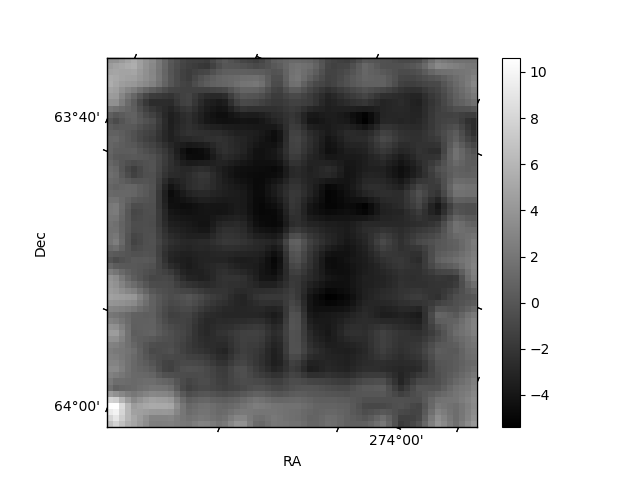
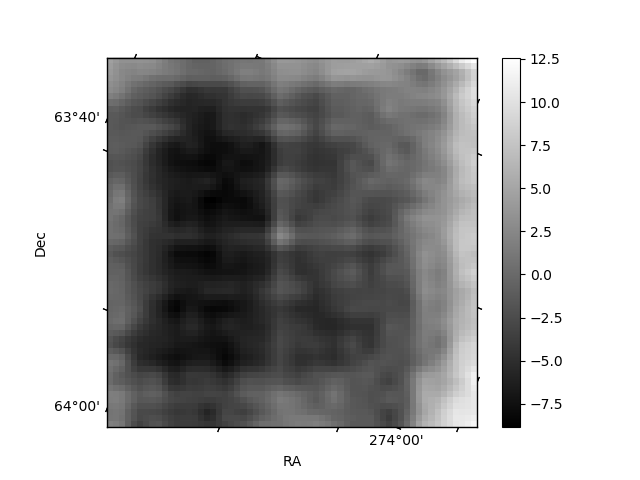
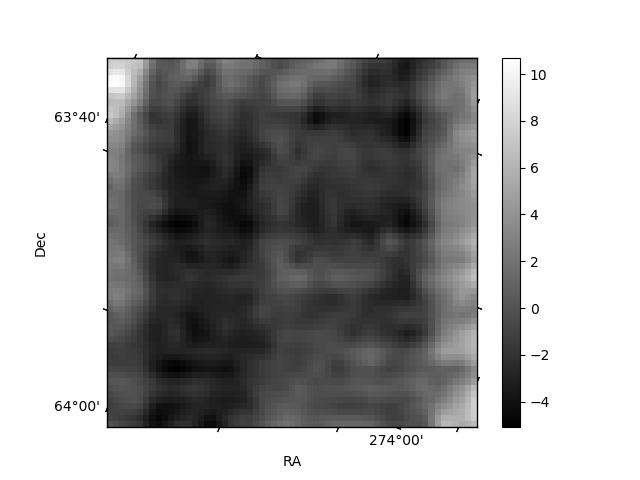
Histogram calculated using DETX and DETY for each event in the final _common_clean file
| Quadrant A | 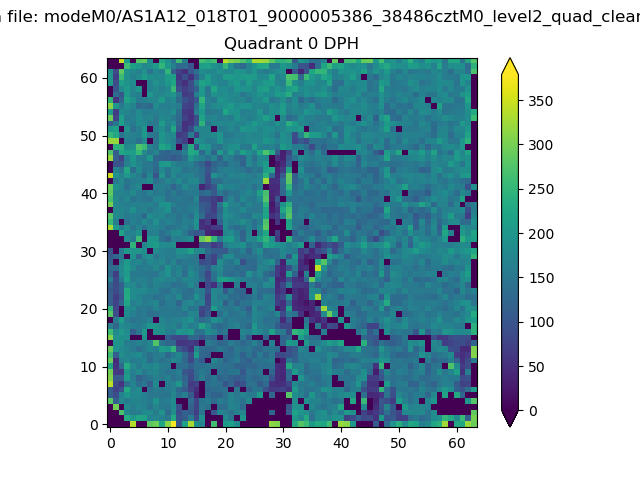 |
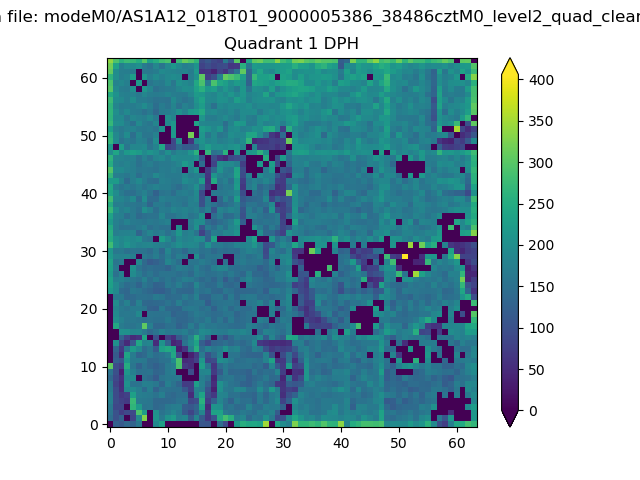 |
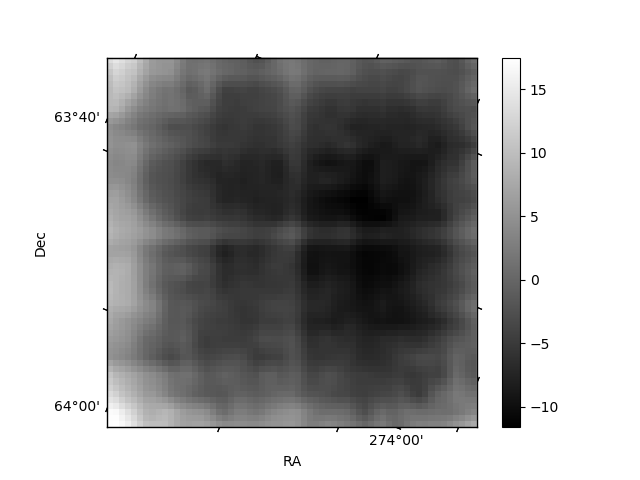
Quadrant B |
|---|---|---|---|
| Quadrant D | 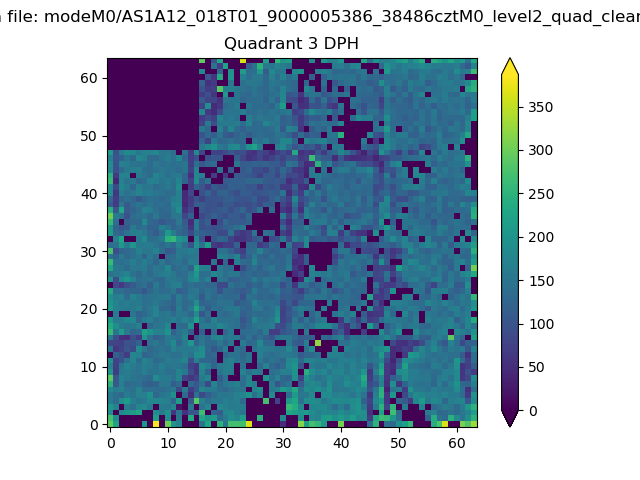 |
 |
Quadrant C |
| Plot type | Count rate plots | Images |
|---|---|---|
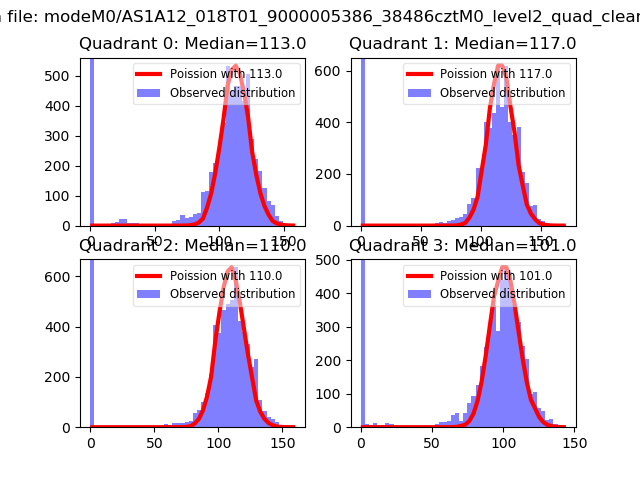
| Comparison with Poisson distribution Blue bars denote a histogram of data divided into 1 sec bins. Red curve is a Poisson curve with rate = median count rate of data. |
 |
 |
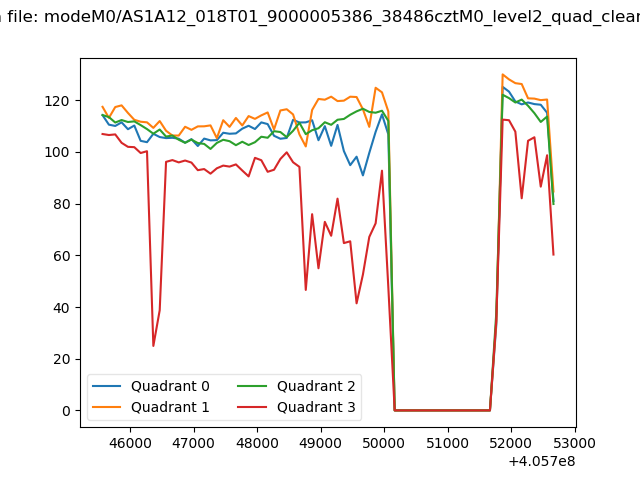
| Quadrant-wise count rates Data is divided into 100 sec bins |
 |
|
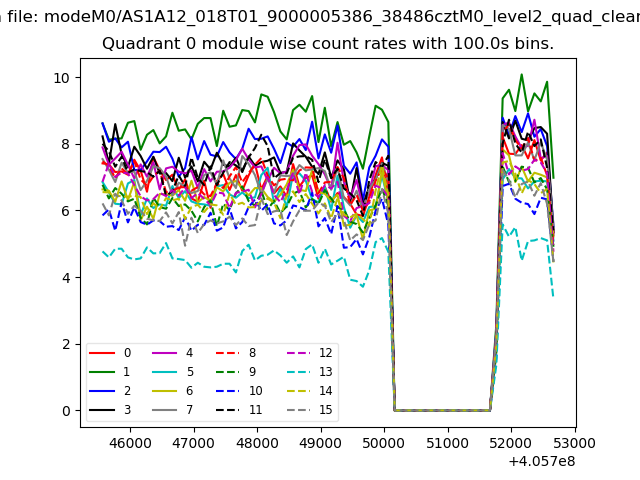
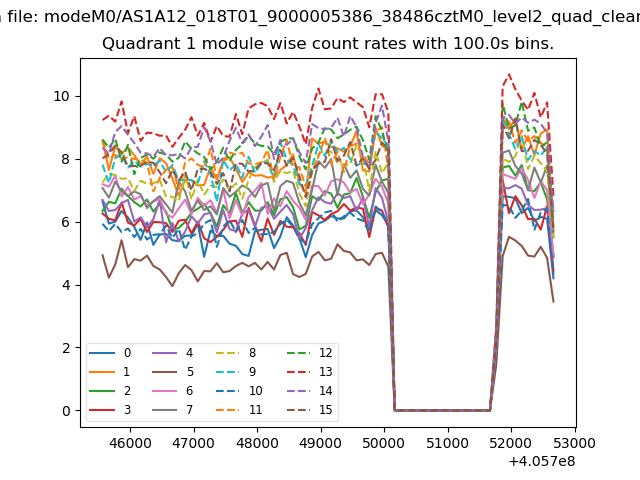
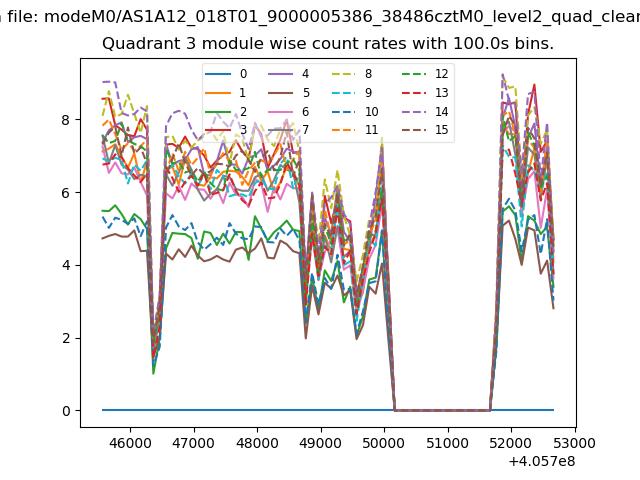
| Module-wise count rates for Quadrant A Data is divided into 100 sec bins |
 |
 |
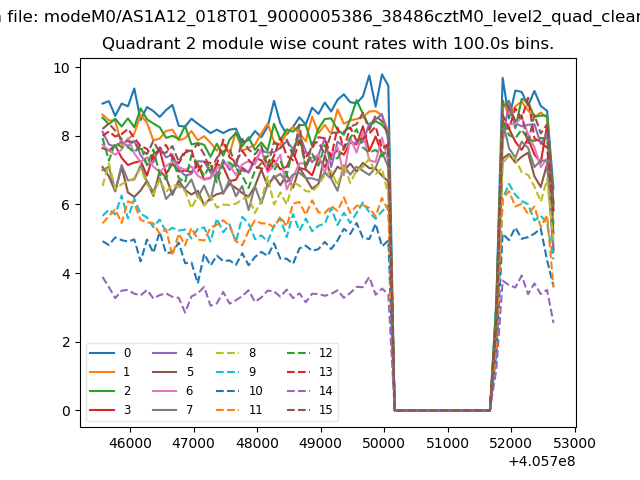
| Module-wise count rates for Quadrant B Data is divided into 100 sec bins |
 |
 |
| Module-wise count rates for Quadrant C Data is divided into 100 sec bins |
 |
 |
| Module-wise count rates for Quadrant D Data is divided into 100 sec bins |
 |
 |
| Parameter | Plot |
|---|---|
| CZT HV Monitor | 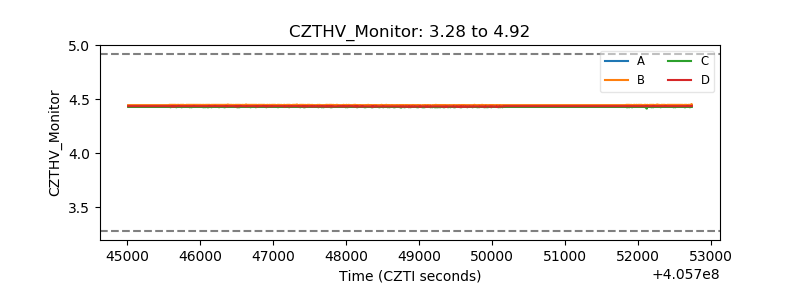 |
| D_VDD | 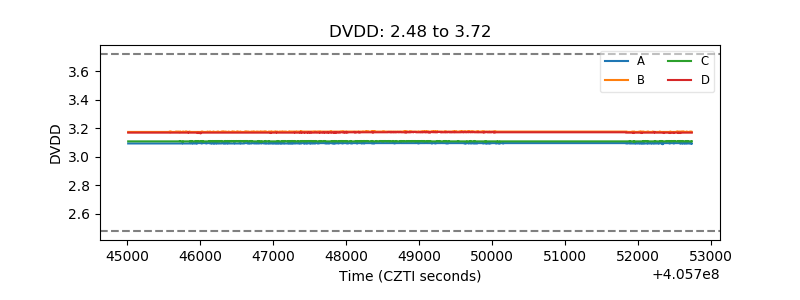 |
| Temperature 1 | 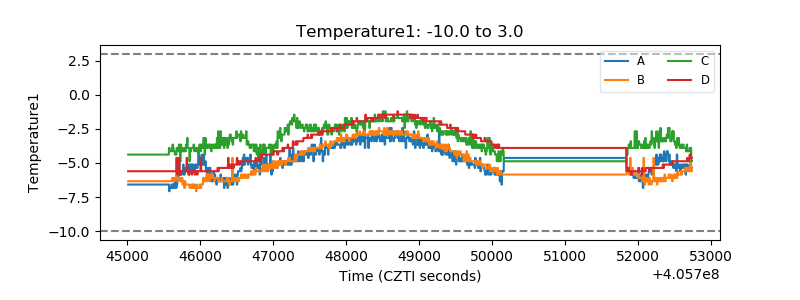 |
| Veto HV Monitor | 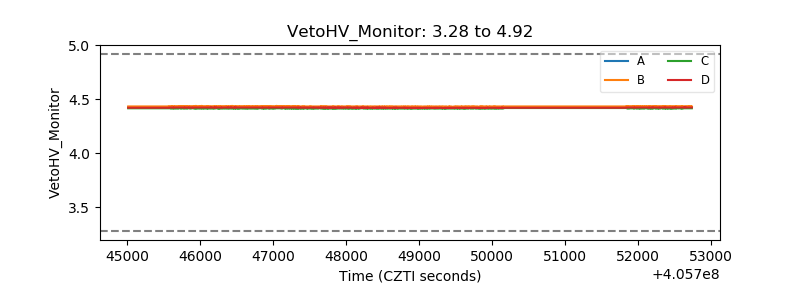 |
| Veto LLD | 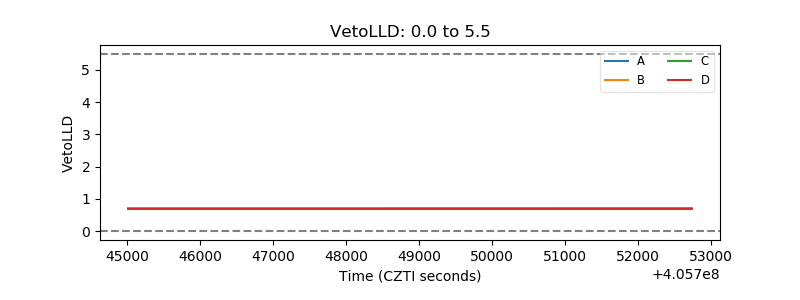 |
| Alpha Counter | 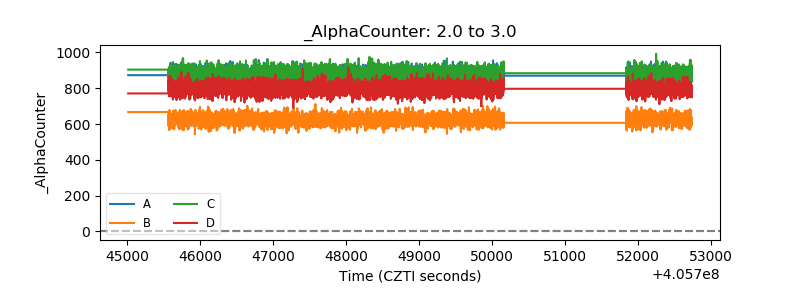 |
| _CPM_Rate | 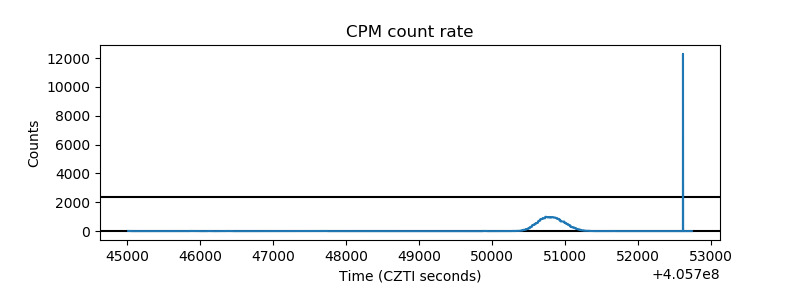 |
| CZT Counter | 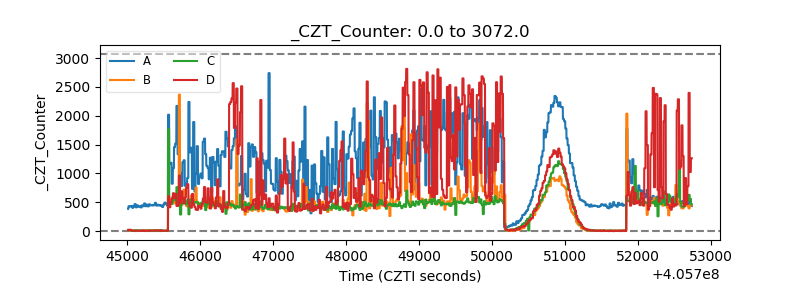 |
| +2.5 Volts monitor |  |
| +5 Volts monitor | 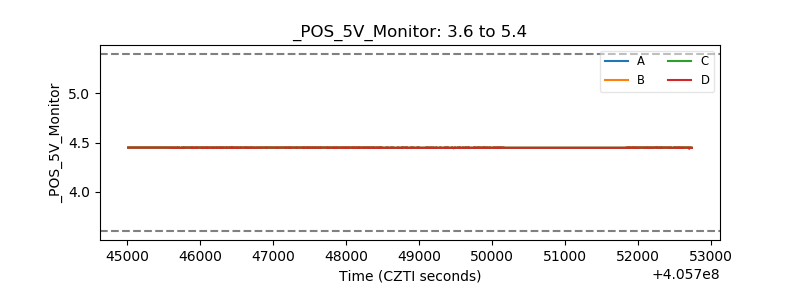 |
| _ROLL_ROT | 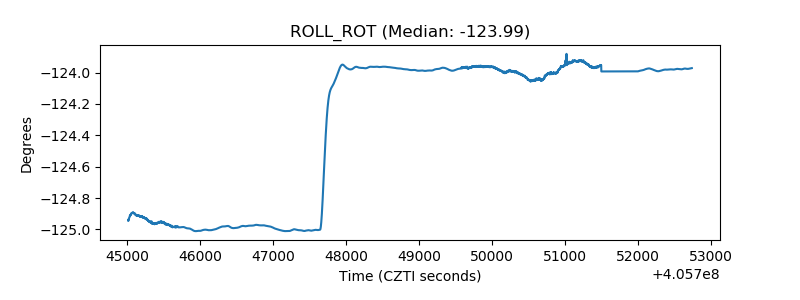 |
| _Roll_DEC | 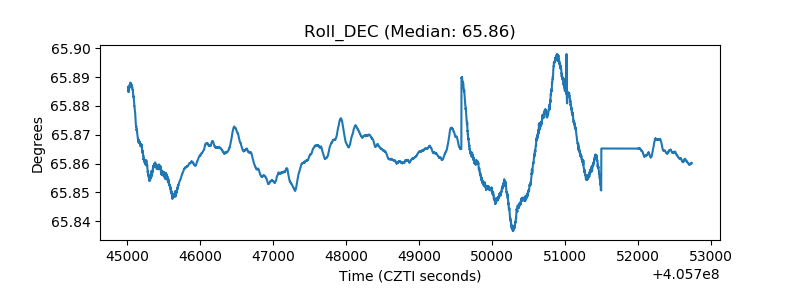 |
| _Roll_RA | 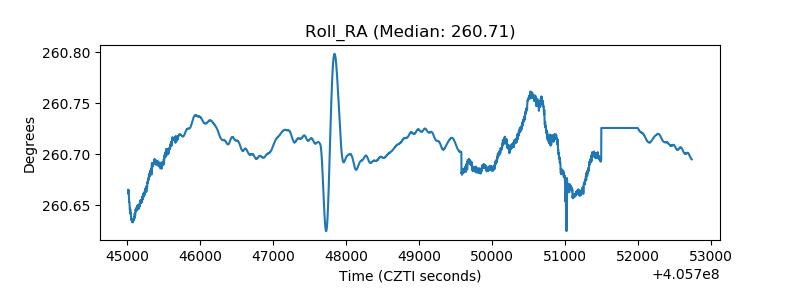 |
| Veto Counter | 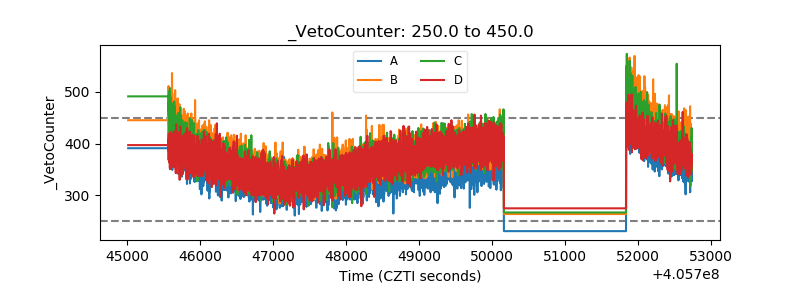 |