| Param | Original file | Final file |
|---|---|---|
| Filename | modeM0/AS1A12_018T01_9000005386_38489cztM0_level2.fits | modeM0/AS1A12_018T01_9000005386_38489cztM0_level2_quad_clean.evt |
| Size (bytes) | 425,249,280 | 88,035,840 |
| Size | 405.5 MB | 84.0 MB |
| Events in quadrant A | 3,589,626 | 642,800 |
| Events in quadrant B | 2,736,345 | 647,760 |
| Events in quadrant C | 2,421,365 | 600,185 |
| Events in quadrant D | 6,602,850 | 422,179 |
| Mode SS | |||
|---|---|---|---|
| Quadrant | BADHDUFLAG | Total packets | Discarded packets |
| A | 0 | 104 | 0 |
| B | 0 | 104 | 0 |
| C | 0 | 104 | 0 |
| D | 0 | 104 | 0 |
| Mode M9 | |||
|---|---|---|---|
| Quadrant | BADHDUFLAG | Total packets | Discarded packets |
| A | 0 | 19 | 0 |
| B | 0 | 19 | 0 |
| C | 0 | 19 | 0 |
| D | 0 | 19 | 0 |
| Mode M0 | |||
|---|---|---|---|
| Quadrant | BADHDUFLAG | Total packets | Discarded packets |
| A | 0 | 14247 | 2 |
| B | 0 | 11147 | 1 |
| C | 0 | 10182 | 1 |
| D | 0 | 22993 | 1 |
| Quadrant | Total seconds | Saturated seconds | Saturation percentage |
|---|---|---|---|
| A | 5028 | 31 | 0.616547% |
| B | 5028 | 107 | 2.128083% |
| C | 5028 | 5 | 0.099443% |
| D | 5028 | 1439 | 28.619730% |
Noise dominated data is calculated using 1-second bins in cleaned event files. If a bin has >2000 counts, and if more than 50% of those come from <1% of pixels, then it is considered to be noise-dominated and hence unusable.
| Quadrant | # 1 sec bins | Bins with >0 counts | Bins with >2000 counts | High rate bins dominated by noise | Noise dominated (total time) | Noise dominated (detector-on time) | Marked lightcurve |
|---|---|---|---|---|---|---|---|
| A | 6971 | 5029 | 9 | 9 | 0.13% | 0.18% | 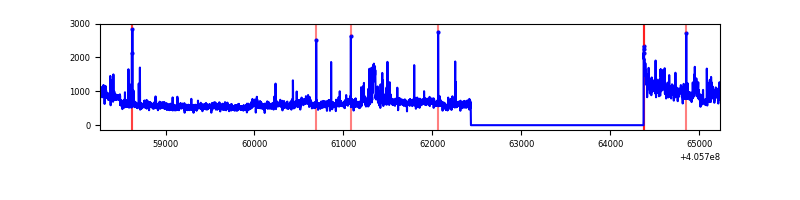 |
| B | 6971 | 5029 | 78 | 78 | 1.12% | 1.55% | 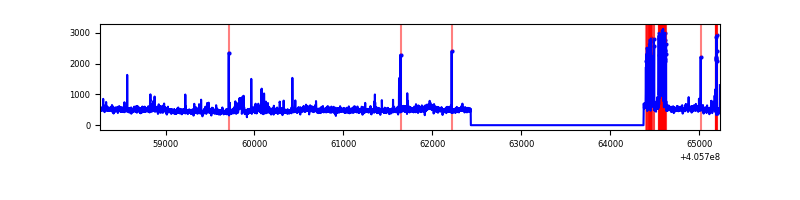 |
| C | 6971 | 5029 | 3 | 3 | 0.04% | 0.06% | 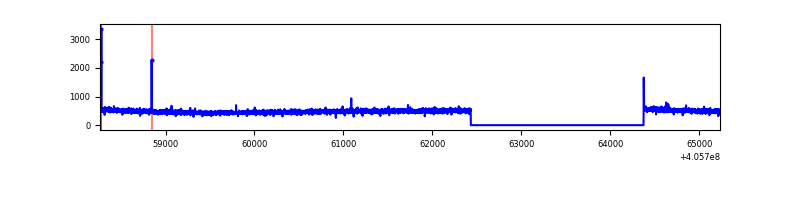 |
| D | 6971 | 5028 | 1427 | 1427 | 20.47% | 28.38% | 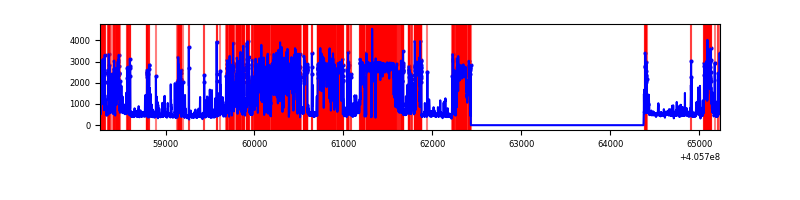 |
Top three noisy pixels from each quadrant. If the there are fewer than three noisy pixels in the level2.evt file, extra rows are filled as -1
| Pixel properties | Quadrant properties | ||||||
|---|---|---|---|---|---|---|---|
| Quadrant | DetID | PixID | Counts | Sigma | Mean | Median | Sigma |
| A | 15 | 222 | 895516 | 7449.57 | 594 | 584 | 120.1 |
| A | 10 | 83 | 326574 | 2713.6 | 594 | 584 | 120.1 |
| A | 9 | 143 | 30720 | 250.86 | 594 | 584 | 120.1 |
| B | 8 | 3 | 274589 | 2494.69 | 583 | 569 | 109.8 |
| B | 0 | 183 | 53196 | 479.12 | 583 | 569 | 109.8 |
| B | 4 | 170 | 32764 | 293.11 | 583 | 569 | 109.8 |
| C | 15 | 214 | 208344 | 1599.08 | 562 | 567 | 129.9 |
| C | 14 | 254 | 10359 | 75.36 | 562 | 567 | 129.9 |
| C | 0 | 10 | 4498 | 30.25 | 562 | 567 | 129.9 |
| D | 12 | 227 | 4231167 | 35382.55 | 492 | 478 | 119.6 |
| D | 10 | 118 | 176528 | 1472.36 | 492 | 478 | 119.6 |
| D | 12 | 235 | 104764 | 872.18 | 492 | 478 | 119.6 |
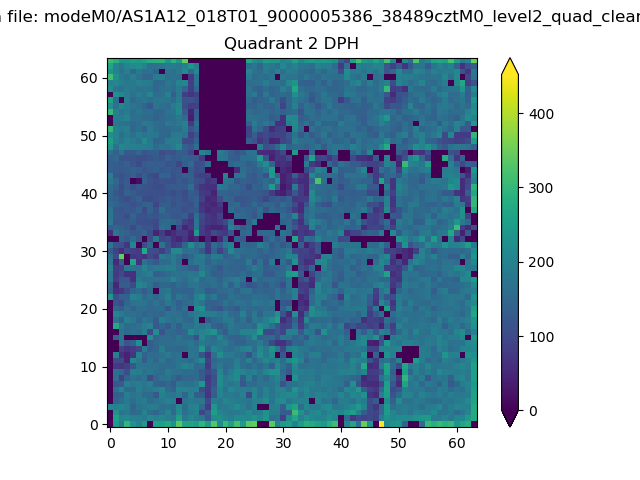
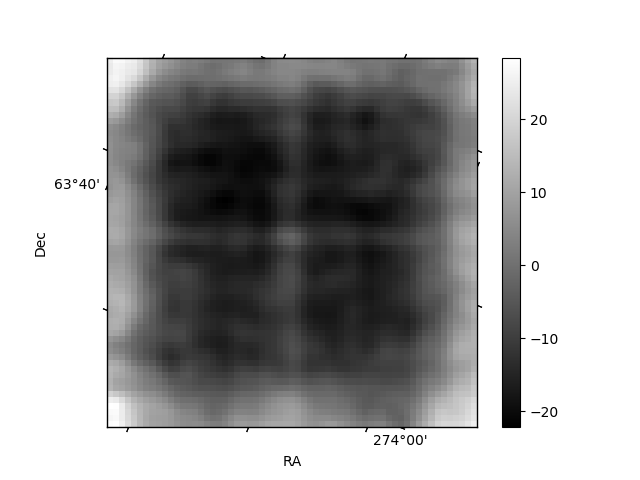
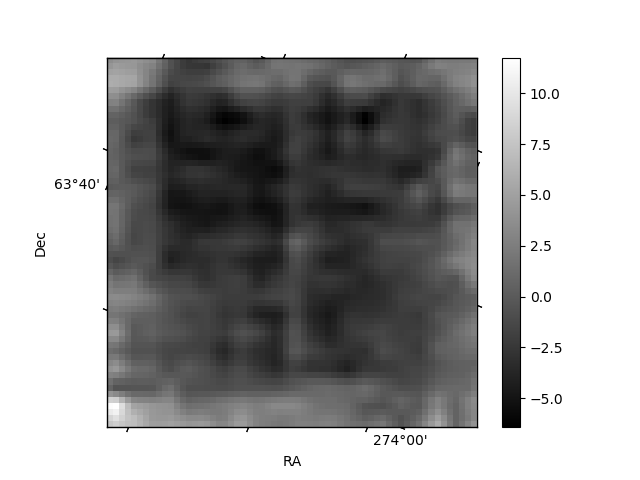
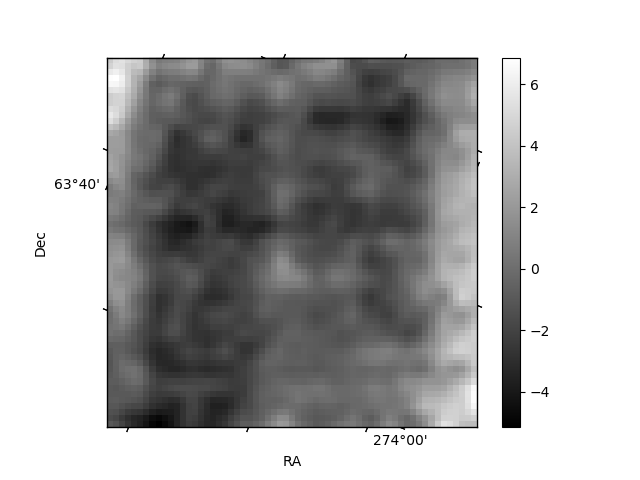
Histogram calculated using DETX and DETY for each event in the final _common_clean file
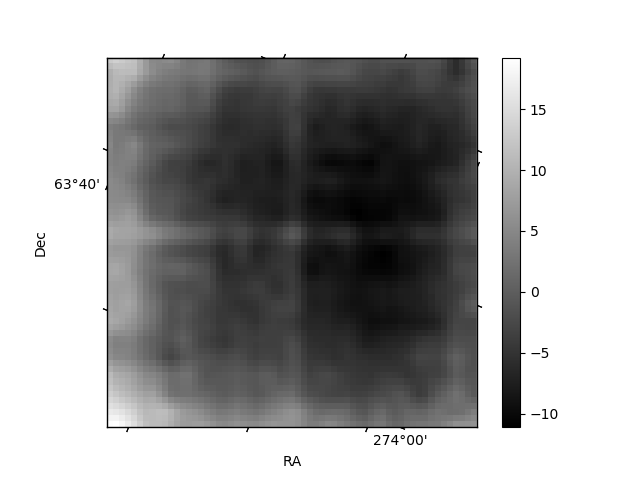
| Quadrant A | 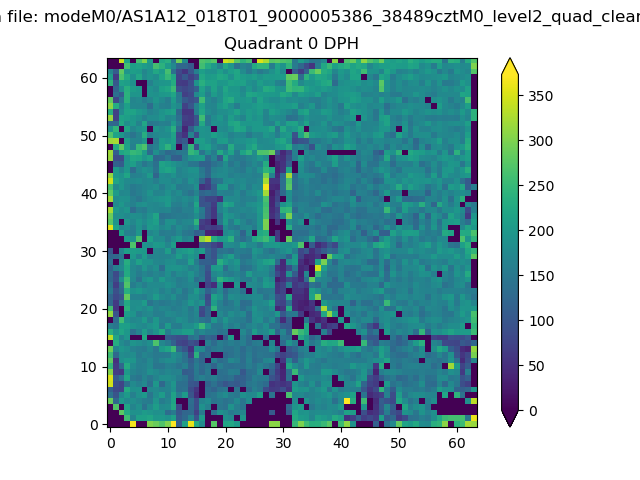 |
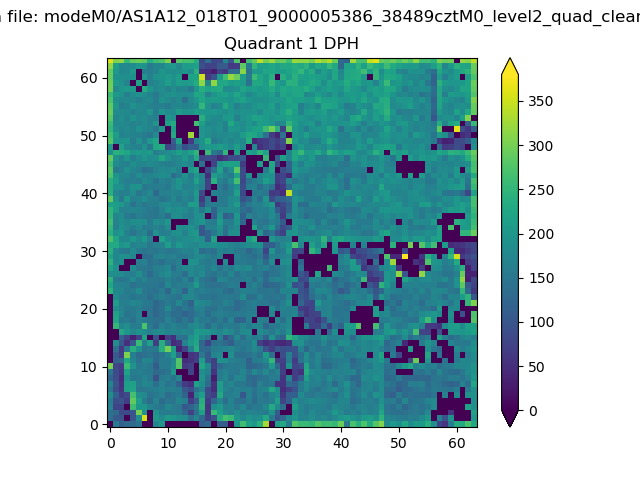 |
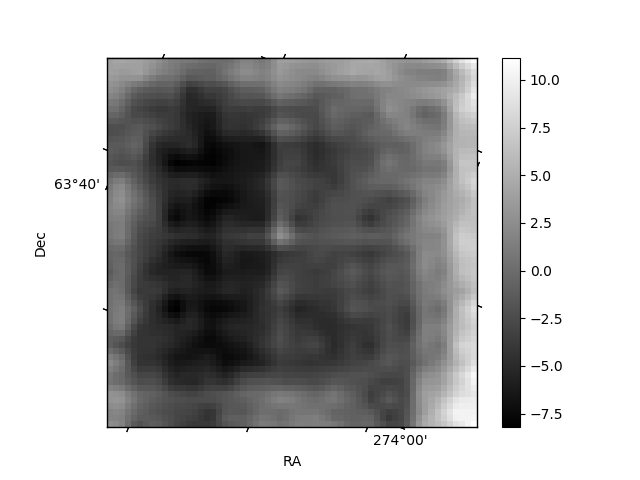
Quadrant B |
|---|---|---|---|
| Quadrant D | 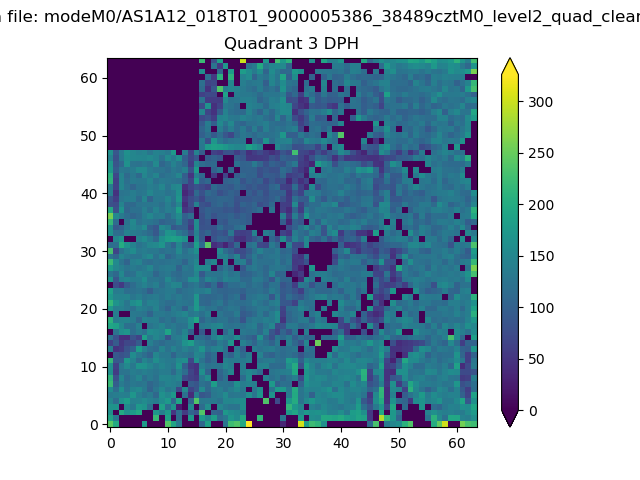 |
 |
Quadrant C |
| Plot type | Count rate plots | Images |
|---|---|---|
| Comparison with Poisson distribution Blue bars denote a histogram of data divided into 1 sec bins. Red curve is a Poisson curve with rate = median count rate of data. |
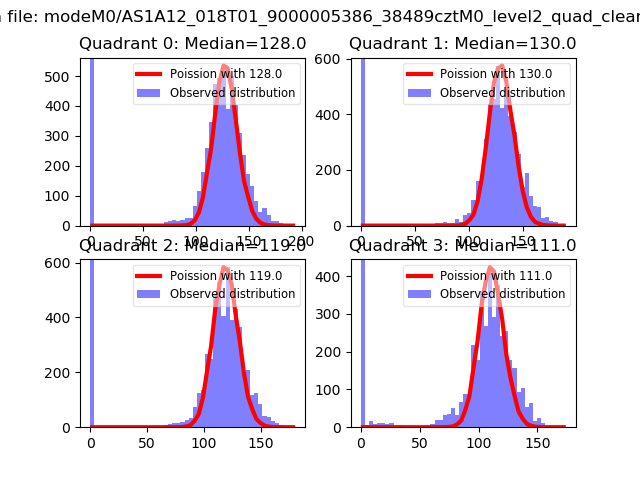 |
 |
| Quadrant-wise count rates Data is divided into 100 sec bins |
 |
|
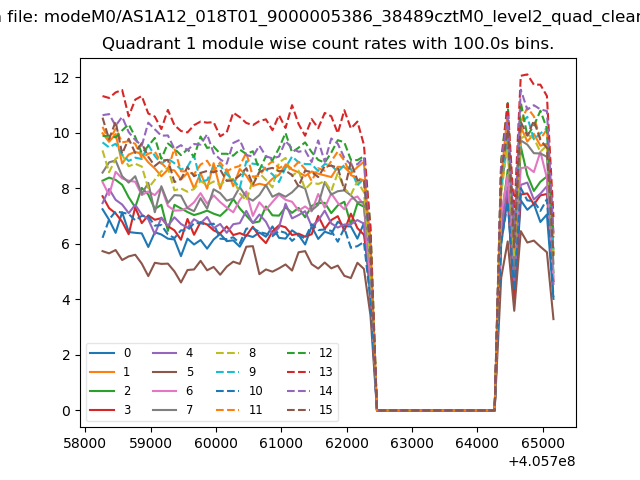
| Module-wise count rates for Quadrant A Data is divided into 100 sec bins |
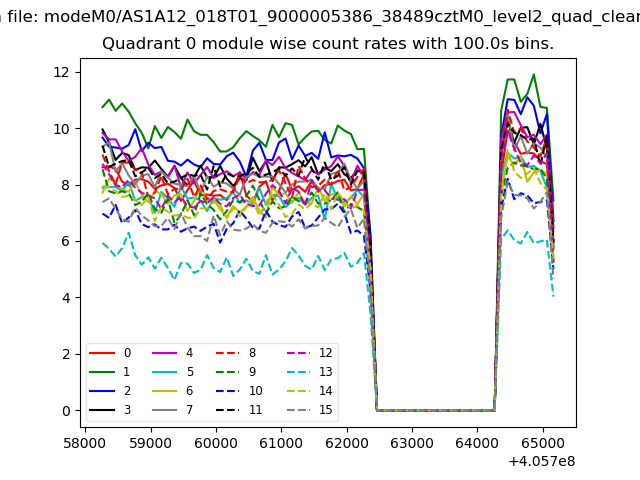 |
 |
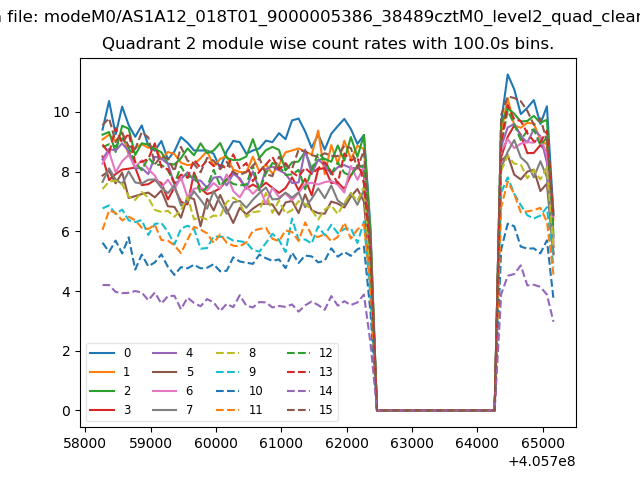
| Module-wise count rates for Quadrant B Data is divided into 100 sec bins |
 |
 |
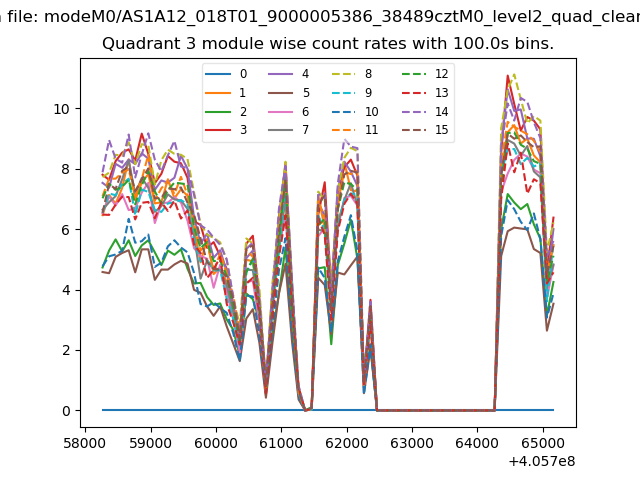
| Module-wise count rates for Quadrant C Data is divided into 100 sec bins |
 |
 |
| Module-wise count rates for Quadrant D Data is divided into 100 sec bins |
 |
 |
| Parameter | Plot |
|---|---|
| CZT HV Monitor | 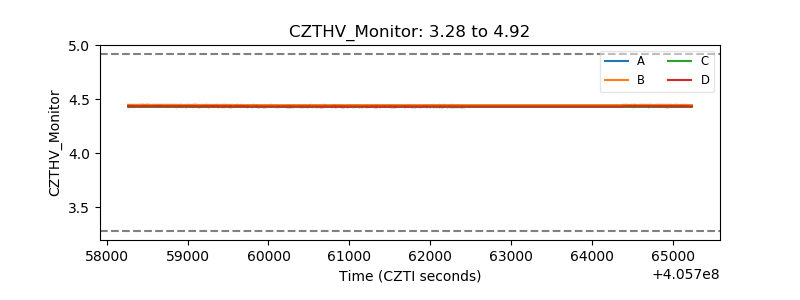 |
| D_VDD | 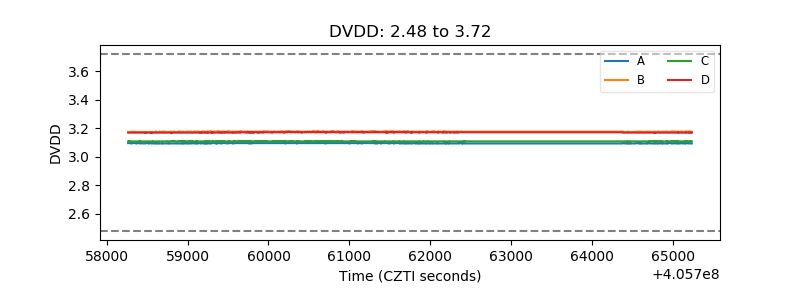 |
| Temperature 1 | 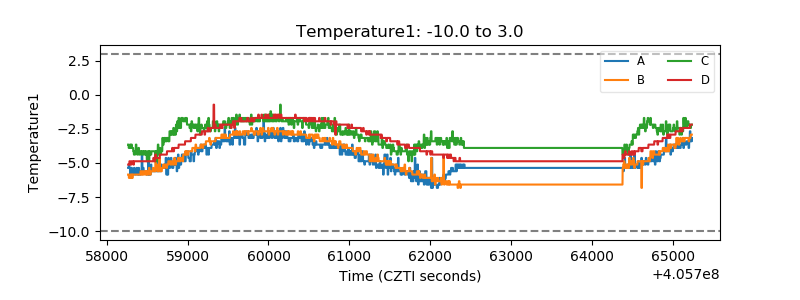 |
| Veto HV Monitor | 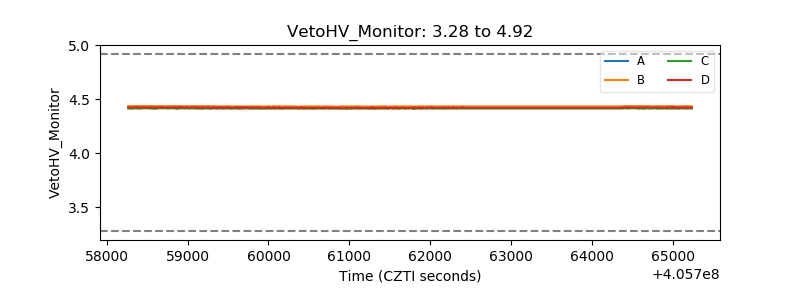 |
| Veto LLD | 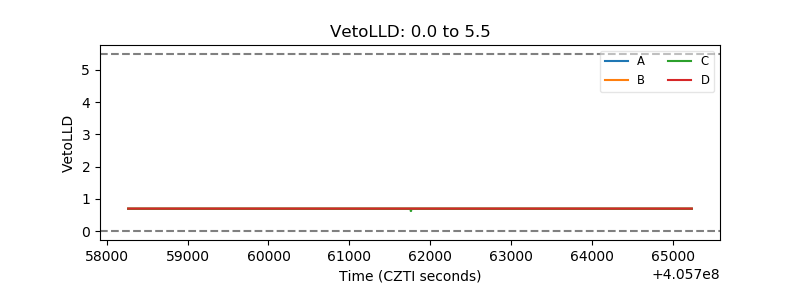 |
| Alpha Counter | 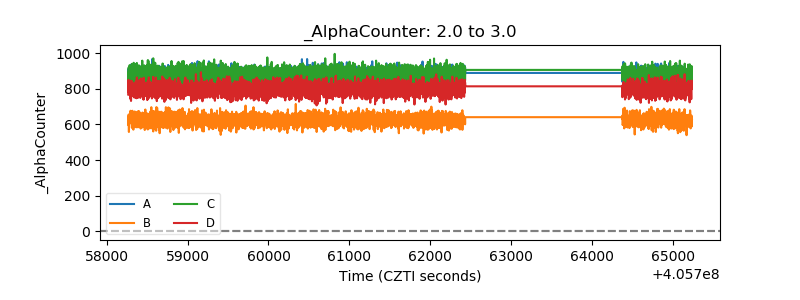 |
| _CPM_Rate | 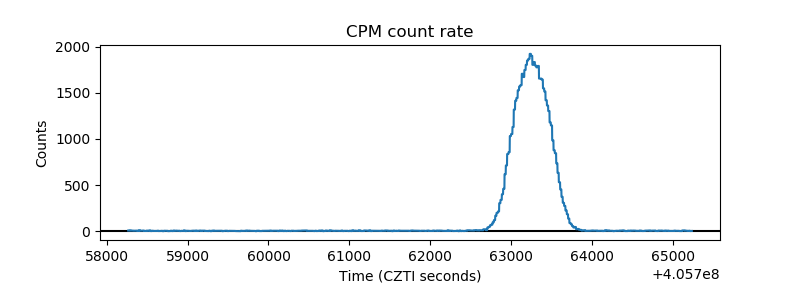 |
| CZT Counter | 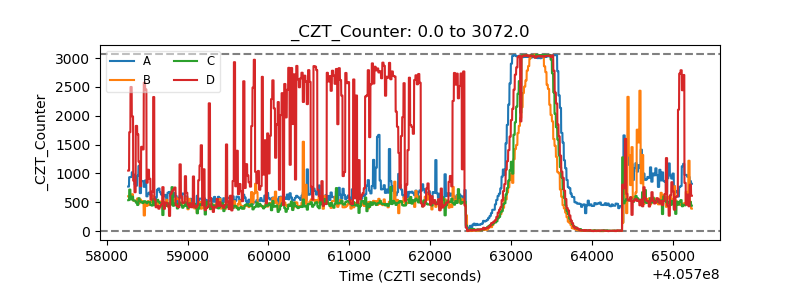 |
| +2.5 Volts monitor | 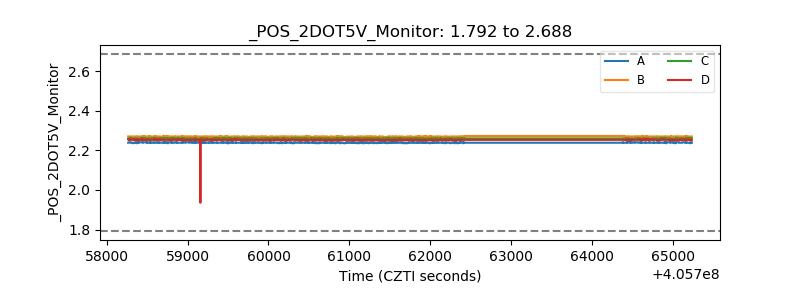 |
| +5 Volts monitor | 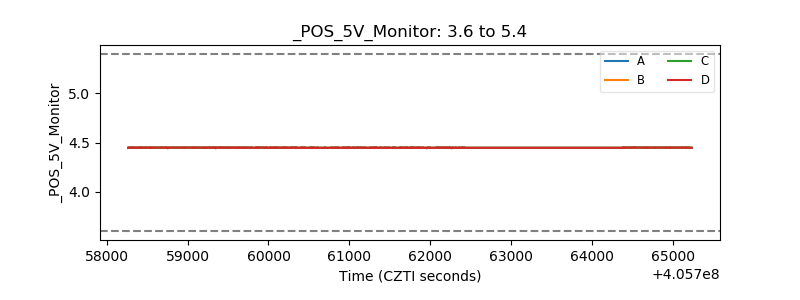 |
| _ROLL_ROT | 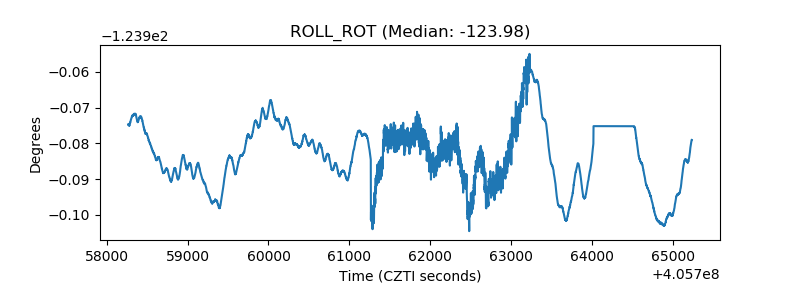 |
| _Roll_DEC | 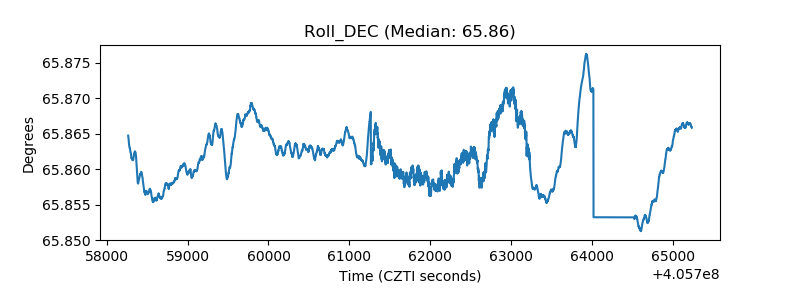 |
| _Roll_RA | 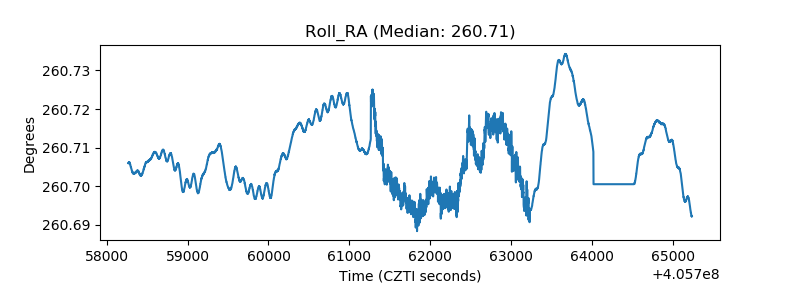 |
| Veto Counter | 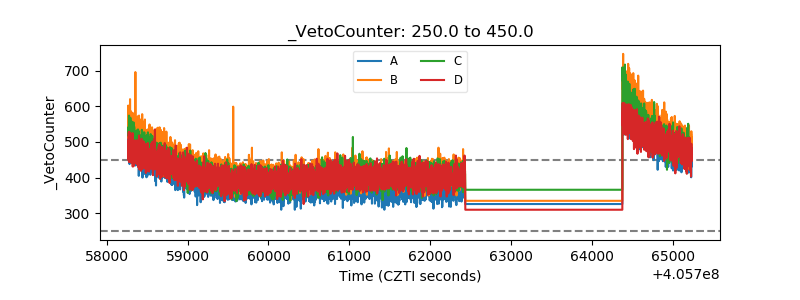 |