| Param | Original file | Final file |
|---|---|---|
| Filename | modeM0/AS1A12_018T01_9000005386_38490cztM0_level2.fits | modeM0/AS1A12_018T01_9000005386_38490cztM0_level2_quad_clean.evt |
| Size (bytes) | 448,073,280 | 88,110,720 |
| Size | 427.3 MB | 84.0 MB |
| Events in quadrant A | 3,979,588 | 656,511 |
| Events in quadrant B | 4,027,052 | 607,888 |
| Events in quadrant C | 2,423,134 | 607,904 |
| Events in quadrant D | 5,775,659 | 452,507 |
| Mode SS | |||
|---|---|---|---|
| Quadrant | BADHDUFLAG | Total packets | Discarded packets |
| A | 0 | 98 | 0 |
| B | 0 | 98 | 0 |
| C | 0 | 98 | 0 |
| D | 0 | 98 | 0 |
| Mode M9 | |||
|---|---|---|---|
| Quadrant | BADHDUFLAG | Total packets | Discarded packets |
| A | 0 | 21 | 0 |
| B | 0 | 21 | 0 |
| C | 0 | 21 | 0 |
| D | 0 | 21 | 0 |
| Mode M0 | |||
|---|---|---|---|
| Quadrant | BADHDUFLAG | Total packets | Discarded packets |
| A | 0 | 15623 | 2 |
| B | 0 | 15001 | 1 |
| C | 0 | 9955 | 1 |
| D | 0 | 20340 | 1 |
| Quadrant | Total seconds | Saturated seconds | Saturation percentage |
|---|---|---|---|
| A | 4900 | 26 | 0.530612% |
| B | 4900 | 499 | 10.183673% |
| C | 4900 | 2 | 0.040816% |
| D | 4900 | 1176 | 24.000000% |
Noise dominated data is calculated using 1-second bins in cleaned event files. If a bin has >2000 counts, and if more than 50% of those come from <1% of pixels, then it is considered to be noise-dominated and hence unusable.
| Quadrant | # 1 sec bins | Bins with >0 counts | Bins with >2000 counts | High rate bins dominated by noise | Noise dominated (total time) | Noise dominated (detector-on time) | Marked lightcurve |
|---|---|---|---|---|---|---|---|
| A | 6933 | 4901 | 7 | 7 | 0.10% | 0.14% | 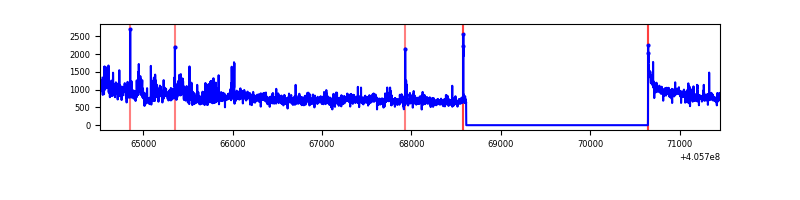 |
| B | 6933 | 4901 | 317 | 317 | 4.57% | 6.47% | 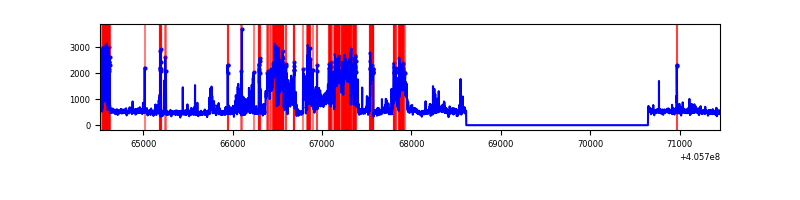 |
| C | 6933 | 4901 | 1 | 1 | 0.01% | 0.02% | 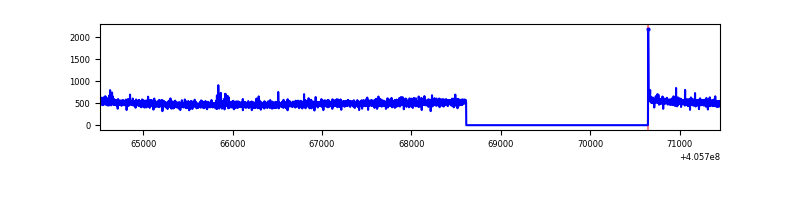 |
| D | 6933 | 4901 | 1147 | 1147 | 16.54% | 23.40% | 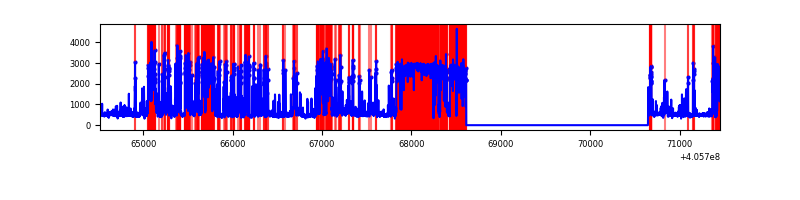 |
Top three noisy pixels from each quadrant. If the there are fewer than three noisy pixels in the level2.evt file, extra rows are filled as -1
| Pixel properties | Quadrant properties | ||||||
|---|---|---|---|---|---|---|---|
| Quadrant | DetID | PixID | Counts | Sigma | Mean | Median | Sigma |
| A | 15 | 222 | 1254436 | 10542.93 | 594 | 584 | 118.9 |
| A | 10 | 83 | 332442 | 2790.41 | 594 | 584 | 118.9 |
| A | 12 | 189 | 44663 | 370.64 | 594 | 584 | 118.9 |
| B | 5 | 184 | 759325 | 7315.59 | 553 | 540 | 103.7 |
| B | 8 | 3 | 629681 | 6065.67 | 553 | 540 | 103.7 |
| B | 4 | 171 | 369216 | 3554.48 | 553 | 540 | 103.7 |
| C | 15 | 214 | 204892 | 1570.04 | 564 | 568 | 130.1 |
| C | 0 | 10 | 8792 | 63.19 | 564 | 568 | 130.1 |
| C | 15 | 159 | 5845 | 40.55 | 564 | 568 | 130.1 |
| D | 12 | 227 | 3461358 | 28099.24 | 508 | 493 | 123.2 |
| D | 2 | 250 | 85653 | 691.43 | 508 | 493 | 123.2 |
| D | 12 | 235 | 82127 | 662.8 | 508 | 493 | 123.2 |
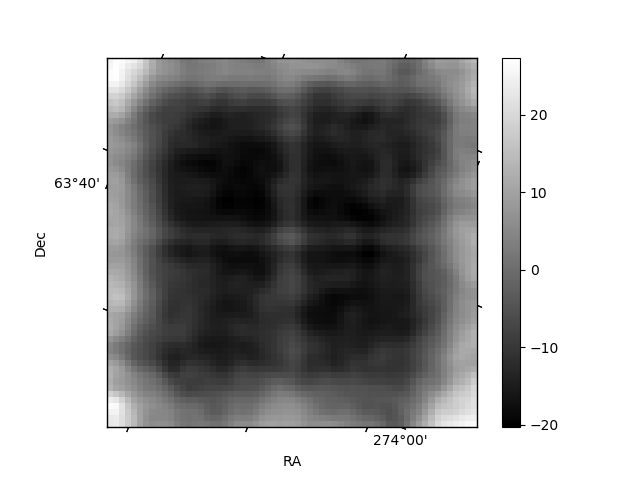
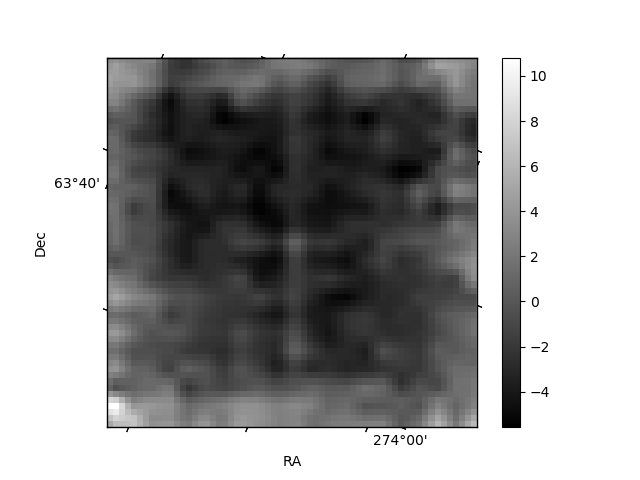
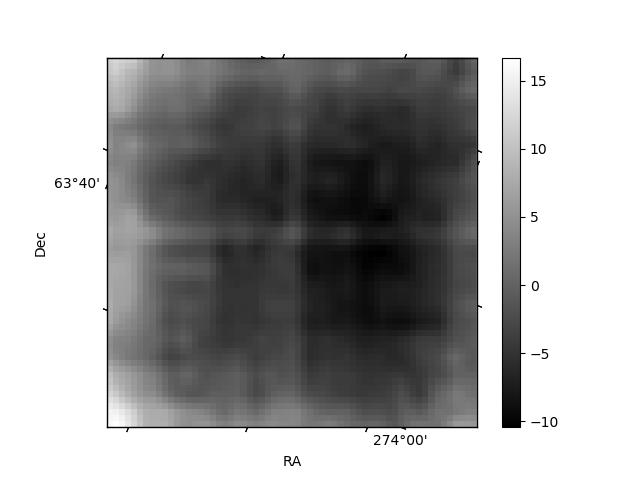
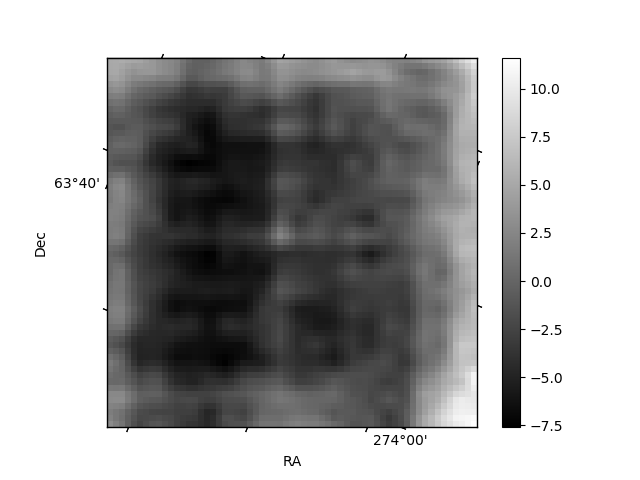
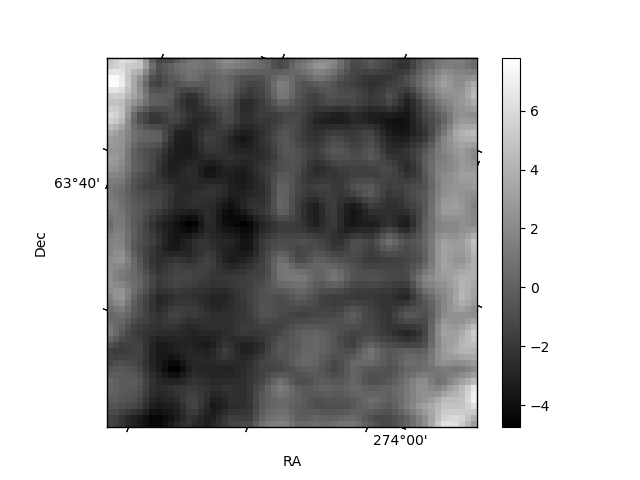
Histogram calculated using DETX and DETY for each event in the final _common_clean file
| Quadrant A | 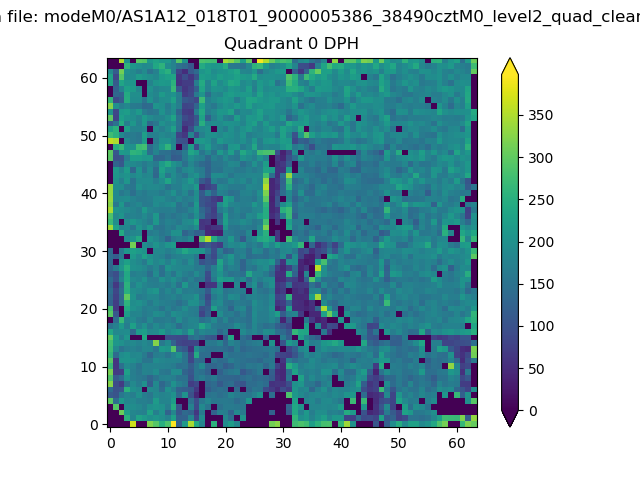 |
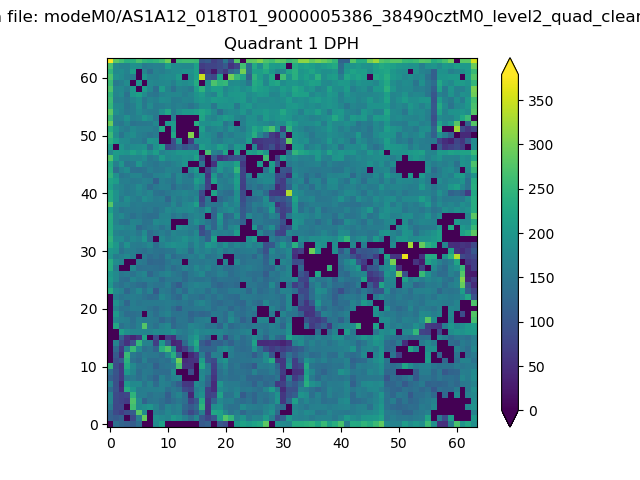 |
Quadrant B |
|---|---|---|---|
| Quadrant D | 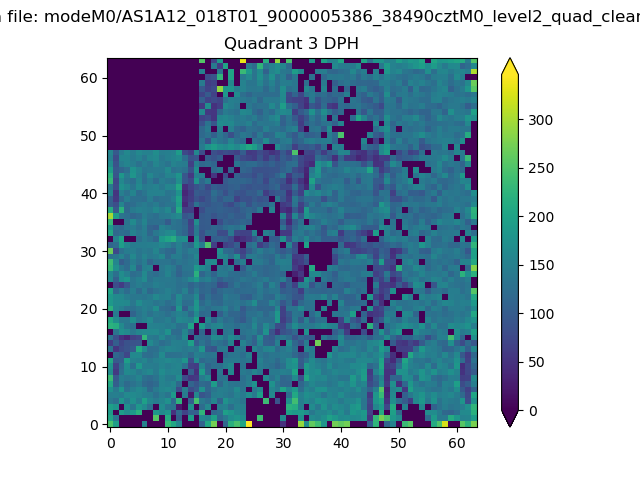 |
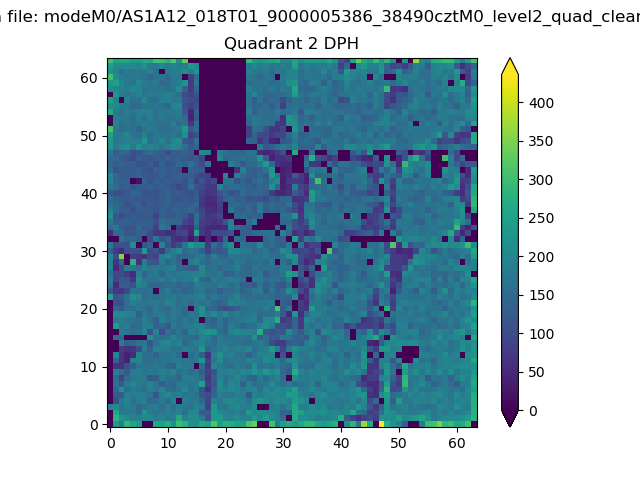 |
Quadrant C |
| Plot type | Count rate plots | Images |
|---|---|---|
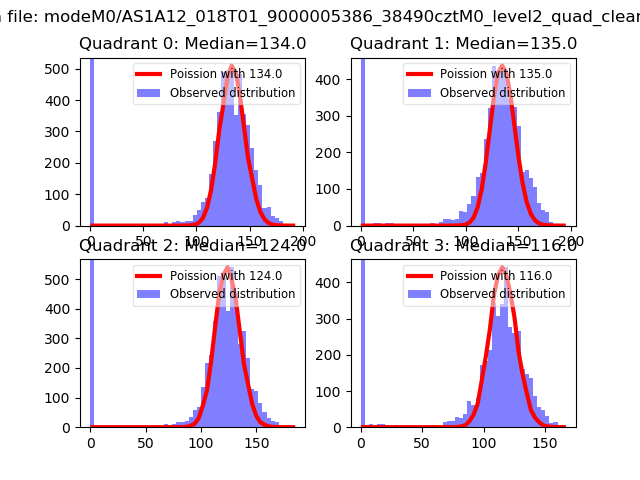
| Comparison with Poisson distribution Blue bars denote a histogram of data divided into 1 sec bins. Red curve is a Poisson curve with rate = median count rate of data. |
 |
 |
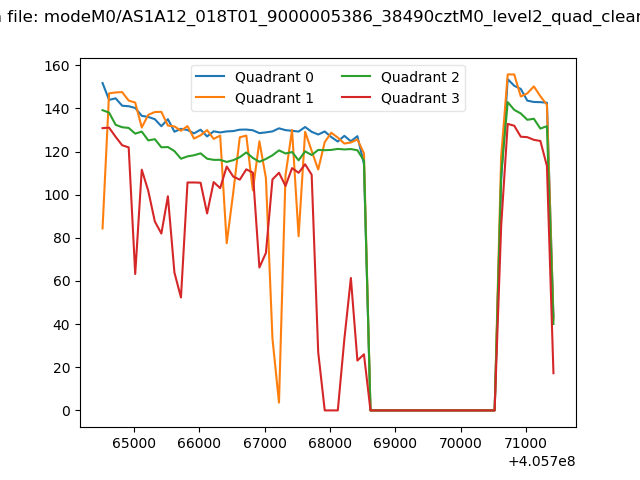
| Quadrant-wise count rates Data is divided into 100 sec bins |
 |
|
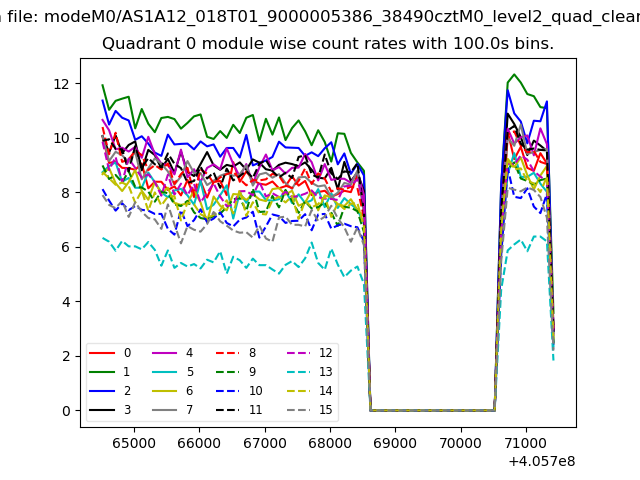
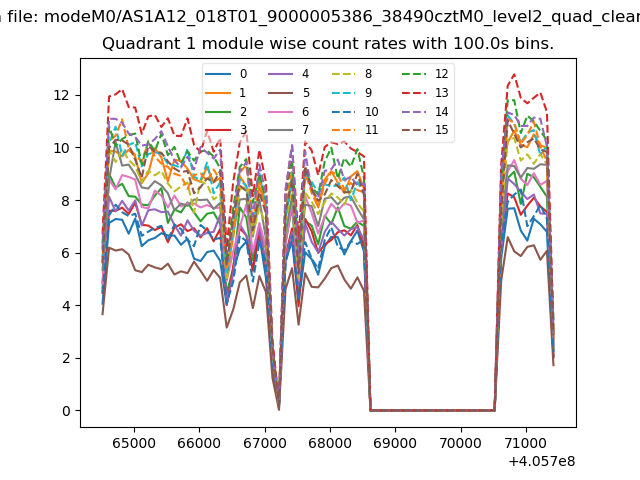
| Module-wise count rates for Quadrant A Data is divided into 100 sec bins |
 |
 |
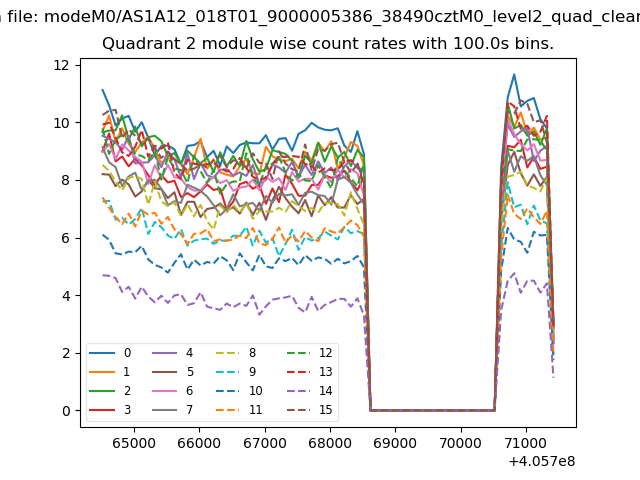
| Module-wise count rates for Quadrant B Data is divided into 100 sec bins |
 |
 |
| Module-wise count rates for Quadrant C Data is divided into 100 sec bins |
 |
 |
| Module-wise count rates for Quadrant D Data is divided into 100 sec bins |
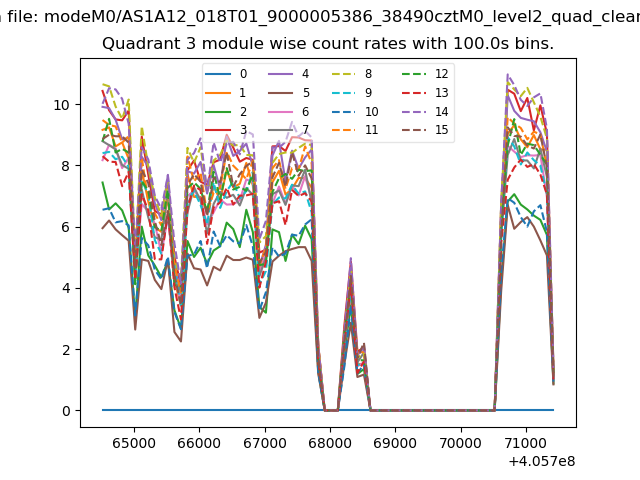 |
 |
| Parameter | Plot |
|---|---|
| CZT HV Monitor | 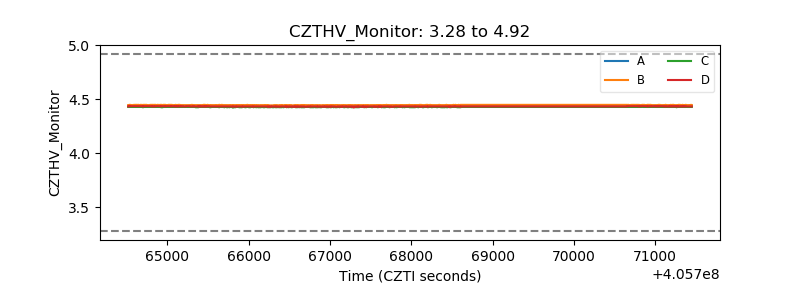 |
| D_VDD | 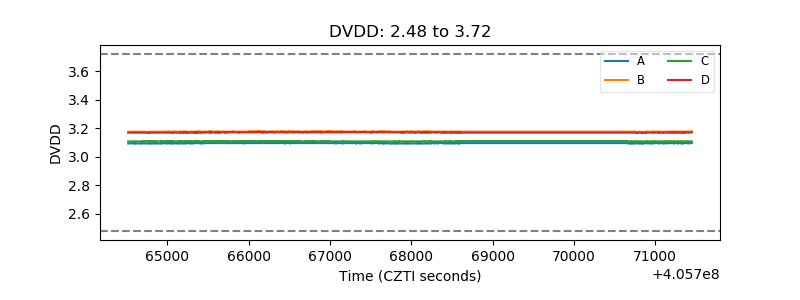 |
| Temperature 1 | 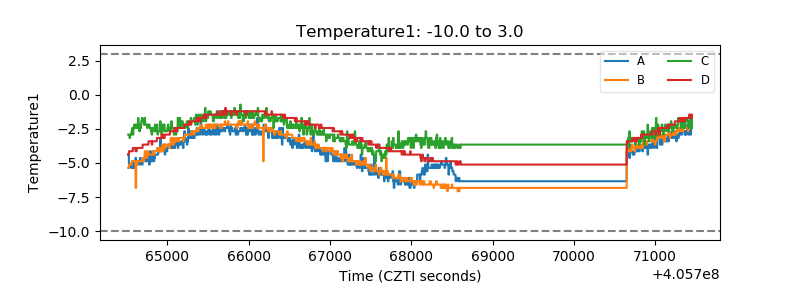 |
| Veto HV Monitor | 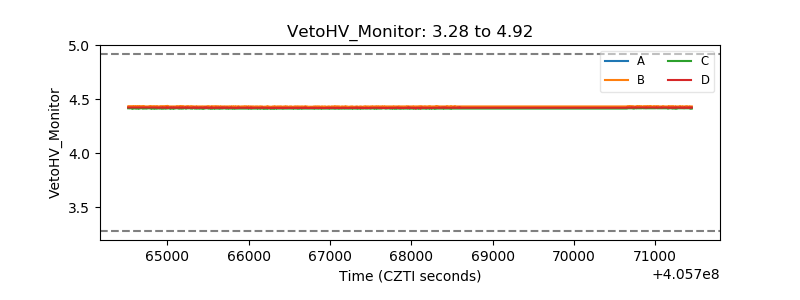 |
| Veto LLD | 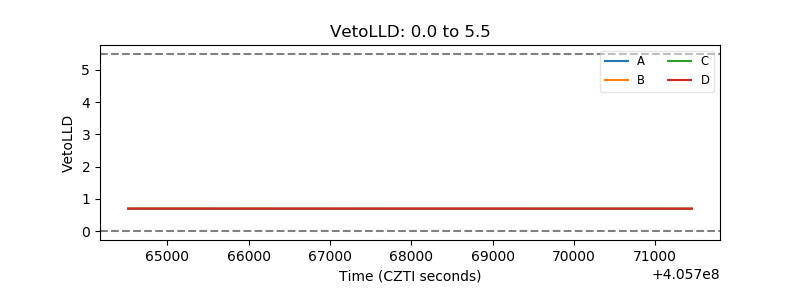 |
| Alpha Counter | 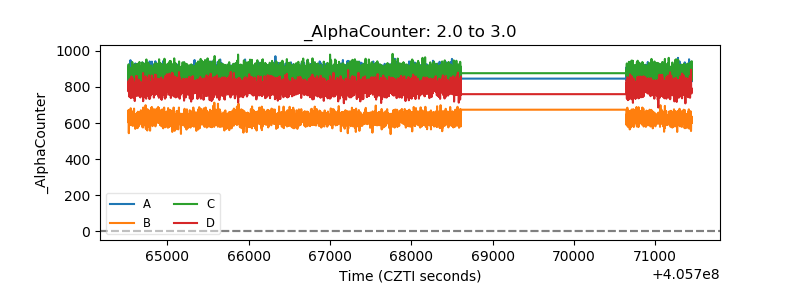 |
| _CPM_Rate | 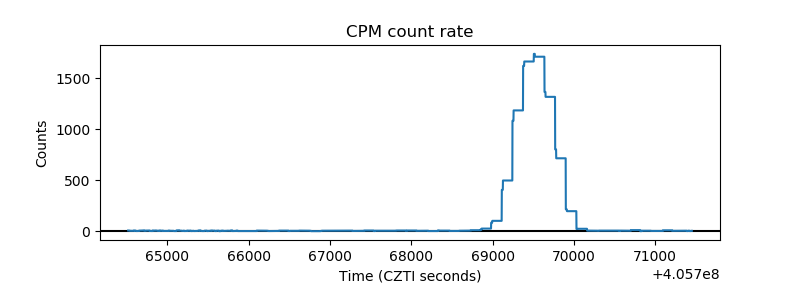 |
| CZT Counter | 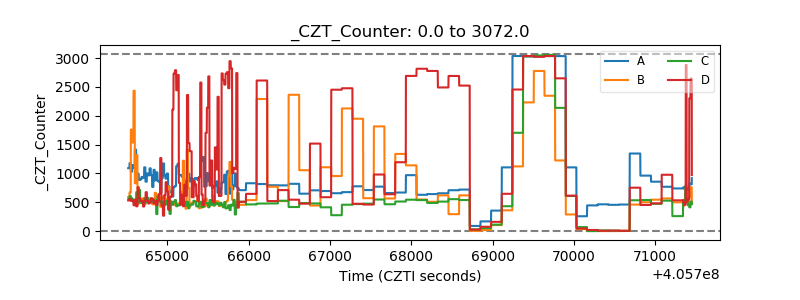 |
| +2.5 Volts monitor | 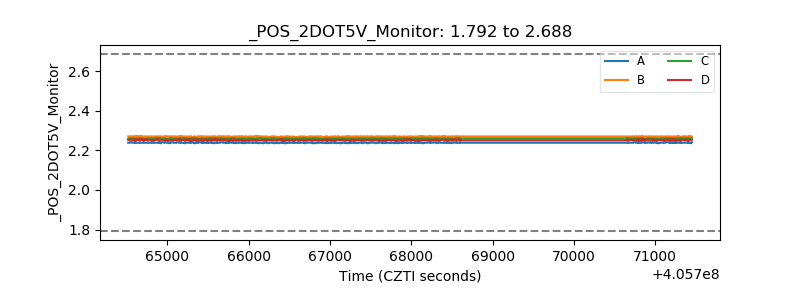 |
| +5 Volts monitor | 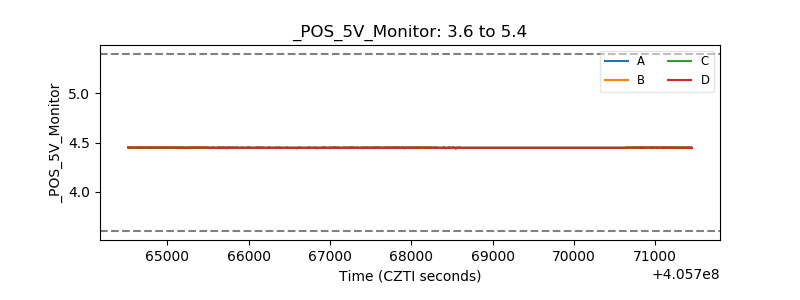 |
| _ROLL_ROT | 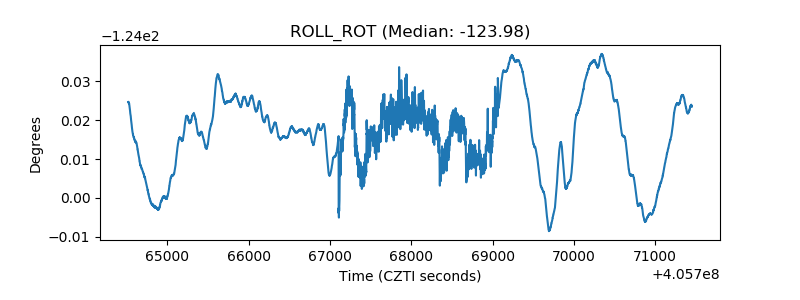 |
| _Roll_DEC | 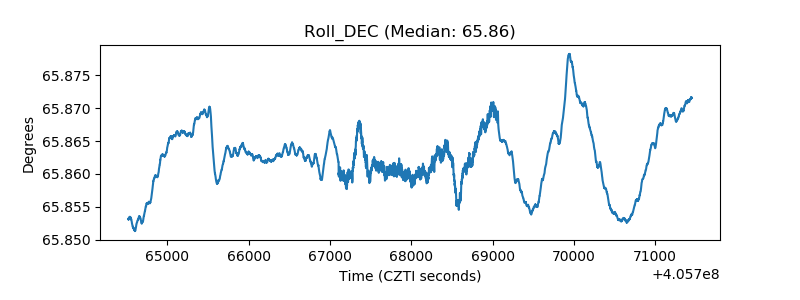 |
| _Roll_RA | 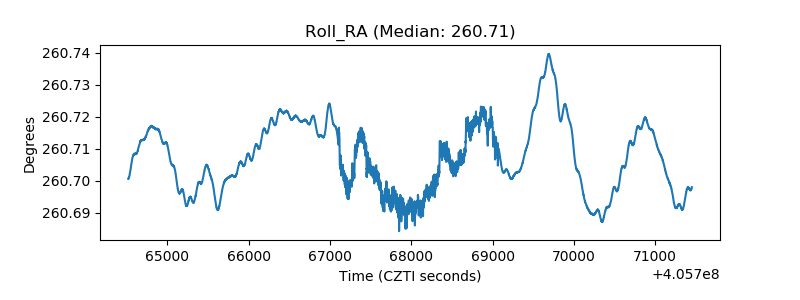 |
| Veto Counter | 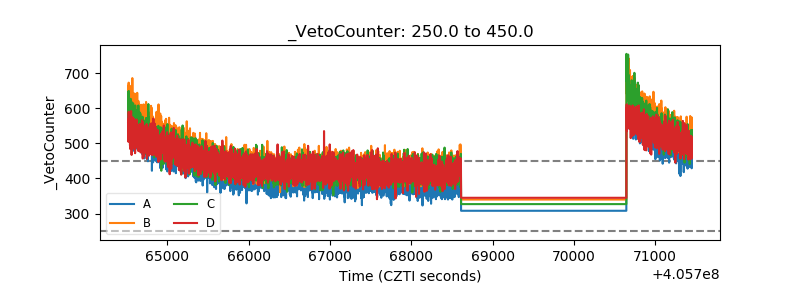 |