| Param | Original file | Final file |
|---|---|---|
| Filename | modeM0/AS1A12_018T01_9000005386_38491cztM0_level2.fits | modeM0/AS1A12_018T01_9000005386_38491cztM0_level2_quad_clean.evt |
| Size (bytes) | 385,269,120 | 91,987,200 |
| Size | 367.4 MB | 87.7 MB |
| Events in quadrant A | 3,751,707 | 656,530 |
| Events in quadrant B | 2,772,763 | 658,149 |
| Events in quadrant C | 2,446,360 | 614,247 |
| Events in quadrant D | 4,909,599 | 512,596 |
| Mode SS | |||
|---|---|---|---|
| Quadrant | BADHDUFLAG | Total packets | Discarded packets |
| A | 0 | 102 | 0 |
| B | 0 | 102 | 0 |
| C | 0 | 102 | 0 |
| D | 0 | 102 | 0 |
| Mode M9 | |||
|---|---|---|---|
| Quadrant | BADHDUFLAG | Total packets | Discarded packets |
| A | 0 | 21 | 0 |
| B | 0 | 21 | 0 |
| C | 0 | 21 | 0 |
| D | 0 | 21 | 0 |
| Mode M0 | |||
|---|---|---|---|
| Quadrant | BADHDUFLAG | Total packets | Discarded packets |
| A | 0 | 15050 | 3 |
| B | 0 | 11212 | 2 |
| C | 0 | 9948 | 2 |
| D | 0 | 17865 | 2 |
| Quadrant | Total seconds | Saturated seconds | Saturation percentage |
|---|---|---|---|
| A | 4899 | 34 | 0.694019% |
| B | 4899 | 60 | 1.224740% |
| C | 4899 | 7 | 0.142886% |
| D | 4899 | 694 | 14.166156% |
Noise dominated data is calculated using 1-second bins in cleaned event files. If a bin has >2000 counts, and if more than 50% of those come from <1% of pixels, then it is considered to be noise-dominated and hence unusable.
| Quadrant | # 1 sec bins | Bins with >0 counts | Bins with >2000 counts | High rate bins dominated by noise | Noise dominated (total time) | Noise dominated (detector-on time) | Marked lightcurve |
|---|---|---|---|---|---|---|---|
| A | 7022 | 4900 | 14 | 14 | 0.20% | 0.29% | 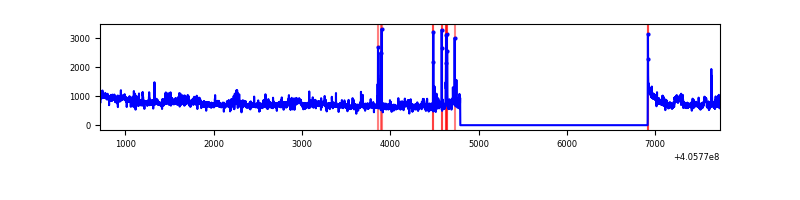 |
| B | 7022 | 4900 | 39 | 39 | 0.56% | 0.80% | 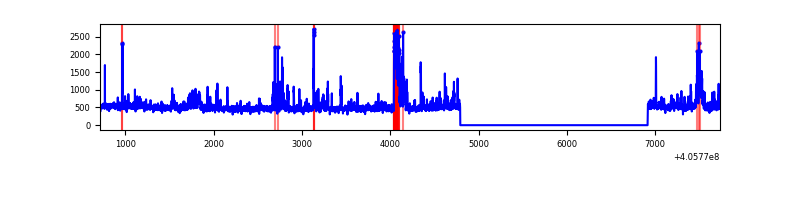 |
| C | 7022 | 4900 | 2 | 2 | 0.03% | 0.04% | 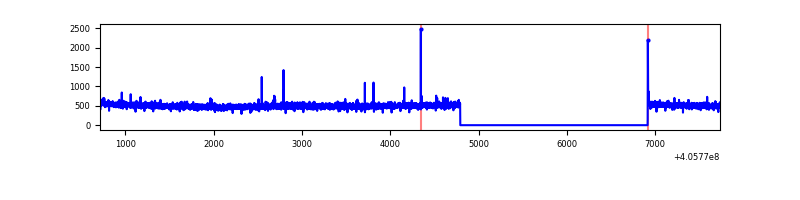 |
| D | 7022 | 4900 | 632 | 632 | 9.00% | 12.90% | 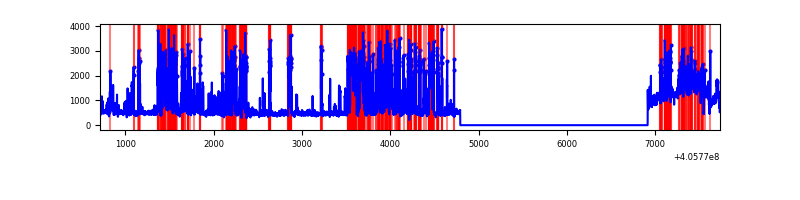 |
Top three noisy pixels from each quadrant. If the there are fewer than three noisy pixels in the level2.evt file, extra rows are filled as -1
| Pixel properties | Quadrant properties | ||||||
|---|---|---|---|---|---|---|---|
| Quadrant | DetID | PixID | Counts | Sigma | Mean | Median | Sigma |
| A | 15 | 222 | 998066 | 8475.64 | 593 | 582 | 117.7 |
| A | 10 | 83 | 354334 | 3005.83 | 593 | 582 | 117.7 |
| A | 9 | 143 | 84074 | 709.43 | 593 | 582 | 117.7 |
| B | 5 | 184 | 238780 | 2200.23 | 582 | 569 | 108.3 |
| B | 0 | 183 | 76101 | 697.65 | 582 | 569 | 108.3 |
| B | 4 | 171 | 52925 | 483.59 | 582 | 569 | 108.3 |
| C | 15 | 214 | 204761 | 1565.59 | 569 | 573 | 130.4 |
| C | 0 | 10 | 7995 | 56.91 | 569 | 573 | 130.4 |
| C | 3 | 9 | 7772 | 55.2 | 569 | 573 | 130.4 |
| D | 13 | 249 | 1648937 | 12687.42 | 542 | 529 | 129.9 |
| D | 7 | 223 | 601030 | 4621.92 | 542 | 529 | 129.9 |
| D | 12 | 227 | 300415 | 2308.15 | 542 | 529 | 129.9 |
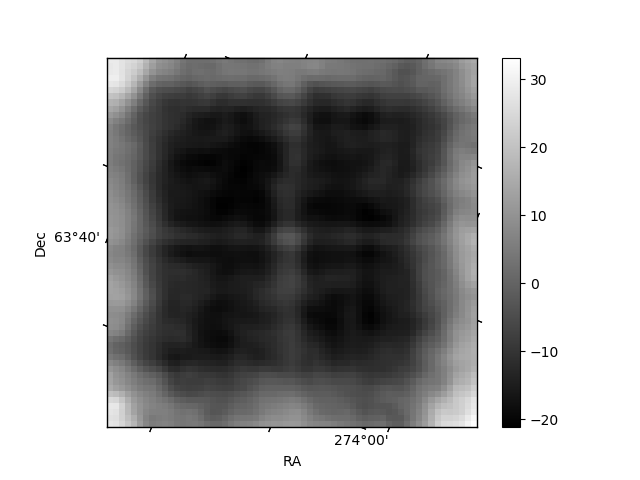
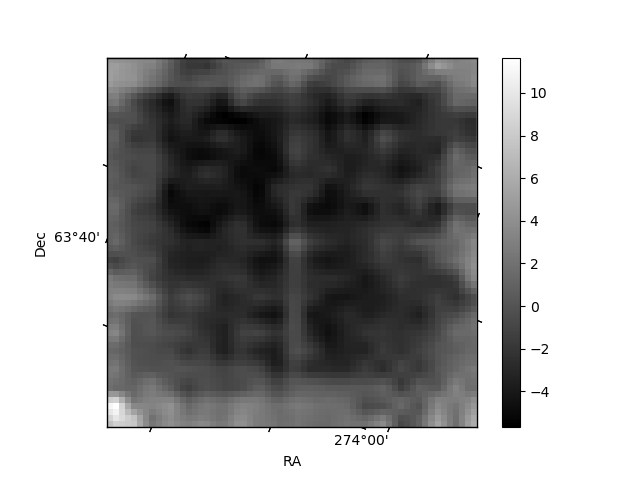
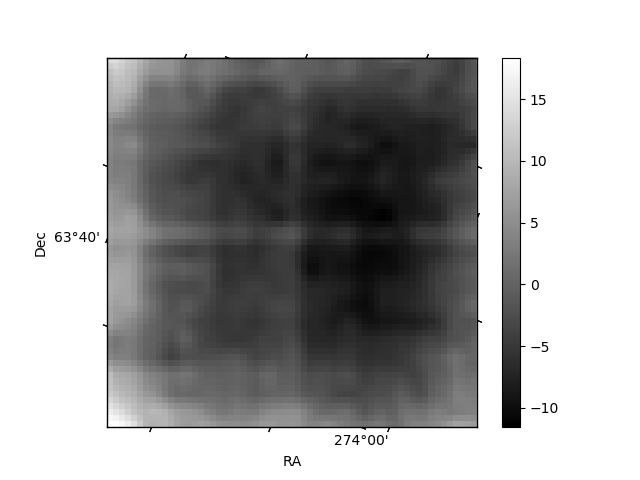
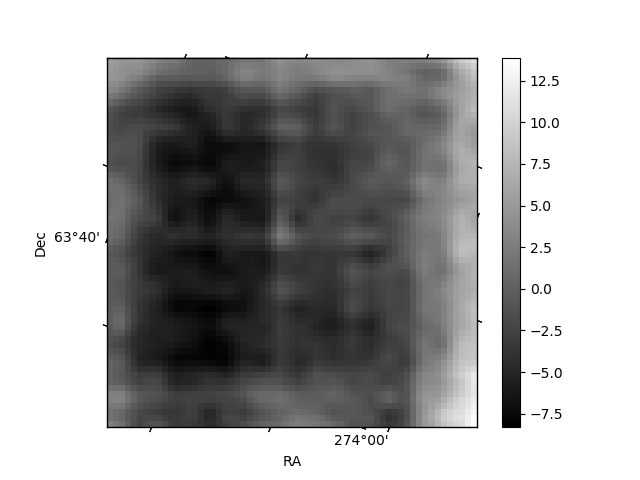
Histogram calculated using DETX and DETY for each event in the final _common_clean file
| Quadrant A | 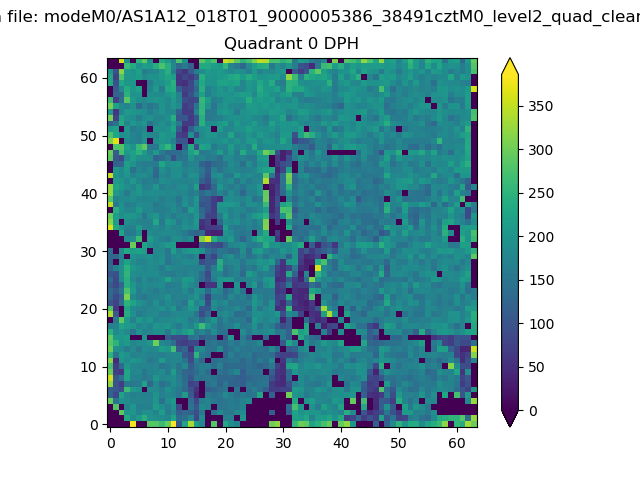 |
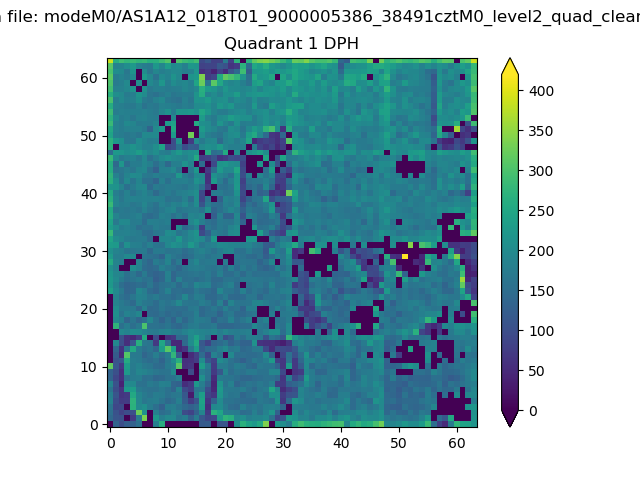 |
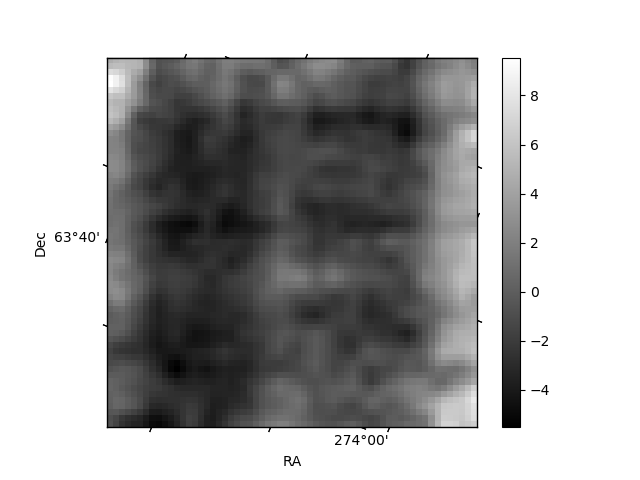
Quadrant B |
|---|---|---|---|
| Quadrant D | 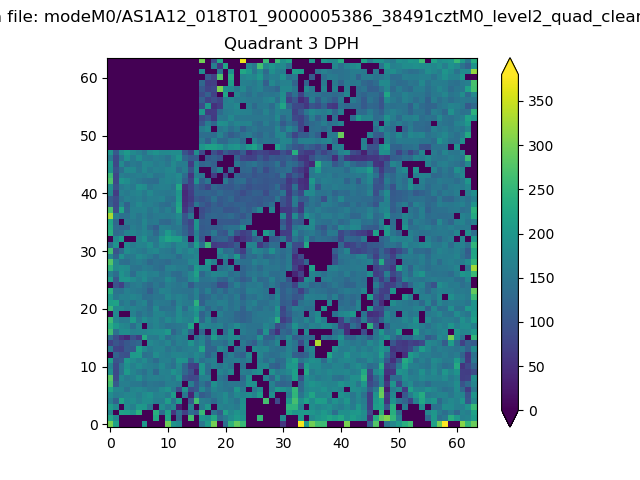 |
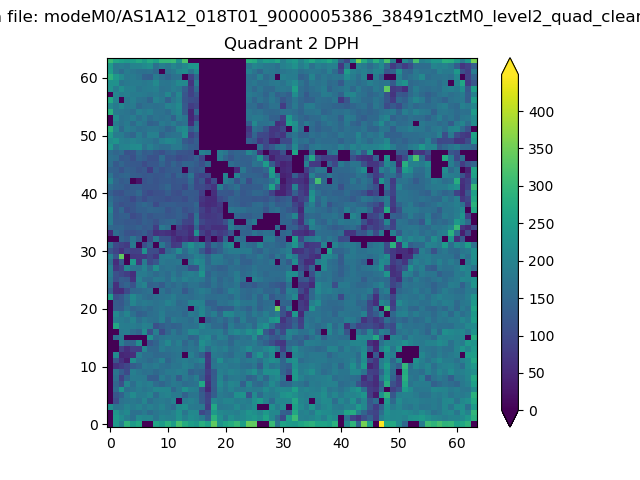 |
Quadrant C |
| Plot type | Count rate plots | Images |
|---|---|---|
| Comparison with Poisson distribution Blue bars denote a histogram of data divided into 1 sec bins. Red curve is a Poisson curve with rate = median count rate of data. |
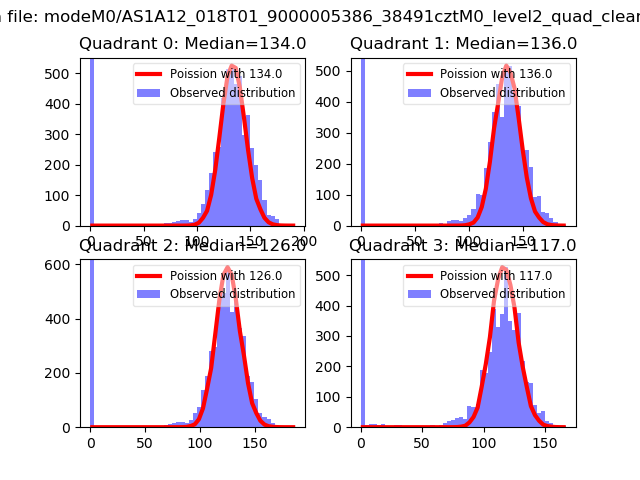 |
 |
| Quadrant-wise count rates Data is divided into 100 sec bins |
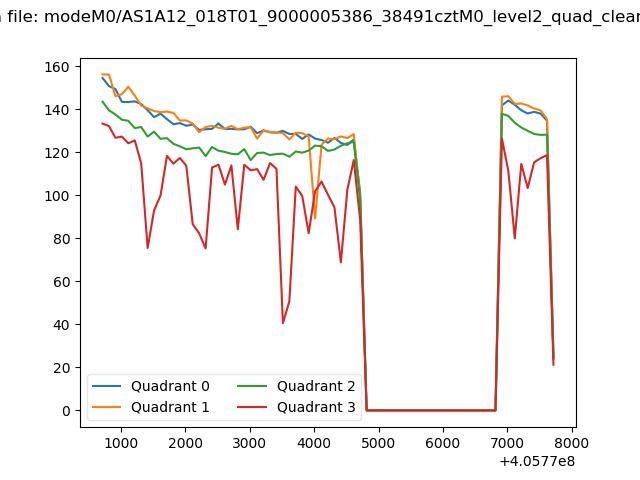 |
|
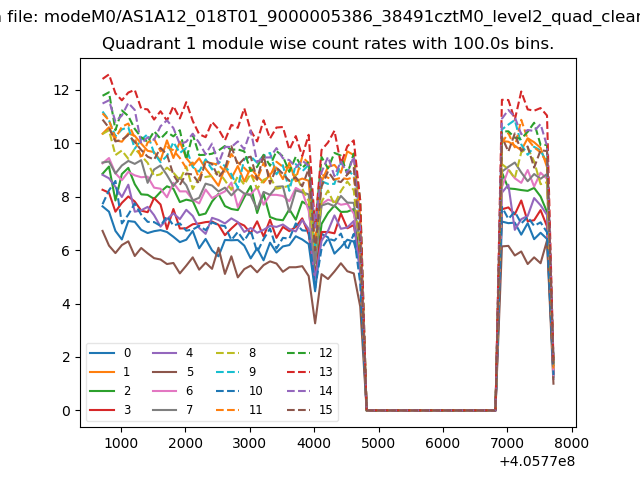
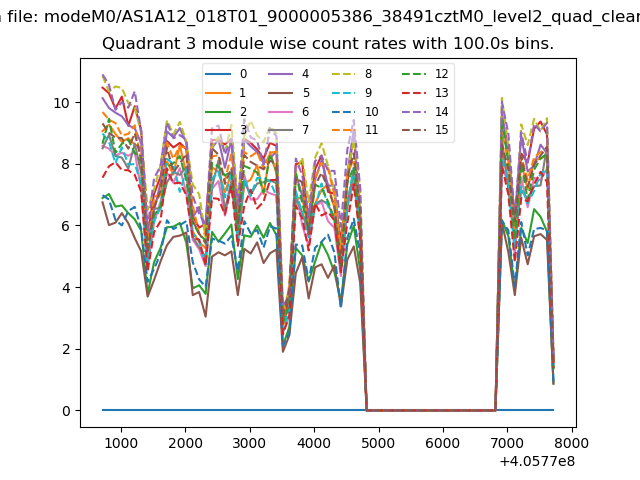
| Module-wise count rates for Quadrant A Data is divided into 100 sec bins |
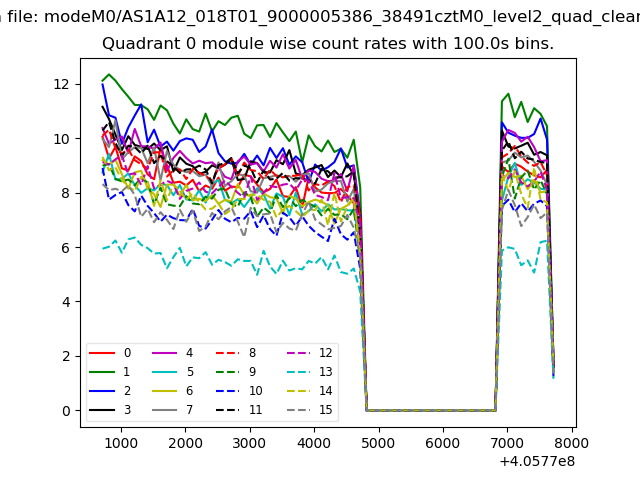 |
 |
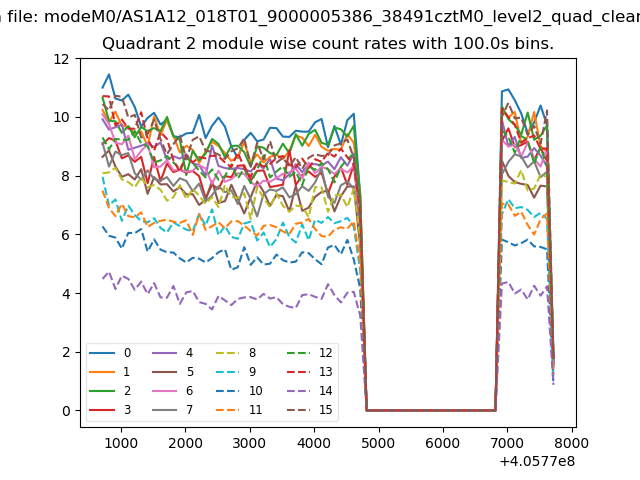
| Module-wise count rates for Quadrant B Data is divided into 100 sec bins |
 |
 |
| Module-wise count rates for Quadrant C Data is divided into 100 sec bins |
 |
 |
| Module-wise count rates for Quadrant D Data is divided into 100 sec bins |
 |
 |
| Parameter | Plot |
|---|---|
| CZT HV Monitor | 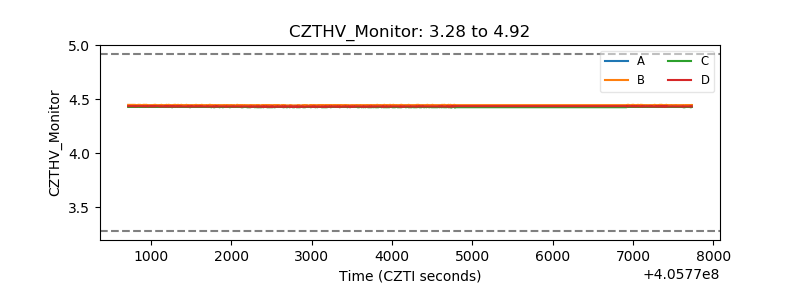 |
| D_VDD | 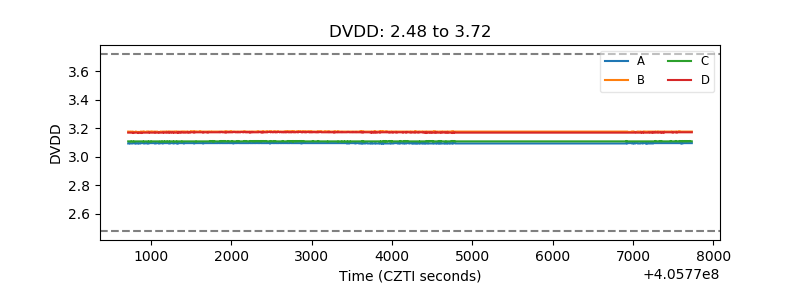 |
| Temperature 1 | 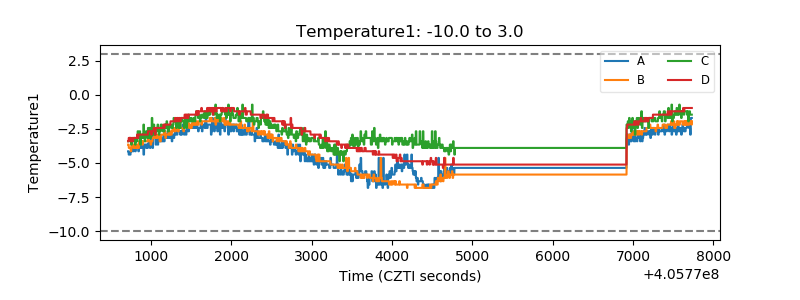 |
| Veto HV Monitor | 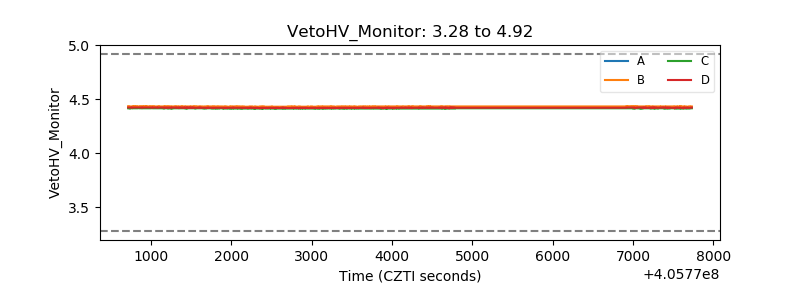 |
| Veto LLD |  |
| Alpha Counter | 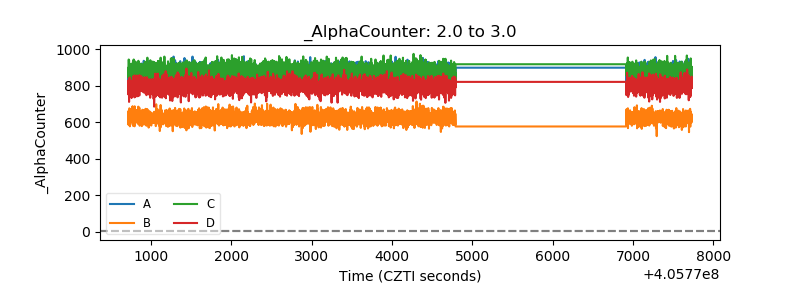 |
| _CPM_Rate | 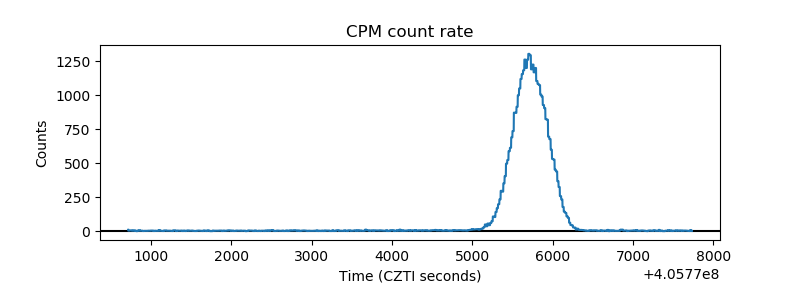 |
| CZT Counter | 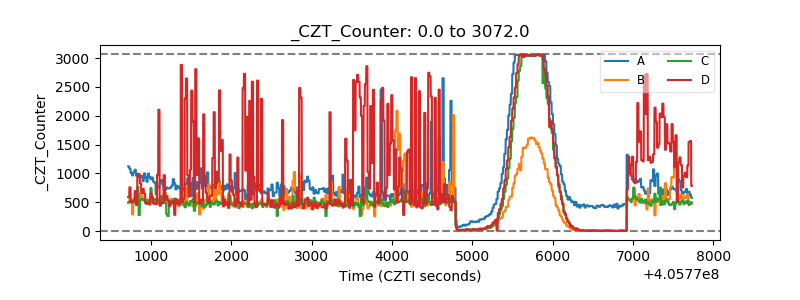 |
| +2.5 Volts monitor | 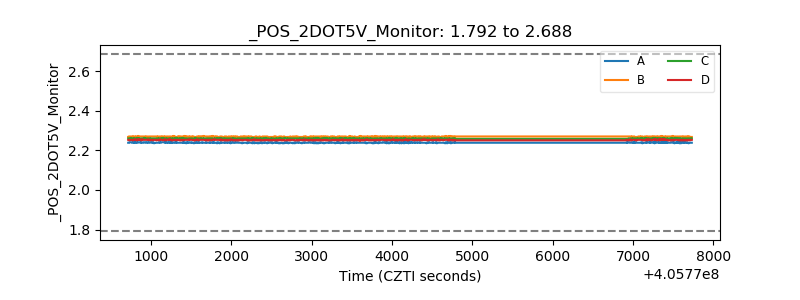 |
| +5 Volts monitor | 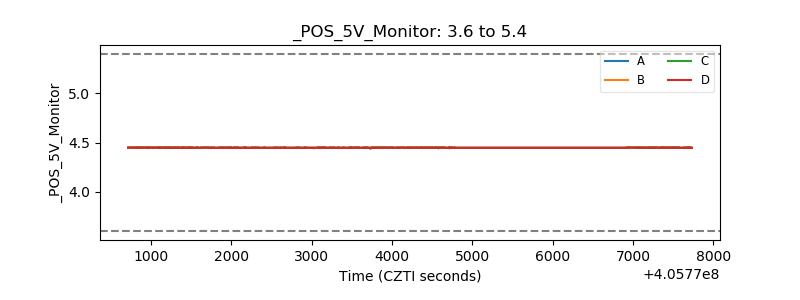 |
| _ROLL_ROT |  |
| _Roll_DEC | 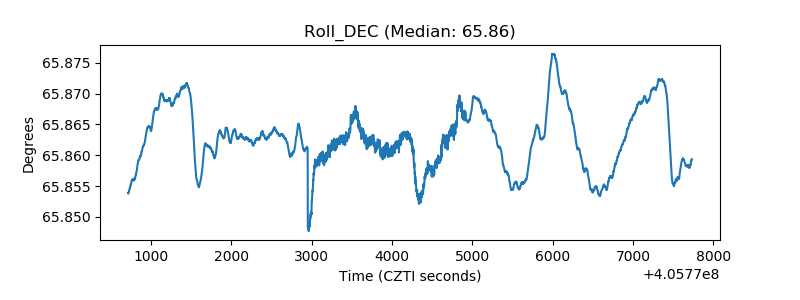 |
| _Roll_RA | 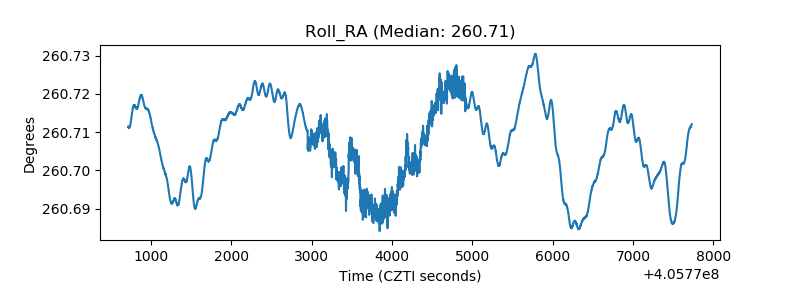 |
| Veto Counter | 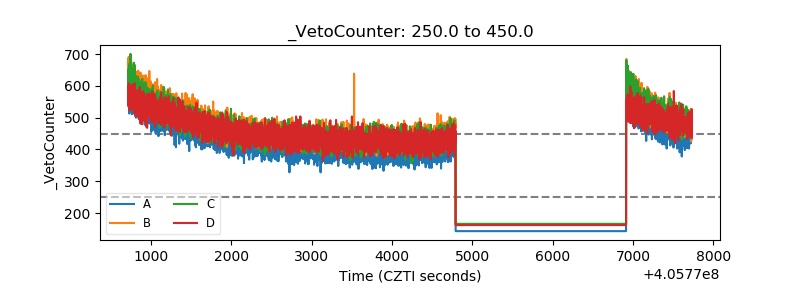 |