| Param | Original file | Final file |
|---|---|---|
| Filename | modeM0/AS1A12_018T01_9000005386_38492cztM0_level2.fits | modeM0/AS1A12_018T01_9000005386_38492cztM0_level2_quad_clean.evt |
| Size (bytes) | 354,850,560 | 89,769,600 |
| Size | 338.4 MB | 85.6 MB |
| Events in quadrant A | 3,283,614 | 623,992 |
| Events in quadrant B | 3,262,526 | 613,473 |
| Events in quadrant C | 2,392,760 | 595,211 |
| Events in quadrant D | 3,816,457 | 542,571 |
| Mode SS | |||
|---|---|---|---|
| Quadrant | BADHDUFLAG | Total packets | Discarded packets |
| A | 0 | 102 | 0 |
| B | 0 | 102 | 0 |
| C | 0 | 102 | 0 |
| D | 0 | 102 | 0 |
| Mode M9 | |||
|---|---|---|---|
| Quadrant | BADHDUFLAG | Total packets | Discarded packets |
| A | 0 | 27 | 0 |
| B | 0 | 27 | 0 |
| C | 0 | 27 | 0 |
| D | 0 | 28 | 0 |
| Mode M0 | |||
|---|---|---|---|
| Quadrant | BADHDUFLAG | Total packets | Discarded packets |
| A | 0 | 13140 | 3 |
| B | 0 | 12775 | 2 |
| C | 0 | 9878 | 2 |
| D | 0 | 14664 | 2 |
| Quadrant | Total seconds | Saturated seconds | Saturation percentage |
|---|---|---|---|
| A | 4884 | 57 | 1.167076% |
| B | 4884 | 206 | 4.217854% |
| C | 4884 | 6 | 0.122850% |
| D | 4884 | 194 | 3.972154% |
Noise dominated data is calculated using 1-second bins in cleaned event files. If a bin has >2000 counts, and if more than 50% of those come from <1% of pixels, then it is considered to be noise-dominated and hence unusable.
| Quadrant | # 1 sec bins | Bins with >0 counts | Bins with >2000 counts | High rate bins dominated by noise | Noise dominated (total time) | Noise dominated (detector-on time) | Marked lightcurve |
|---|---|---|---|---|---|---|---|
| A | 7037 | 4885 | 39 | 39 | 0.55% | 0.80% | 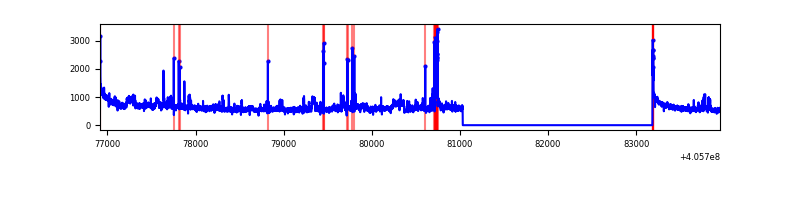 |
| B | 7037 | 4885 | 170 | 170 | 2.42% | 3.48% | 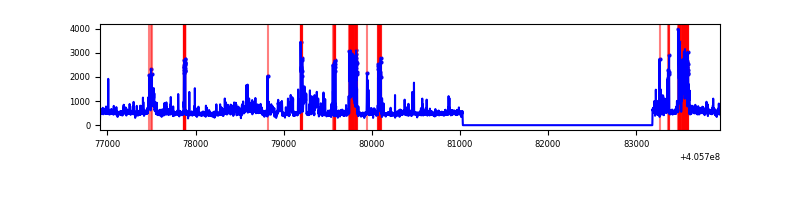 |
| C | 7037 | 4885 | 2 | 2 | 0.03% | 0.04% | 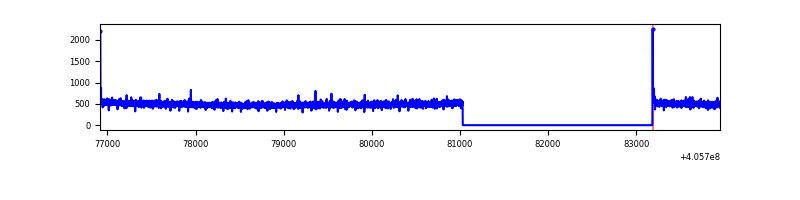 |
| D | 7037 | 4885 | 180 | 180 | 2.56% | 3.68% | 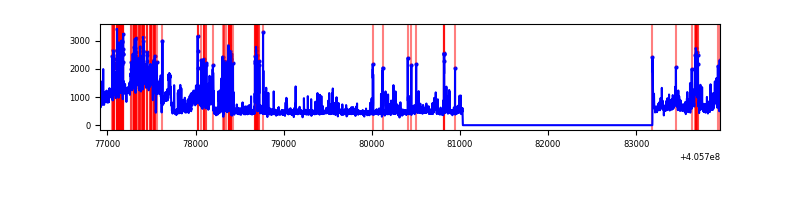 |
Top three noisy pixels from each quadrant. If the there are fewer than three noisy pixels in the level2.evt file, extra rows are filled as -1
| Pixel properties | Quadrant properties | ||||||
|---|---|---|---|---|---|---|---|
| Quadrant | DetID | PixID | Counts | Sigma | Mean | Median | Sigma |
| A | 15 | 222 | 530709 | 4631.83 | 574 | 564 | 114.5 |
| A | 10 | 83 | 386577 | 3372.56 | 574 | 564 | 114.5 |
| A | 9 | 143 | 100052 | 869.22 | 574 | 564 | 114.5 |
| B | 5 | 184 | 448593 | 4293.03 | 559 | 546 | 104.4 |
| B | 4 | 171 | 219184 | 2094.92 | 559 | 546 | 104.4 |
| B | 8 | 3 | 168133 | 1605.76 | 559 | 546 | 104.4 |
| C | 15 | 214 | 203425 | 1577.84 | 557 | 560 | 128.6 |
| C | 0 | 10 | 16027 | 120.3 | 557 | 560 | 128.6 |
| C | 13 | 61 | 3722 | 24.59 | 557 | 560 | 128.6 |
| D | 7 | 223 | 663420 | 4944.74 | 557 | 544 | 134.1 |
| D | 12 | 235 | 273013 | 2032.49 | 557 | 544 | 134.1 |
| D | 13 | 249 | 251703 | 1873.53 | 557 | 544 | 134.1 |
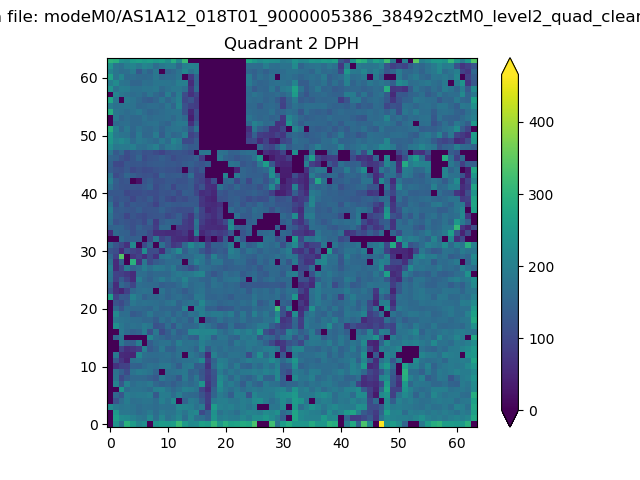
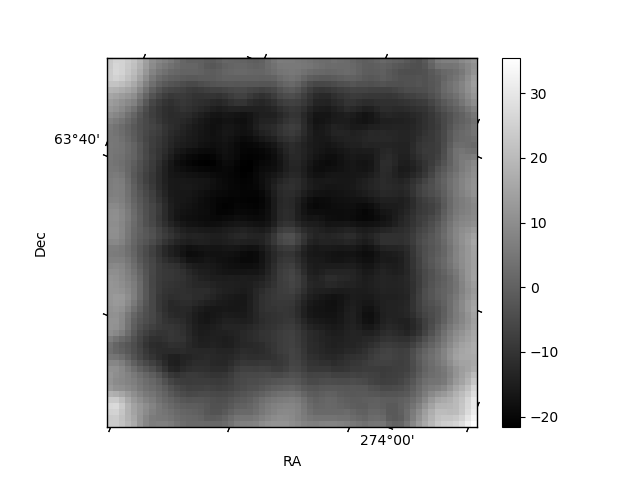
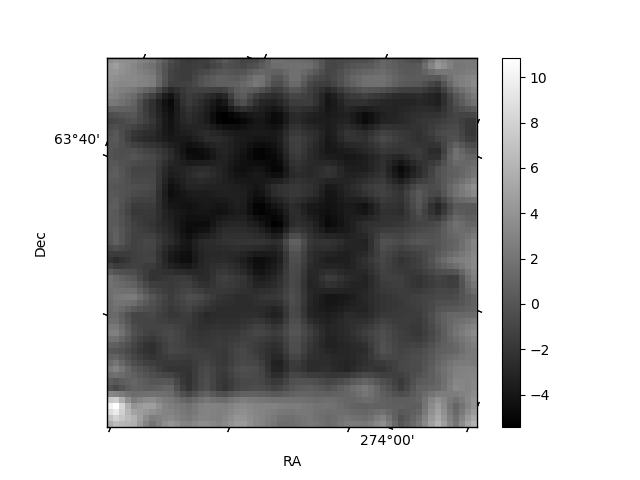
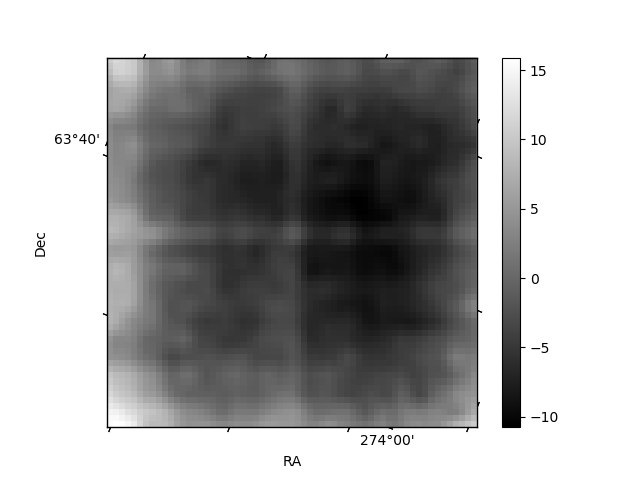
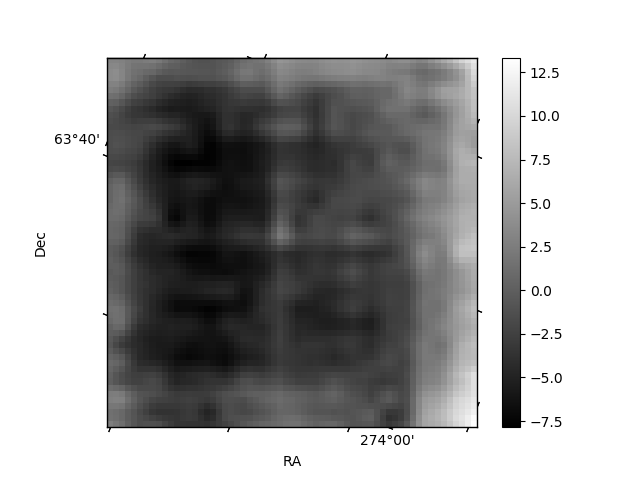
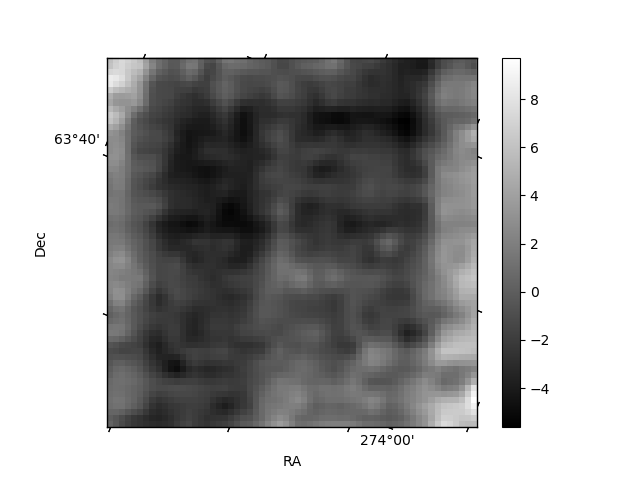
Histogram calculated using DETX and DETY for each event in the final _common_clean file
| Quadrant A | 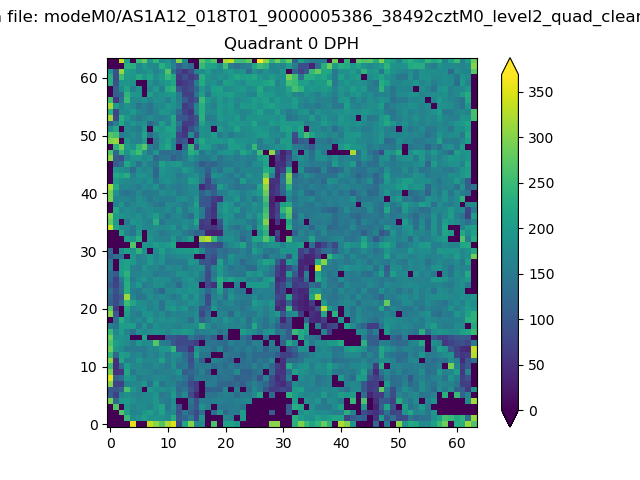 |
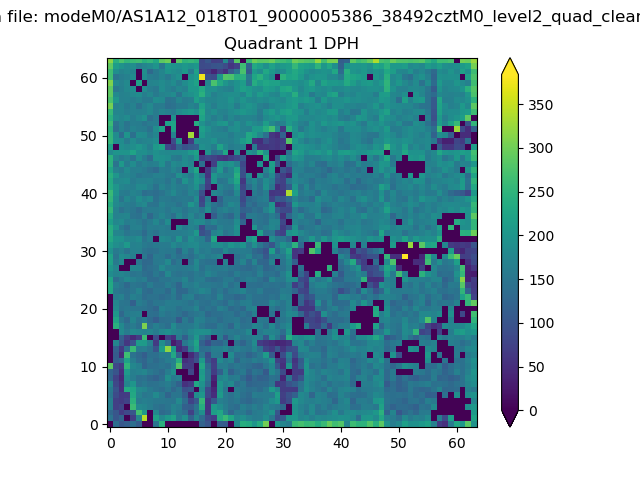 |
Quadrant B |
|---|---|---|---|
| Quadrant D | 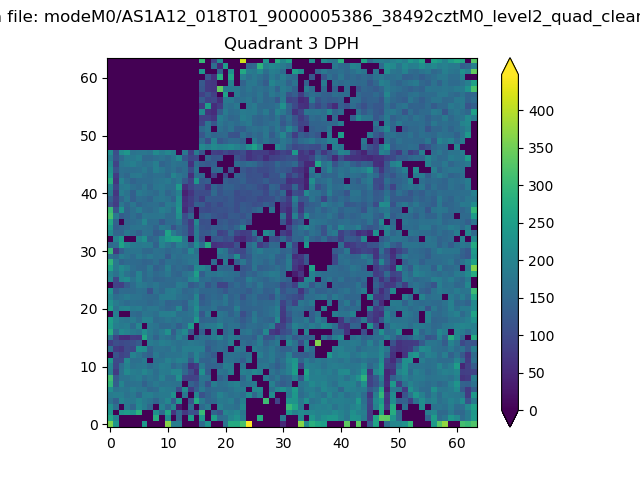 |
 |
Quadrant C |
| Plot type | Count rate plots | Images |
|---|---|---|
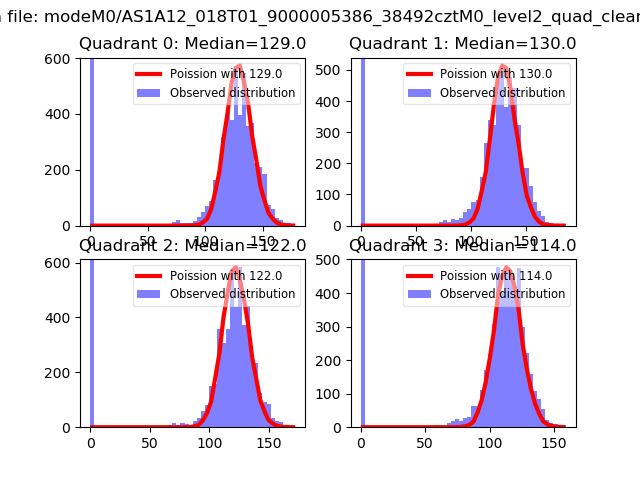
| Comparison with Poisson distribution Blue bars denote a histogram of data divided into 1 sec bins. Red curve is a Poisson curve with rate = median count rate of data. |
 |
 |
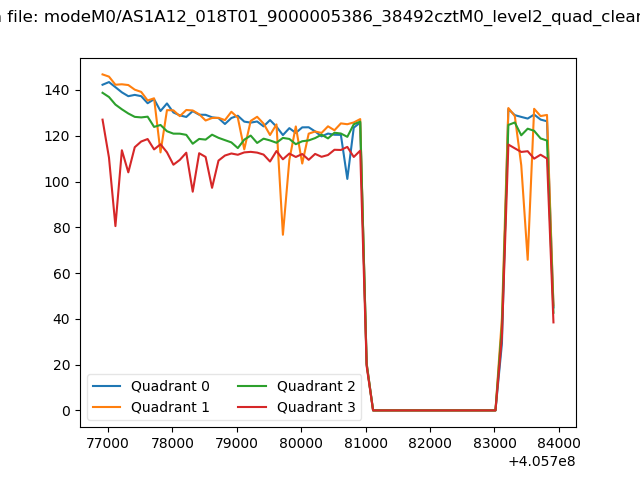
| Quadrant-wise count rates Data is divided into 100 sec bins |
 |
|
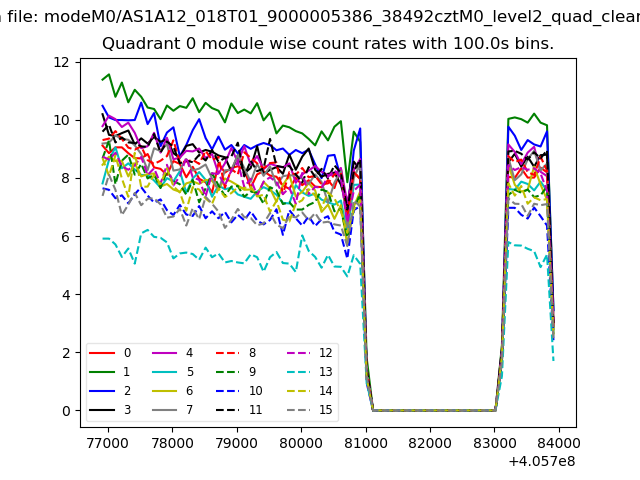
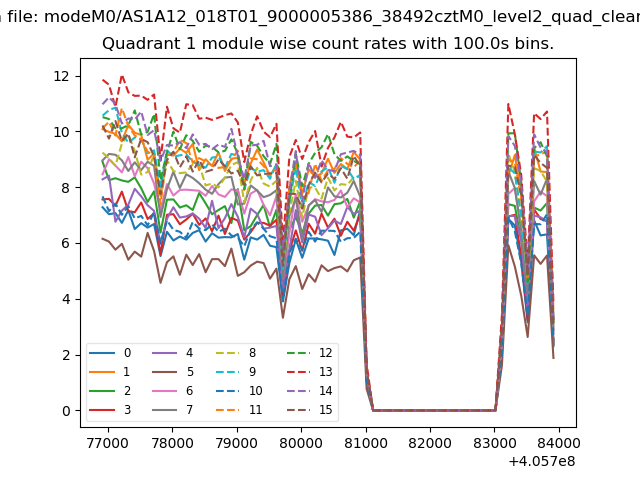
| Module-wise count rates for Quadrant A Data is divided into 100 sec bins |
 |
 |
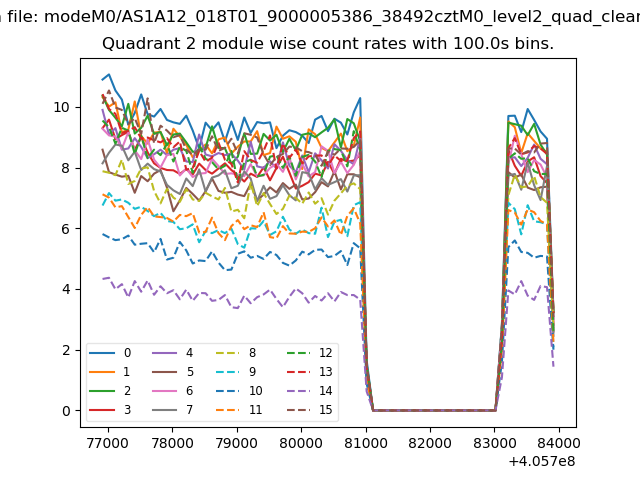
| Module-wise count rates for Quadrant B Data is divided into 100 sec bins |
 |
 |
| Module-wise count rates for Quadrant C Data is divided into 100 sec bins |
 |
 |
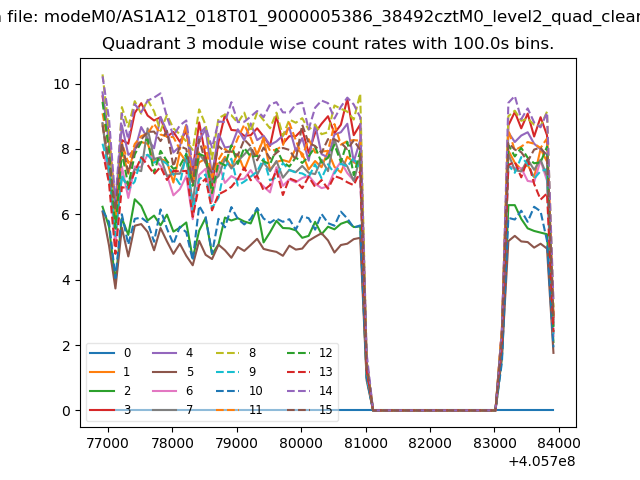
| Module-wise count rates for Quadrant D Data is divided into 100 sec bins |
 |
 |
| Parameter | Plot |
|---|---|
| CZT HV Monitor | 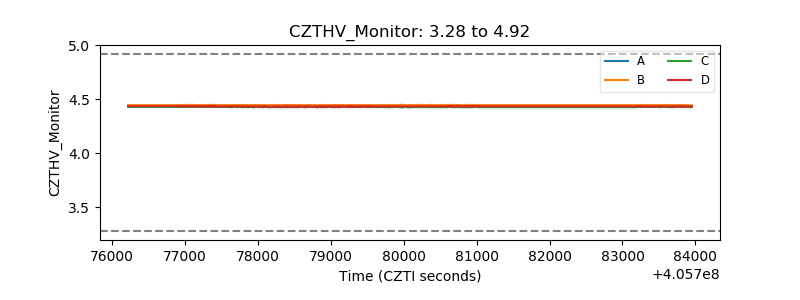 |
| D_VDD |  |
| Temperature 1 | 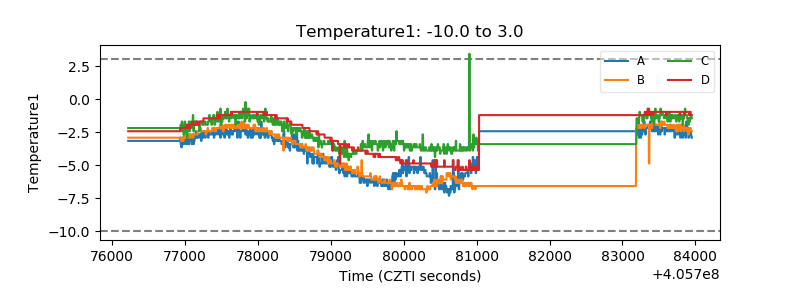 |
| Veto HV Monitor | 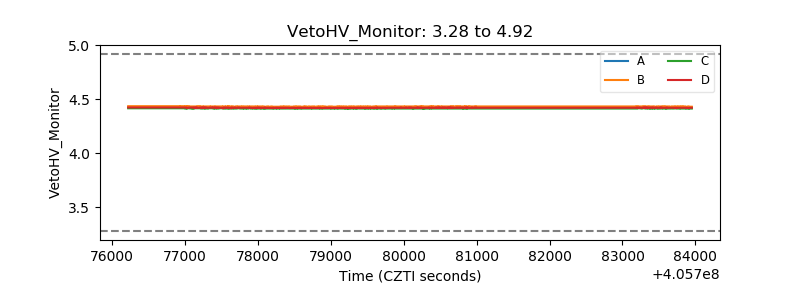 |
| Veto LLD | 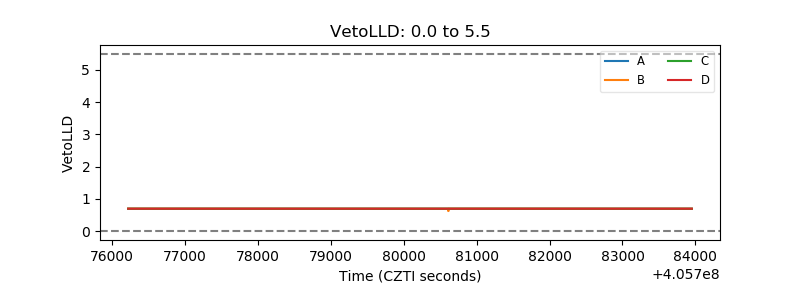 |
| Alpha Counter | 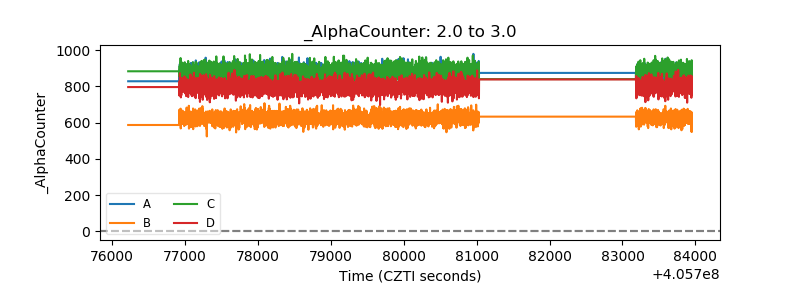 |
| _CPM_Rate | 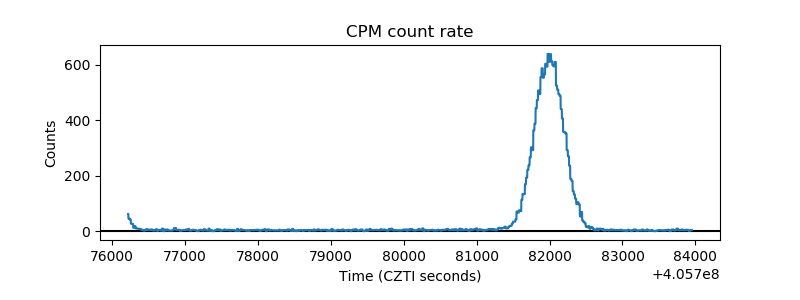 |
| CZT Counter | 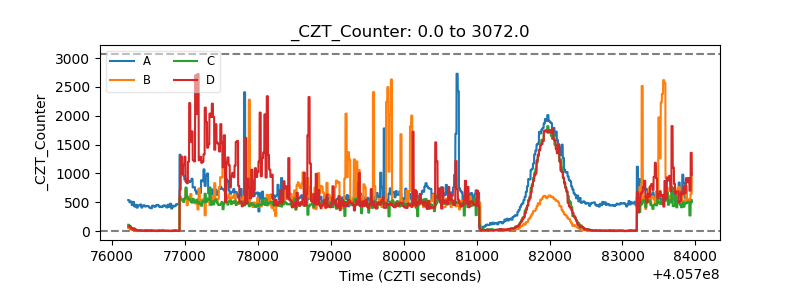 |
| +2.5 Volts monitor | 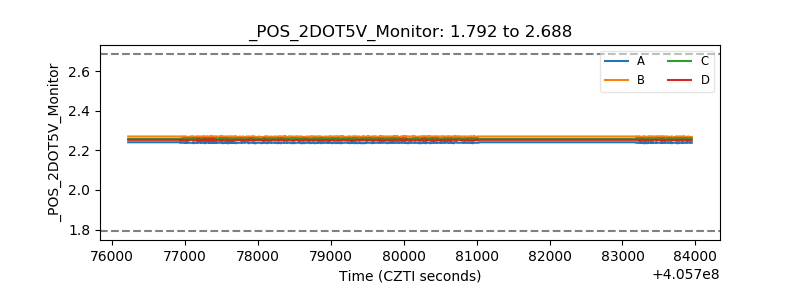 |
| +5 Volts monitor | 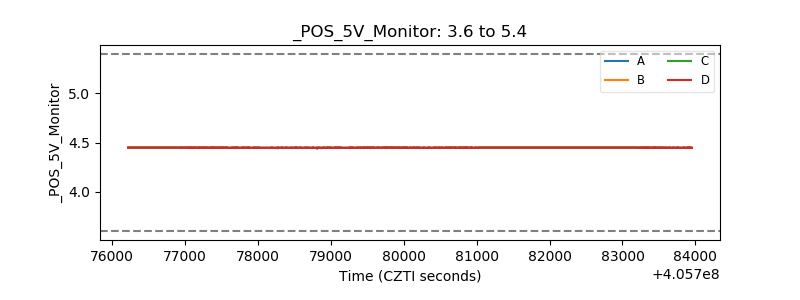 |
| _ROLL_ROT | 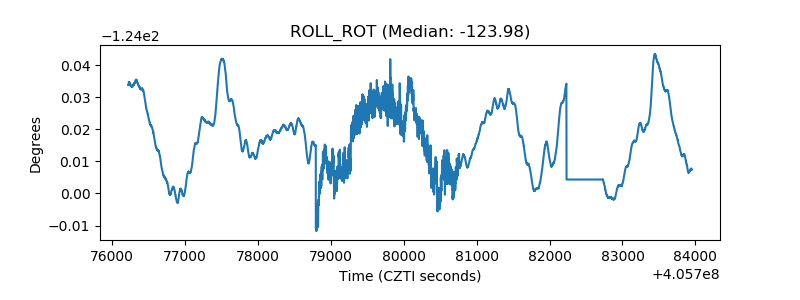 |
| _Roll_DEC | 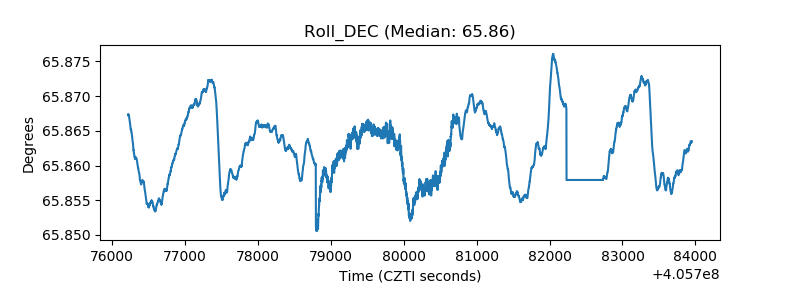 |
| _Roll_RA | 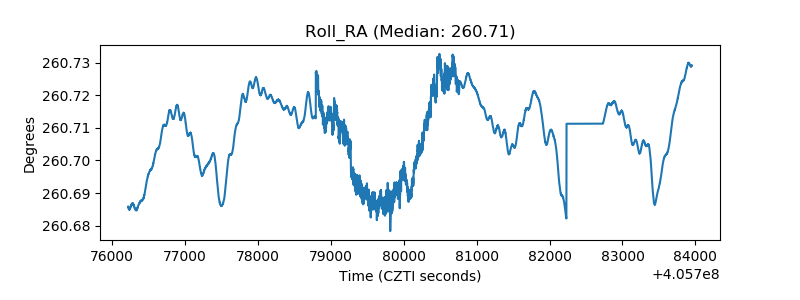 |
| Veto Counter | 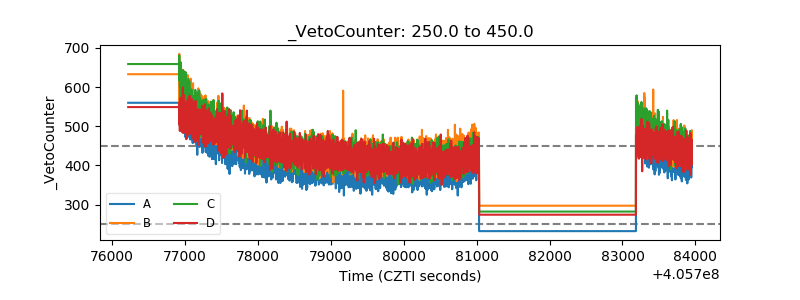 |