| Param | Original file | Final file |
|---|---|---|
| Filename | modeM0/AS1A12_018T01_9000005386_38493cztM0_level2.fits | modeM0/AS1A12_018T01_9000005386_38493cztM0_level2_quad_clean.evt |
| Size (bytes) | 355,115,520 | 89,424,000 |
| Size | 338.7 MB | 85.3 MB |
| Events in quadrant A | 3,334,348 | 618,862 |
| Events in quadrant B | 3,017,762 | 616,291 |
| Events in quadrant C | 2,495,041 | 593,649 |
| Events in quadrant D | 3,897,635 | 518,882 |
| Mode SS | |||
|---|---|---|---|
| Quadrant | BADHDUFLAG | Total packets | Discarded packets |
| A | 0 | 104 | 0 |
| B | 0 | 104 | 0 |
| C | 0 | 104 | 0 |
| D | 0 | 104 | 0 |
| Mode M9 | |||
|---|---|---|---|
| Quadrant | BADHDUFLAG | Total packets | Discarded packets |
| A | 0 | 24 | 0 |
| B | 0 | 24 | 0 |
| C | 0 | 24 | 0 |
| D | 0 | 25 | 0 |
| Mode M0 | |||
|---|---|---|---|
| Quadrant | BADHDUFLAG | Total packets | Discarded packets |
| A | 0 | 13593 | 3 |
| B | 0 | 12233 | 2 |
| C | 0 | 10488 | 2 |
| D | 0 | 15067 | 2 |
| Quadrant | Total seconds | Saturated seconds | Saturation percentage |
|---|---|---|---|
| A | 5141 | 56 | 1.089282% |
| B | 5141 | 133 | 2.587045% |
| C | 5141 | 13 | 0.252869% |
| D | 5141 | 419 | 8.150165% |
Noise dominated data is calculated using 1-second bins in cleaned event files. If a bin has >2000 counts, and if more than 50% of those come from <1% of pixels, then it is considered to be noise-dominated and hence unusable.
| Quadrant | # 1 sec bins | Bins with >0 counts | Bins with >2000 counts | High rate bins dominated by noise | Noise dominated (total time) | Noise dominated (detector-on time) | Marked lightcurve |
|---|---|---|---|---|---|---|---|
| A | 7204 | 5142 | 37 | 37 | 0.51% | 0.72% | 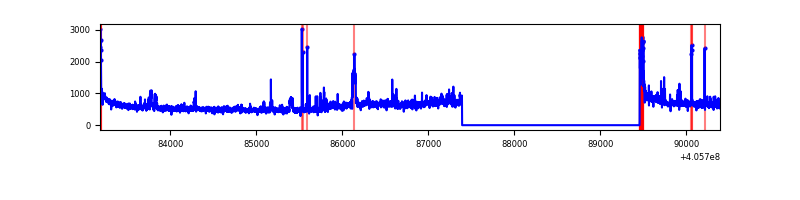 |
| B | 7204 | 5142 | 105 | 105 | 1.46% | 2.04% | 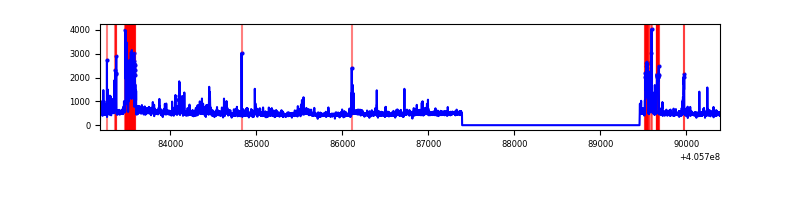 |
| C | 7204 | 5142 | 10 | 10 | 0.14% | 0.19% | 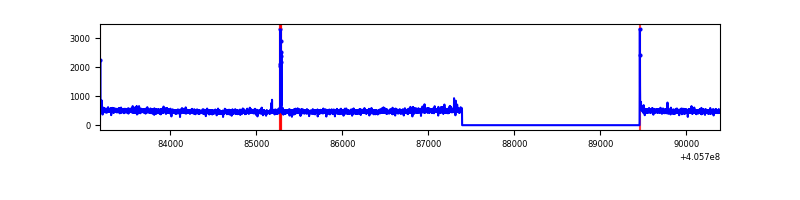 |
| D | 7204 | 5142 | 370 | 370 | 5.14% | 7.20% | 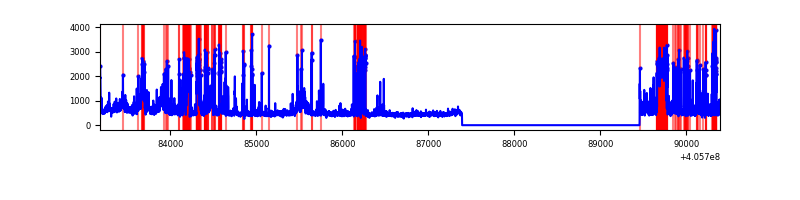 |
Top three noisy pixels from each quadrant. If the there are fewer than three noisy pixels in the level2.evt file, extra rows are filled as -1
| Pixel properties | Quadrant properties | ||||||
|---|---|---|---|---|---|---|---|
| Quadrant | DetID | PixID | Counts | Sigma | Mean | Median | Sigma |
| A | 15 | 222 | 505887 | 4314.85 | 583 | 571 | 117.1 |
| A | 10 | 83 | 398650 | 3399.16 | 583 | 571 | 117.1 |
| A | 9 | 143 | 104548 | 887.85 | 583 | 571 | 117.1 |
| B | 5 | 184 | 253932 | 2320.16 | 574 | 557 | 109.2 |
| B | 4 | 171 | 129601 | 1181.66 | 574 | 557 | 109.2 |
| B | 8 | 3 | 94973 | 864.57 | 574 | 557 | 109.2 |
| C | 15 | 214 | 214780 | 1638.12 | 569 | 571 | 130.8 |
| C | 2 | 16 | 28707 | 215.16 | 569 | 571 | 130.8 |
| C | 0 | 10 | 20455 | 152.06 | 569 | 571 | 130.8 |
| D | 10 | 118 | 543424 | 4066.68 | 550 | 535 | 133.5 |
| D | 7 | 223 | 382056 | 2857.9 | 550 | 535 | 133.5 |
| D | 13 | 249 | 335372 | 2508.2 | 550 | 535 | 133.5 |
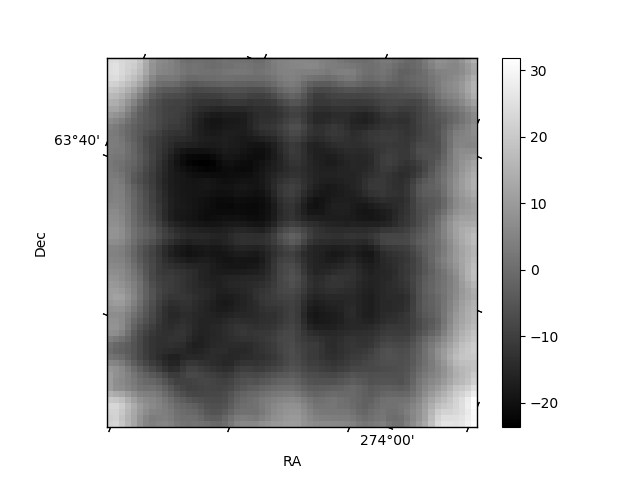
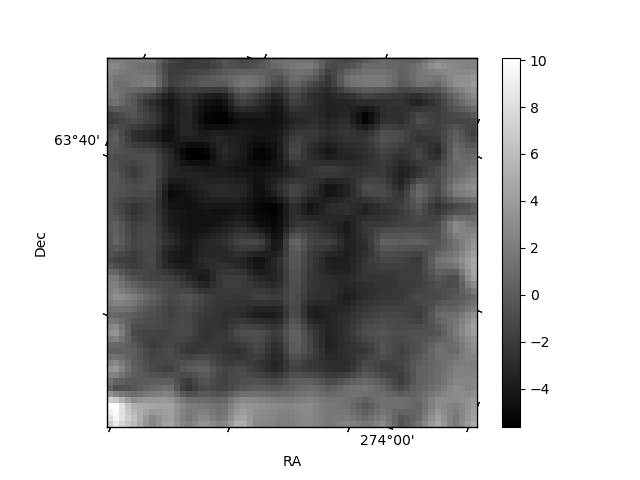
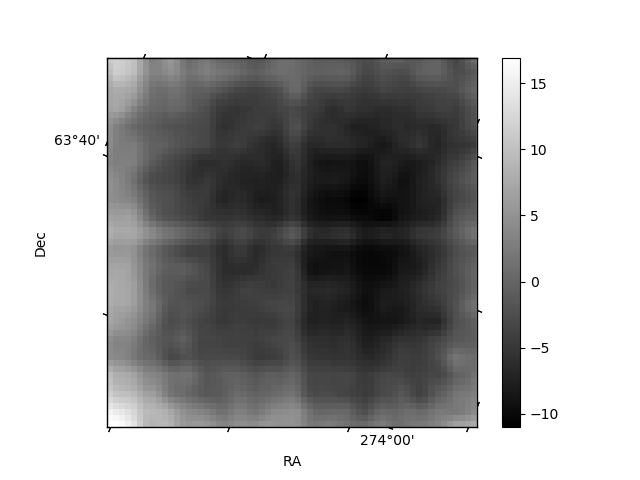
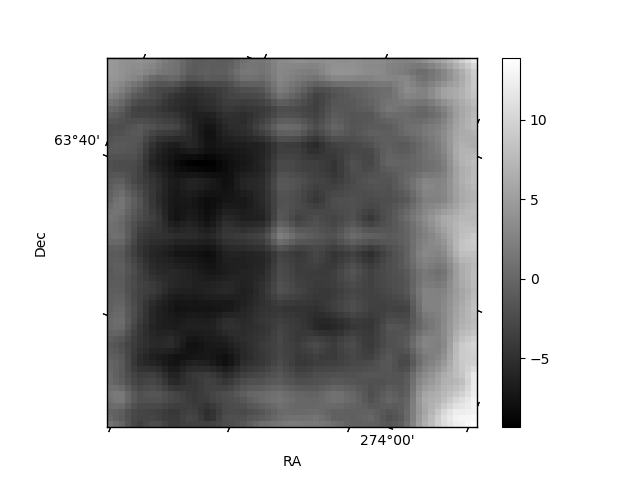
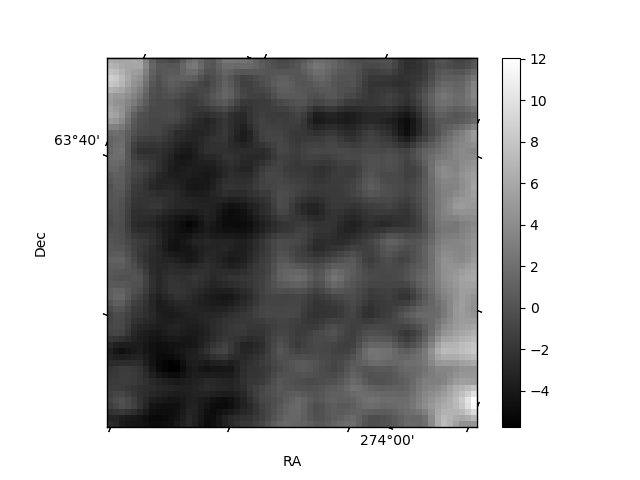
Histogram calculated using DETX and DETY for each event in the final _common_clean file
| Quadrant A | 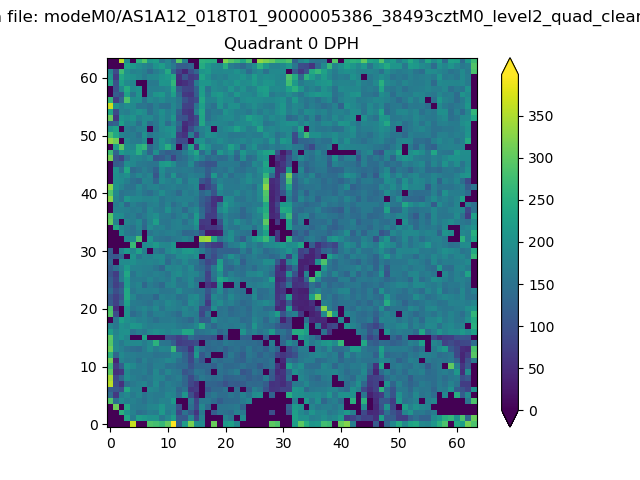 |
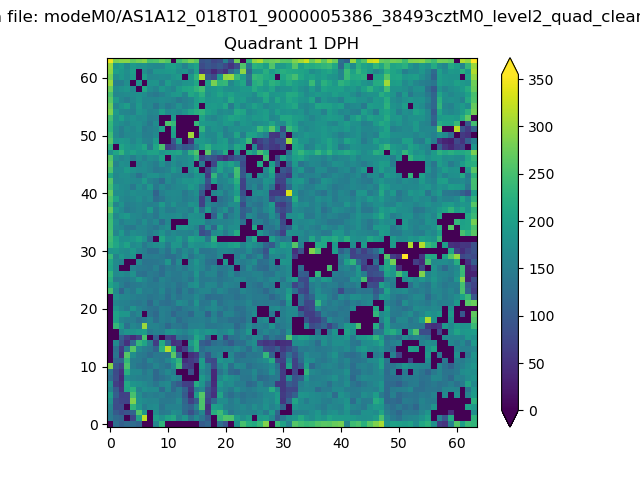 |
Quadrant B |
|---|---|---|---|
| Quadrant D | 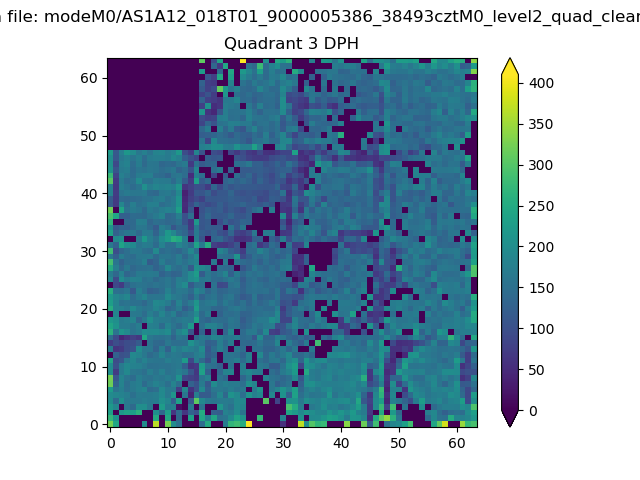 |
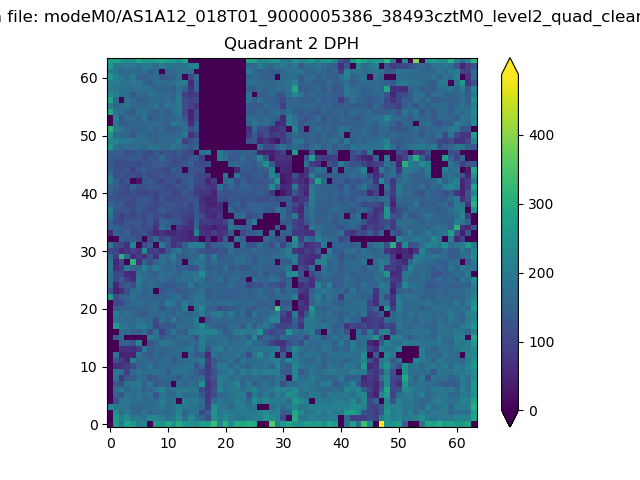 |
Quadrant C |
| Plot type | Count rate plots | Images |
|---|---|---|
| Comparison with Poisson distribution Blue bars denote a histogram of data divided into 1 sec bins. Red curve is a Poisson curve with rate = median count rate of data. |
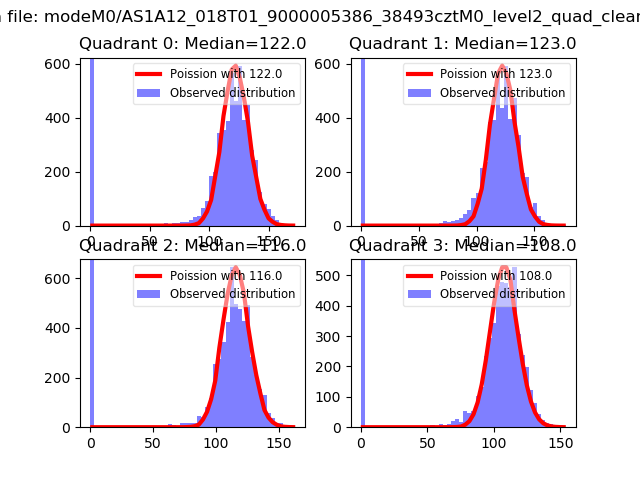 |
 |
| Quadrant-wise count rates Data is divided into 100 sec bins |
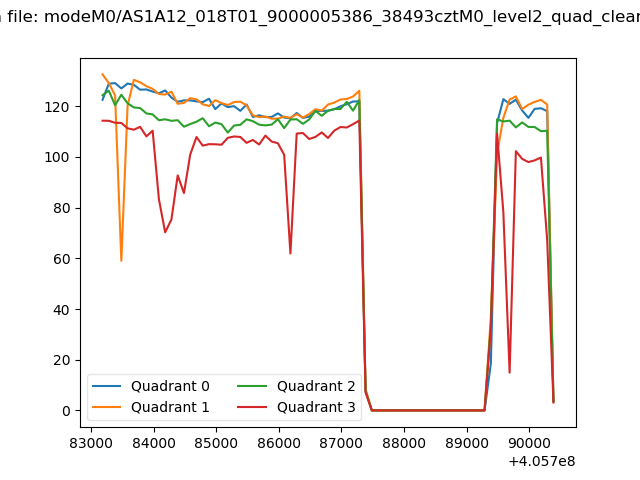 |
|
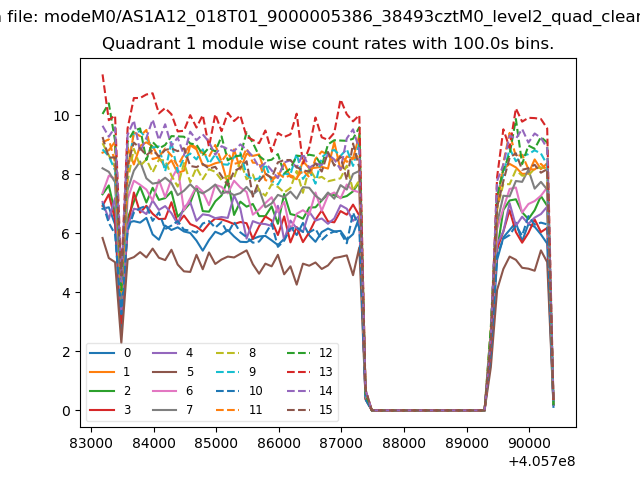
| Module-wise count rates for Quadrant A Data is divided into 100 sec bins |
 |
 |
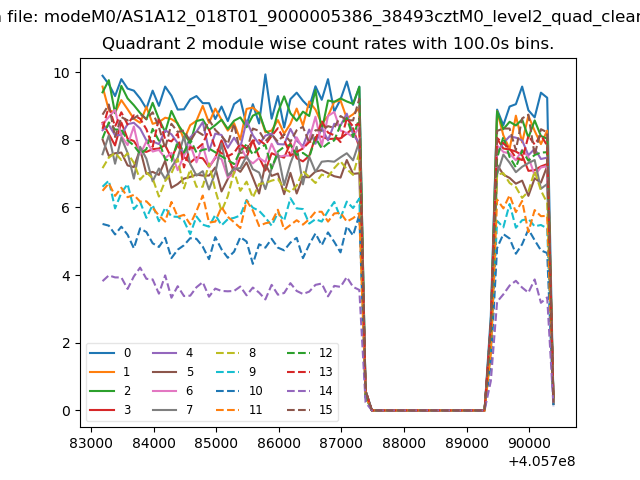
| Module-wise count rates for Quadrant B Data is divided into 100 sec bins |
 |
 |
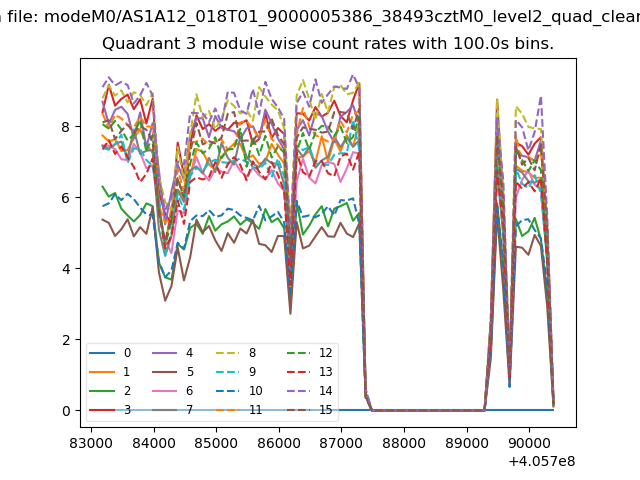
| Module-wise count rates for Quadrant C Data is divided into 100 sec bins |
 |
 |
| Module-wise count rates for Quadrant D Data is divided into 100 sec bins |
 |
 |
| Parameter | Plot |
|---|---|
| CZT HV Monitor | 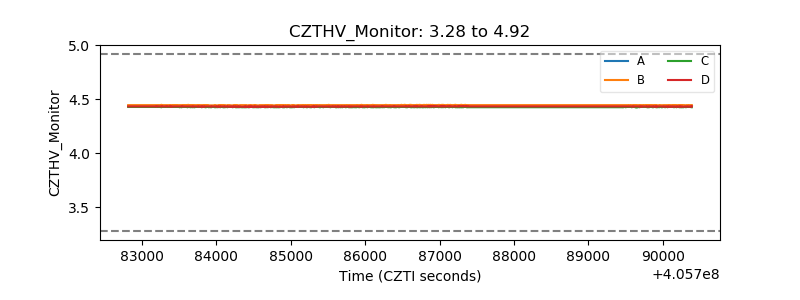 |
| D_VDD | 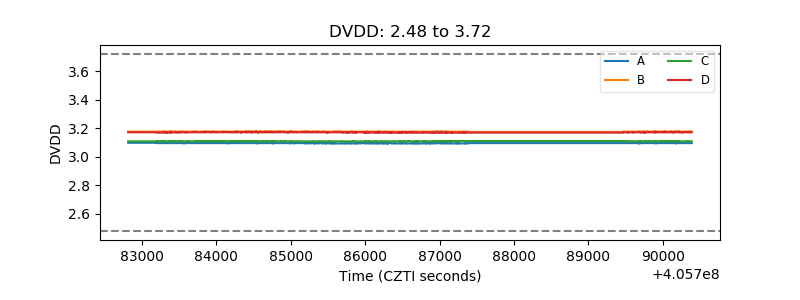 |
| Temperature 1 | 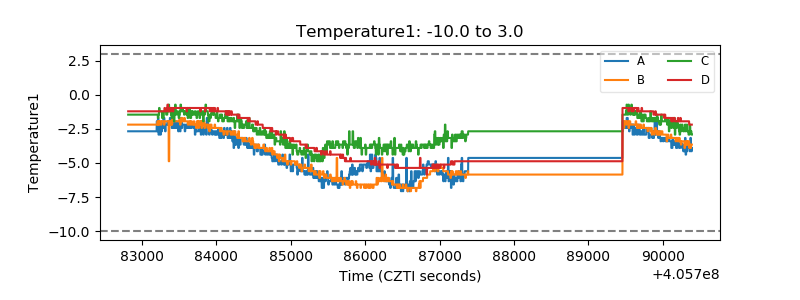 |
| Veto HV Monitor | 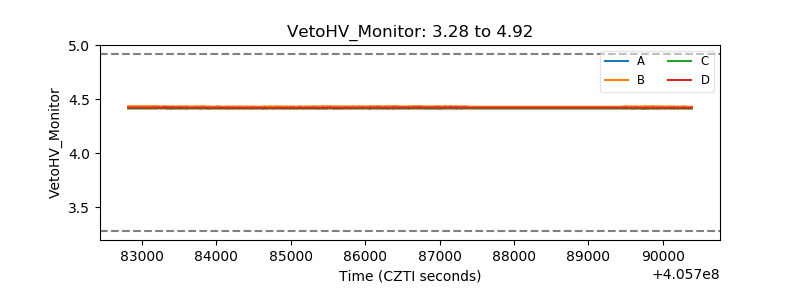 |
| Veto LLD | 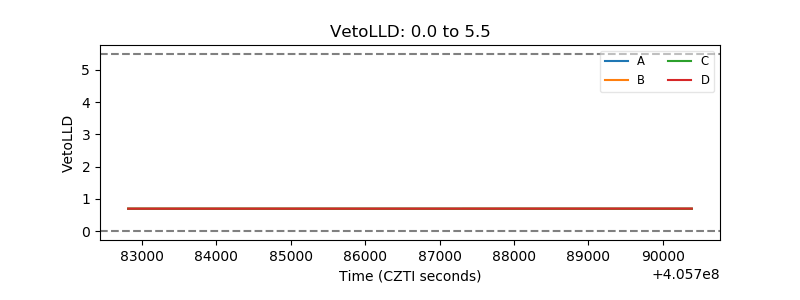 |
| Alpha Counter | 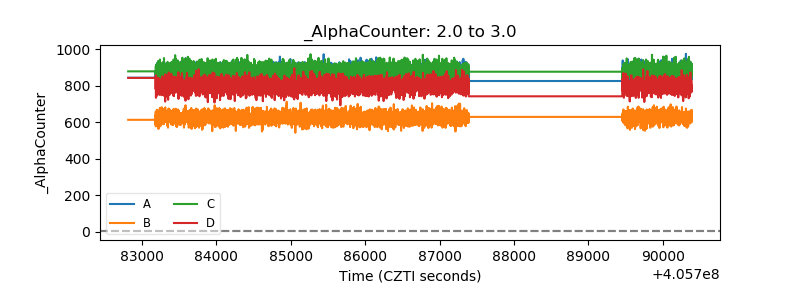 |
| _CPM_Rate | 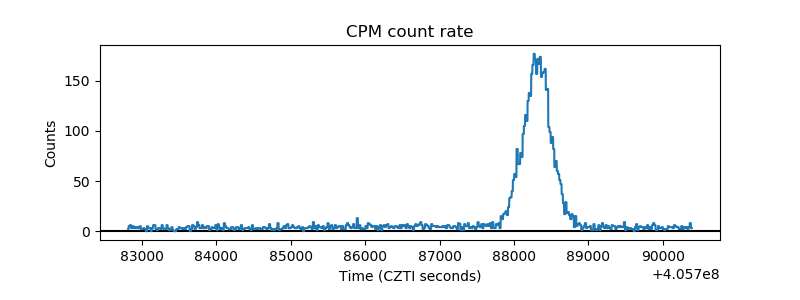 |
| CZT Counter | 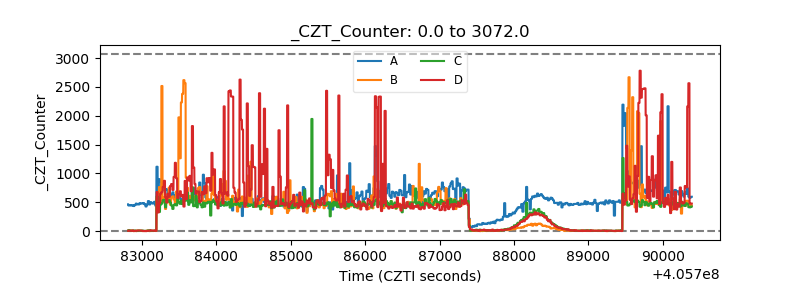 |
| +2.5 Volts monitor | 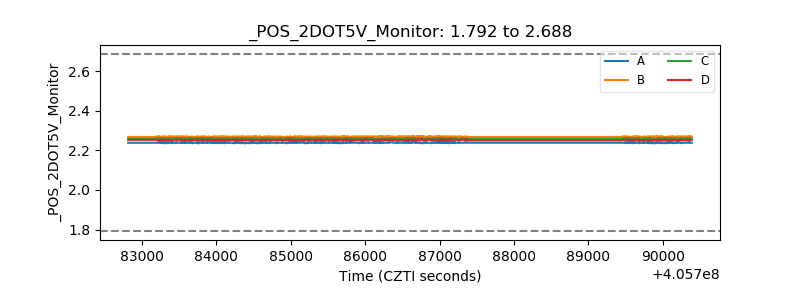 |
| +5 Volts monitor | 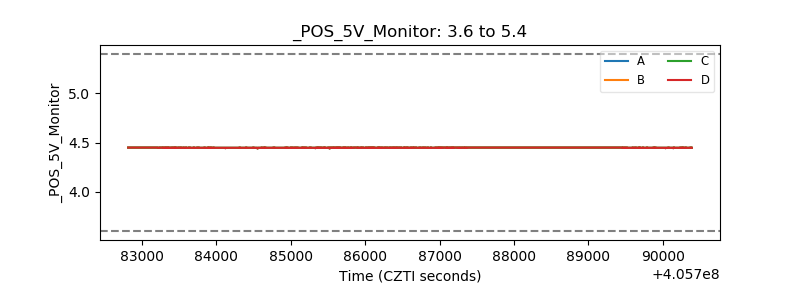 |
| _ROLL_ROT | 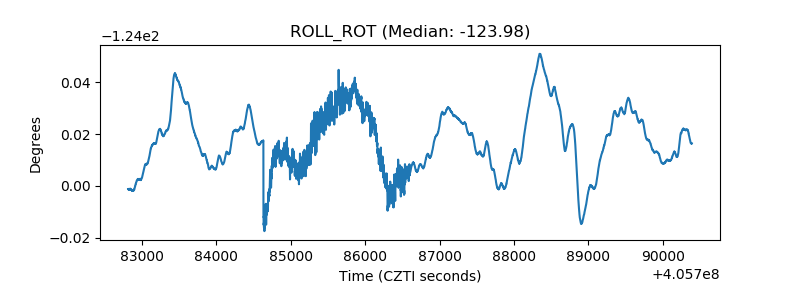 |
| _Roll_DEC | 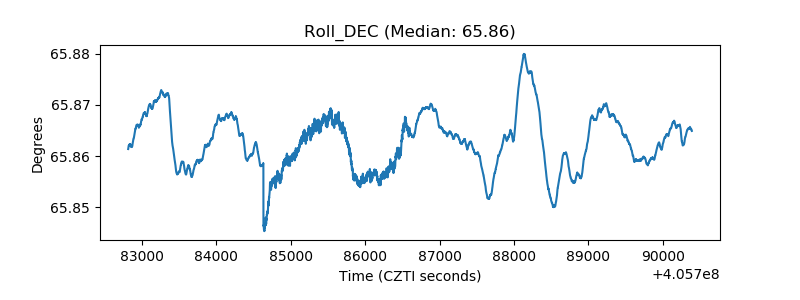 |
| _Roll_RA | 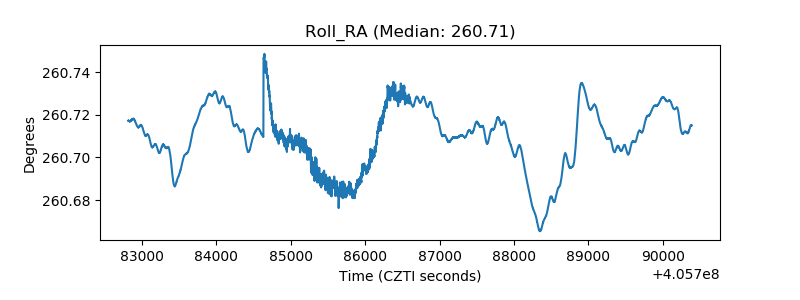 |
| Veto Counter | 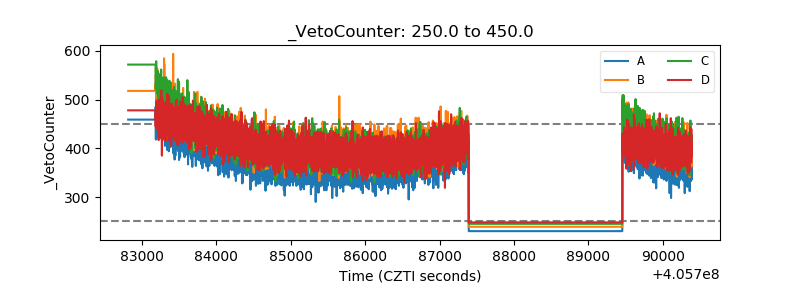 |