| Param | Original file | Final file |
|---|---|---|
| Filename | modeM0/AS1A12_018T01_9000005386_38494cztM0_level2.fits | modeM0/AS1A12_018T01_9000005386_38494cztM0_level2_quad_clean.evt |
| Size (bytes) | 373,233,600 | 90,086,400 |
| Size | 355.9 MB | 85.9 MB |
| Events in quadrant A | 3,871,232 | 618,346 |
| Events in quadrant B | 3,478,909 | 609,068 |
| Events in quadrant C | 2,521,604 | 596,365 |
| Events in quadrant D | 3,527,350 | 528,779 |
| Mode SS | |||
|---|---|---|---|
| Quadrant | BADHDUFLAG | Total packets | Discarded packets |
| A | 0 | 110 | 0 |
| B | 0 | 110 | 0 |
| C | 0 | 110 | 0 |
| D | 0 | 110 | 0 |
| Mode M9 | |||
|---|---|---|---|
| Quadrant | BADHDUFLAG | Total packets | Discarded packets |
| A | 0 | 17 | 0 |
| B | 0 | 17 | 0 |
| C | 0 | 17 | 0 |
| D | 0 | 17 | 0 |
| Mode M0 | |||
|---|---|---|---|
| Quadrant | BADHDUFLAG | Total packets | Discarded packets |
| A | 0 | 15886 | 3 |
| B | 0 | 13831 | 2 |
| C | 0 | 10825 | 2 |
| D | 0 | 14169 | 2 |
| Quadrant | Total seconds | Saturated seconds | Saturation percentage |
|---|---|---|---|
| A | 5357 | 58 | 1.082696% |
| B | 5357 | 242 | 4.517454% |
| C | 5357 | 4 | 0.074669% |
| D | 5357 | 320 | 5.973493% |
Noise dominated data is calculated using 1-second bins in cleaned event files. If a bin has >2000 counts, and if more than 50% of those come from <1% of pixels, then it is considered to be noise-dominated and hence unusable.
| Quadrant | # 1 sec bins | Bins with >0 counts | Bins with >2000 counts | High rate bins dominated by noise | Noise dominated (total time) | Noise dominated (detector-on time) | Marked lightcurve |
|---|---|---|---|---|---|---|---|
| A | 7121 | 5358 | 36 | 36 | 0.51% | 0.67% | 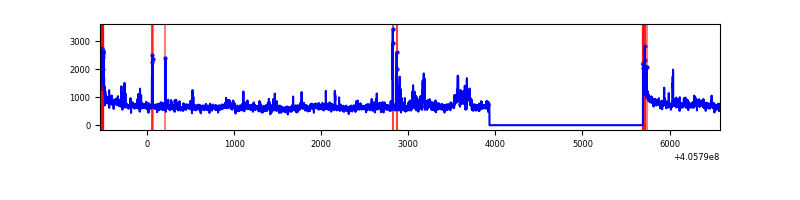 |
| B | 7121 | 5358 | 172 | 172 | 2.42% | 3.21% | 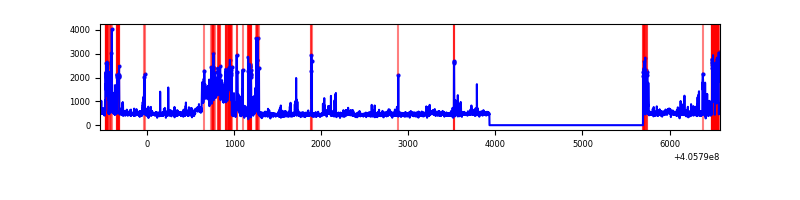 |
| C | 7121 | 5358 | 1 | 1 | 0.01% | 0.02% | 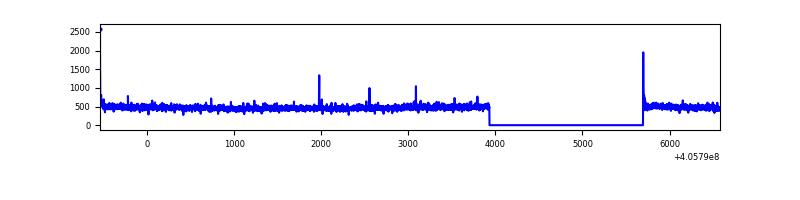 |
| D | 7121 | 5358 | 273 | 273 | 3.83% | 5.10% | 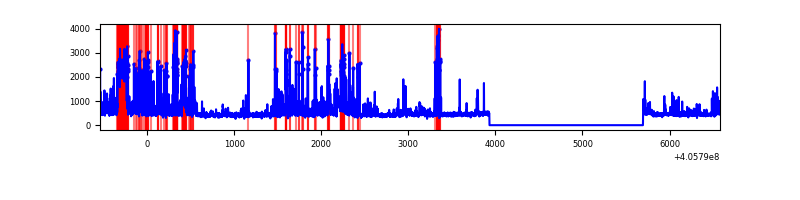 |
Top three noisy pixels from each quadrant. If the there are fewer than three noisy pixels in the level2.evt file, extra rows are filled as -1
| Pixel properties | Quadrant properties | ||||||
|---|---|---|---|---|---|---|---|
| Quadrant | DetID | PixID | Counts | Sigma | Mean | Median | Sigma |
| A | 15 | 222 | 1007462 | 8375.45 | 593 | 581 | 120.2 |
| A | 10 | 83 | 403369 | 3350.47 | 593 | 581 | 120.2 |
| A | 9 | 143 | 139600 | 1156.39 | 593 | 581 | 120.2 |
| B | 8 | 3 | 677438 | 6138.08 | 579 | 564 | 110.3 |
| B | 5 | 184 | 171241 | 1547.75 | 579 | 564 | 110.3 |
| B | 4 | 171 | 118994 | 1073.96 | 579 | 564 | 110.3 |
| C | 15 | 214 | 222455 | 1635.94 | 582 | 585 | 135.6 |
| C | 0 | 10 | 16759 | 119.26 | 582 | 585 | 135.6 |
| C | 14 | 254 | 10318 | 71.77 | 582 | 585 | 135.6 |
| D | 7 | 223 | 549495 | 4038.98 | 564 | 549 | 135.9 |
| D | 10 | 118 | 213132 | 1564.12 | 564 | 549 | 135.9 |
| D | 2 | 250 | 206468 | 1515.09 | 564 | 549 | 135.9 |
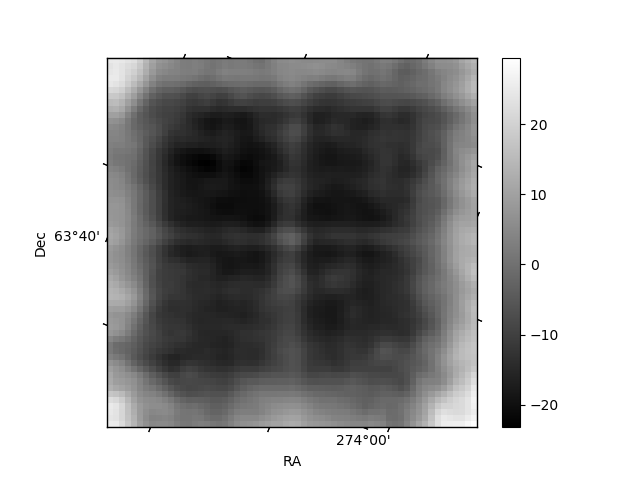
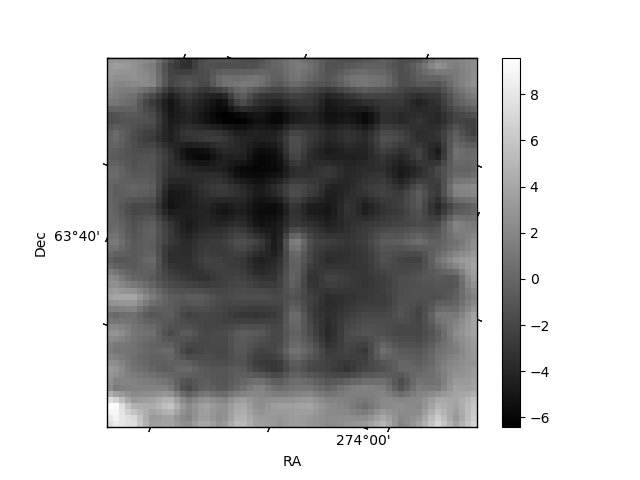
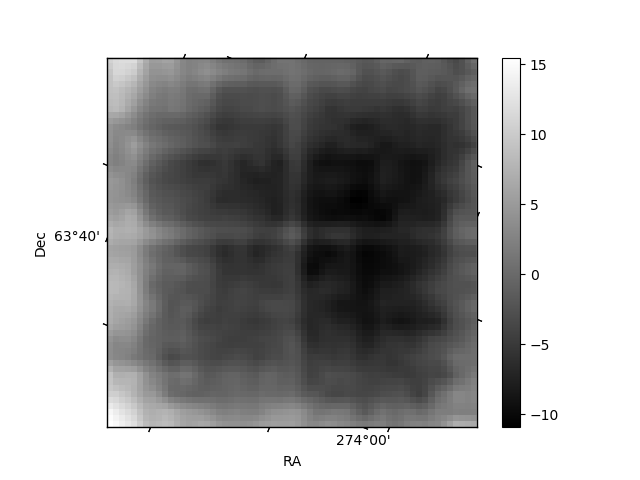
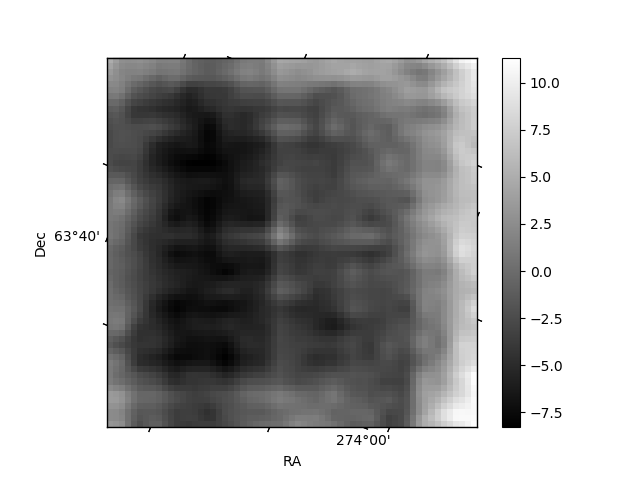
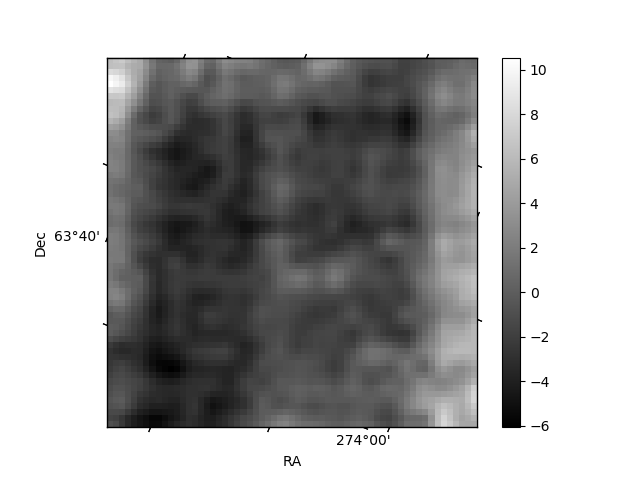
Histogram calculated using DETX and DETY for each event in the final _common_clean file
| Quadrant A | 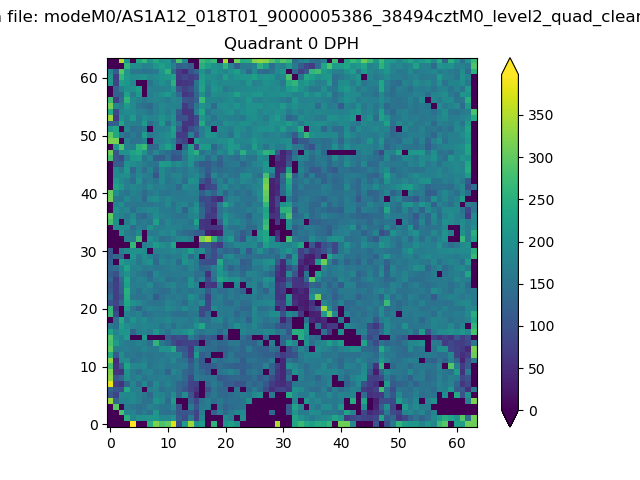 |
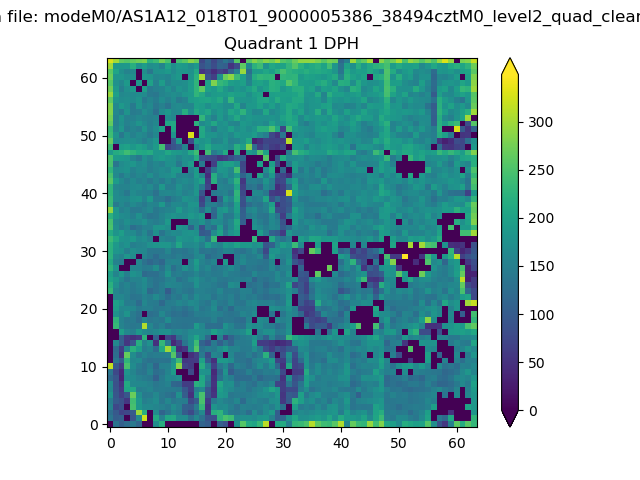 |
Quadrant B |
|---|---|---|---|
| Quadrant D | 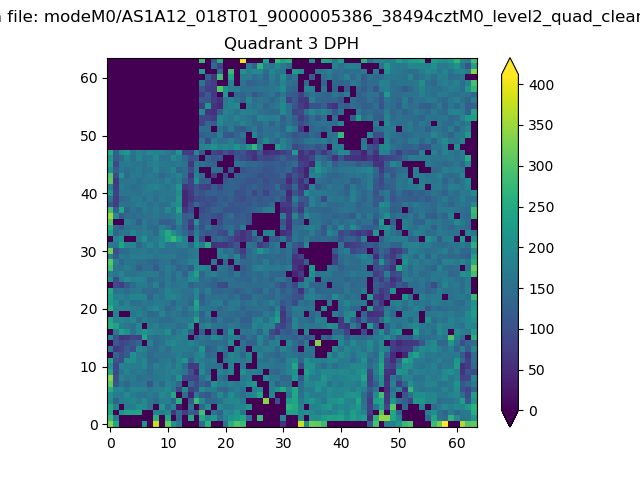 |
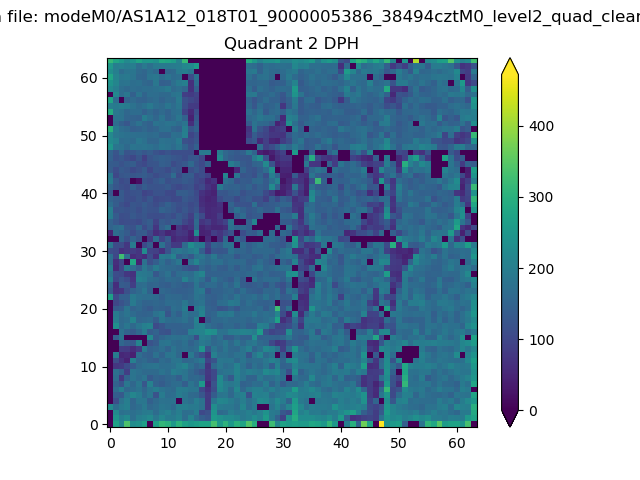 |
Quadrant C |
| Plot type | Count rate plots | Images |
|---|---|---|
| Comparison with Poisson distribution Blue bars denote a histogram of data divided into 1 sec bins. Red curve is a Poisson curve with rate = median count rate of data. |
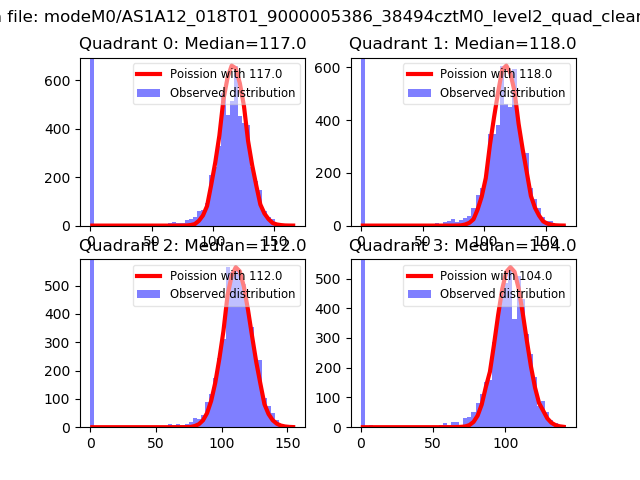 |
 |
| Quadrant-wise count rates Data is divided into 100 sec bins |
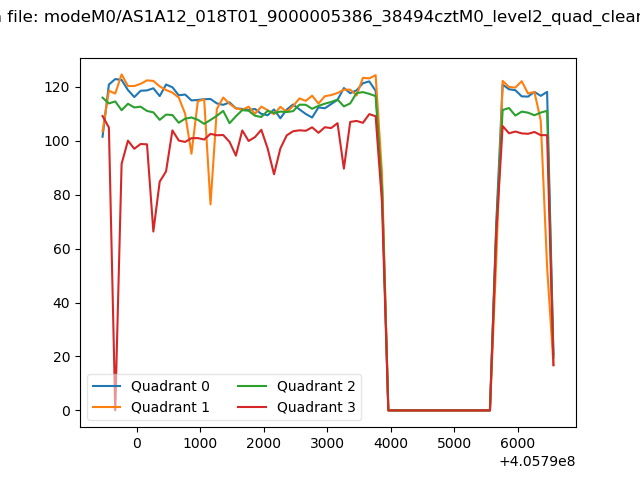 |
|
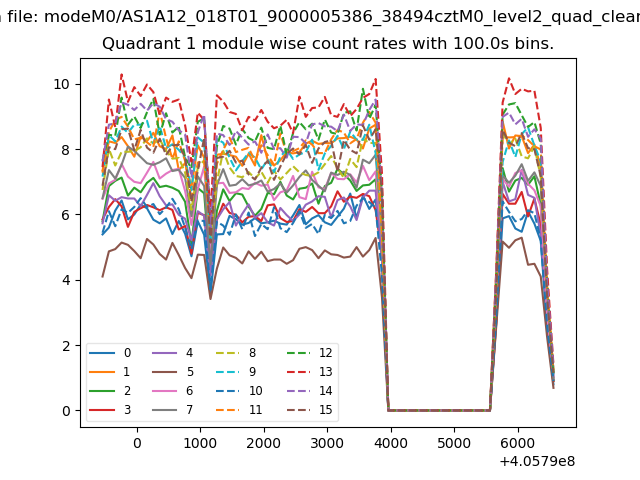
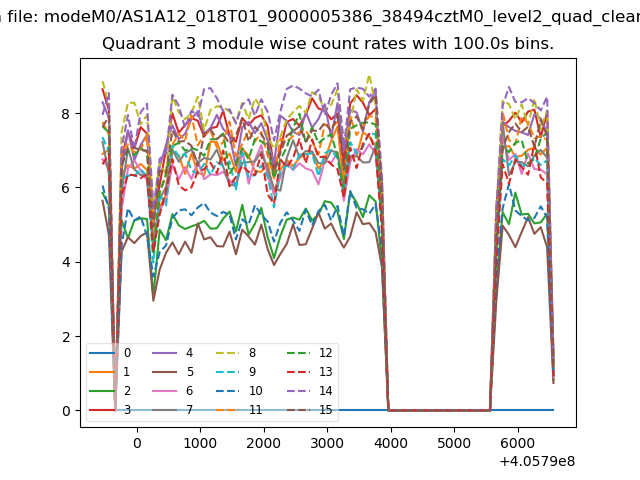
| Module-wise count rates for Quadrant A Data is divided into 100 sec bins |
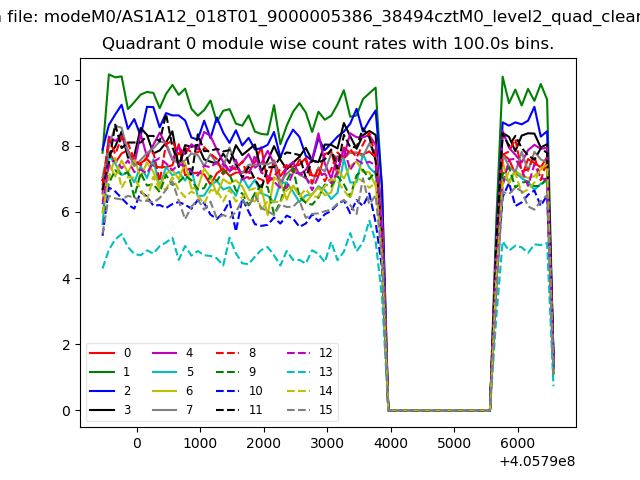 |
 |
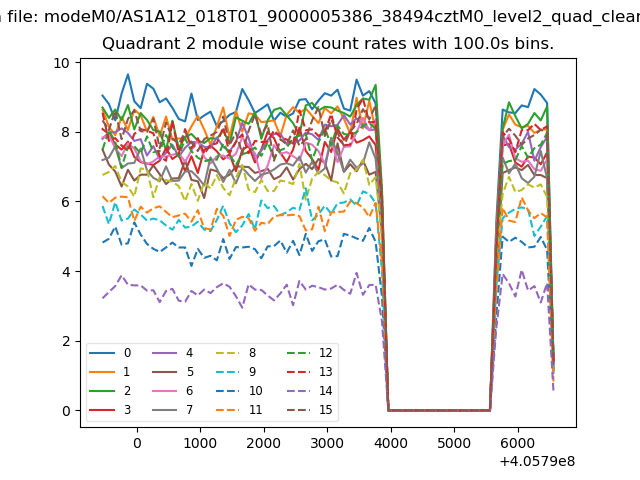
| Module-wise count rates for Quadrant B Data is divided into 100 sec bins |
 |
 |
| Module-wise count rates for Quadrant C Data is divided into 100 sec bins |
 |
 |
| Module-wise count rates for Quadrant D Data is divided into 100 sec bins |
 |
 |
| Parameter | Plot |
|---|---|
| CZT HV Monitor | 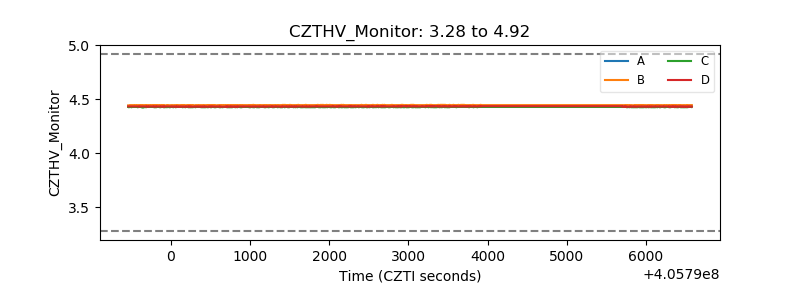 |
| D_VDD | 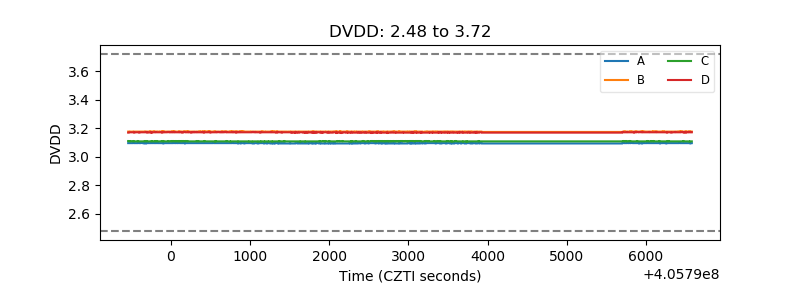 |
| Temperature 1 | 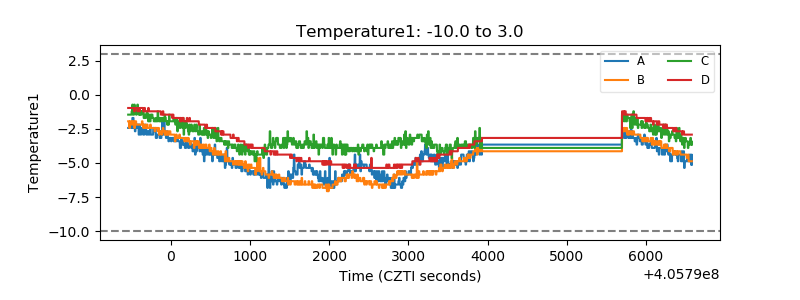 |
| Veto HV Monitor | 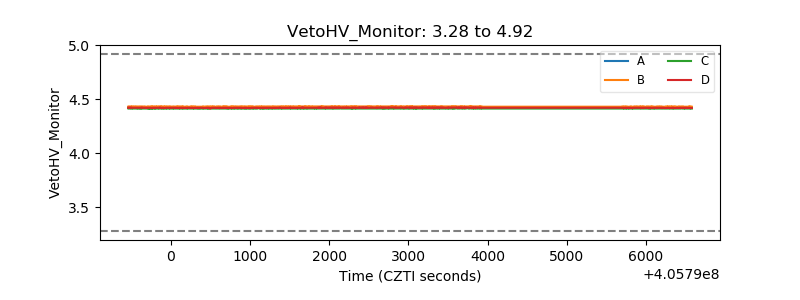 |
| Veto LLD | 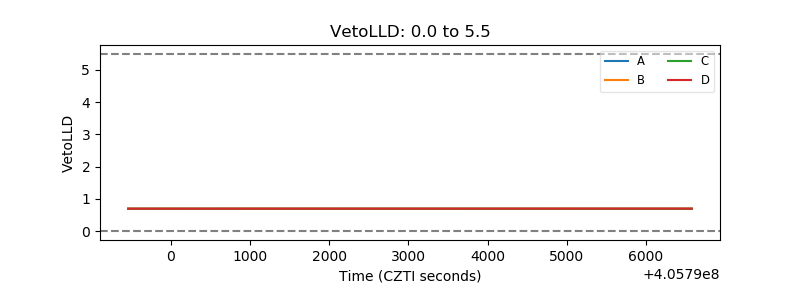 |
| Alpha Counter | 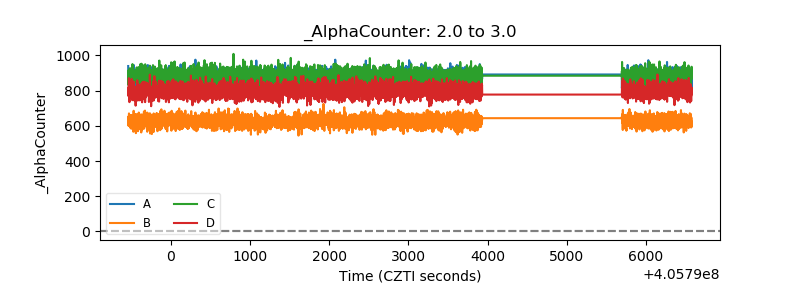 |
| _CPM_Rate | 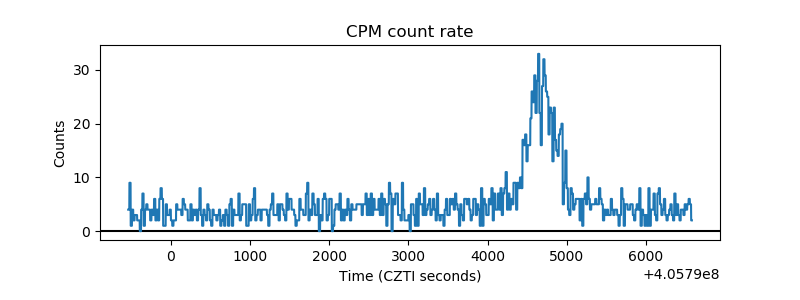 |
| CZT Counter | 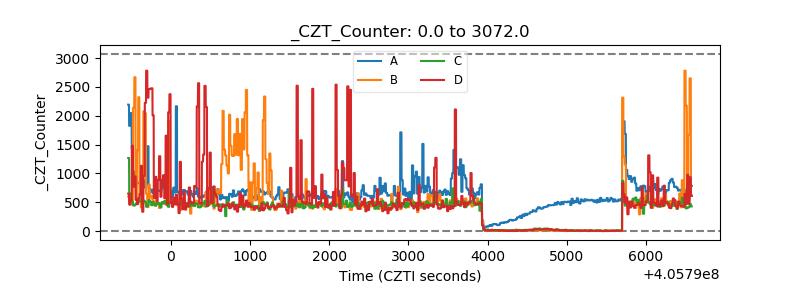 |
| +2.5 Volts monitor |  |
| +5 Volts monitor |  |
| _ROLL_ROT | 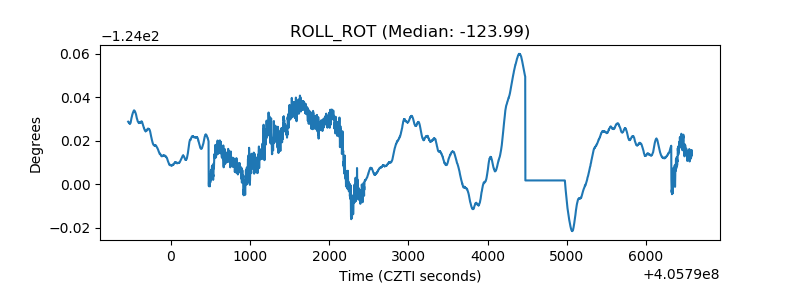 |
| _Roll_DEC | 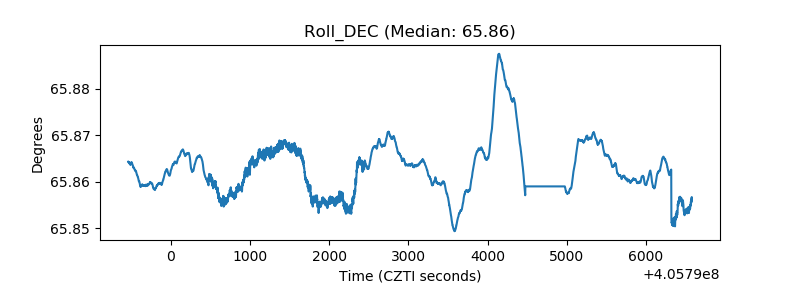 |
| _Roll_RA | 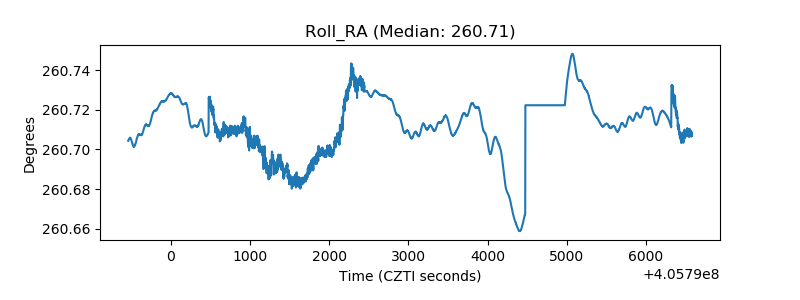 |
| Veto Counter | 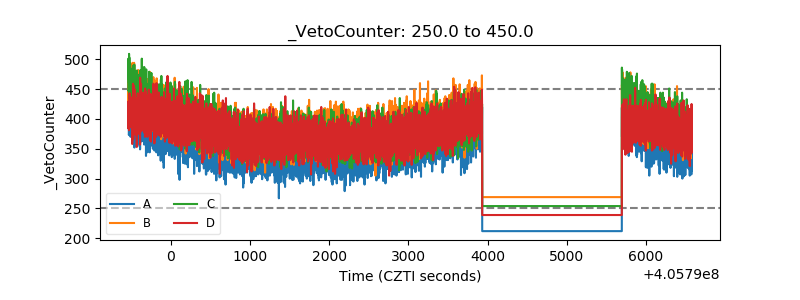 |