| Param | Original file | Final file |
|---|---|---|
| Filename | modeM0/AS1A12_018T01_9000005386_38495cztM0_level2.fits | modeM0/AS1A12_018T01_9000005386_38495cztM0_level2_quad_clean.evt |
| Size (bytes) | 393,690,240 | 93,127,680 |
| Size | 375.5 MB | 88.8 MB |
| Events in quadrant A | 3,900,833 | 643,397 |
| Events in quadrant B | 4,742,149 | 577,518 |
| Events in quadrant C | 2,659,128 | 623,537 |
| Events in quadrant D | 2,829,364 | 578,410 |
| Mode SS | |||
|---|---|---|---|
| Quadrant | BADHDUFLAG | Total packets | Discarded packets |
| A | 0 | 116 | 0 |
| B | 0 | 116 | 0 |
| C | 0 | 116 | 0 |
| D | 0 | 116 | 0 |
| Mode M9 | |||
|---|---|---|---|
| Quadrant | BADHDUFLAG | Total packets | Discarded packets |
| A | 0 | 20 | 0 |
| B | 0 | 20 | 0 |
| C | 0 | 20 | 0 |
| D | 0 | 21 | 0 |
| Mode M0 | |||
|---|---|---|---|
| Quadrant | BADHDUFLAG | Total packets | Discarded packets |
| A | 0 | 15697 | 3 |
| B | 0 | 17793 | 2 |
| C | 0 | 11471 | 2 |
| D | 0 | 12429 | 2 |
| Quadrant | Total seconds | Saturated seconds | Saturation percentage |
|---|---|---|---|
| A | 5675 | 32 | 0.563877% |
| B | 5675 | 759 | 13.374449% |
| C | 5675 | 8 | 0.140969% |
| D | 5675 | 38 | 0.669604% |
Noise dominated data is calculated using 1-second bins in cleaned event files. If a bin has >2000 counts, and if more than 50% of those come from <1% of pixels, then it is considered to be noise-dominated and hence unusable.
| Quadrant | # 1 sec bins | Bins with >0 counts | Bins with >2000 counts | High rate bins dominated by noise | Noise dominated (total time) | Noise dominated (detector-on time) | Marked lightcurve |
|---|---|---|---|---|---|---|---|
| A | 7107 | 5676 | 14 | 14 | 0.20% | 0.25% | 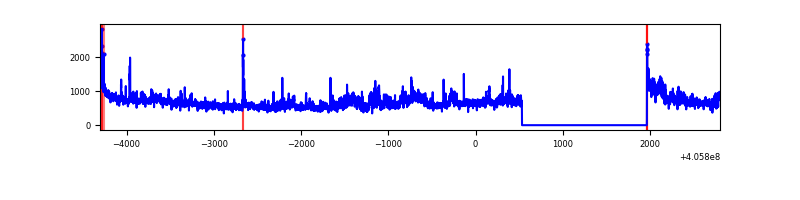 |
| B | 7107 | 5676 | 612 | 612 | 8.61% | 10.78% | 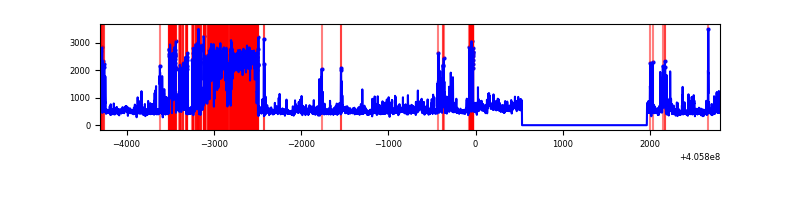 |
| C | 7107 | 5676 | 2 | 2 | 0.03% | 0.04% | 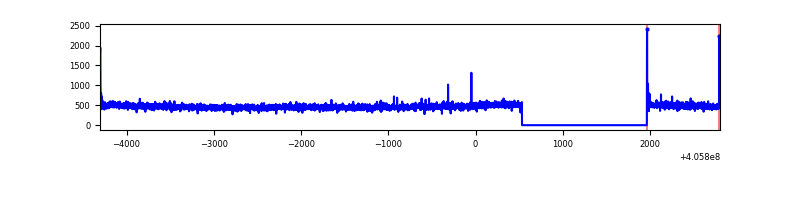 |
| D | 7107 | 5676 | 25 | 25 | 0.35% | 0.44% | 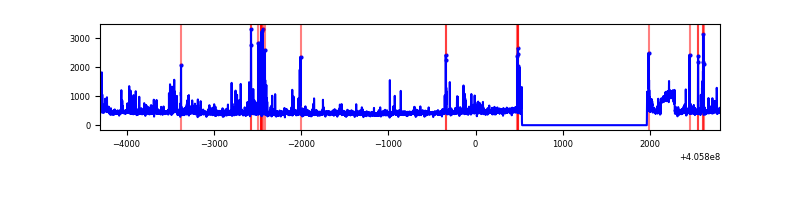 |
Top three noisy pixels from each quadrant. If the there are fewer than three noisy pixels in the level2.evt file, extra rows are filled as -1
| Pixel properties | Quadrant properties | ||||||
|---|---|---|---|---|---|---|---|
| Quadrant | DetID | PixID | Counts | Sigma | Mean | Median | Sigma |
| A | 15 | 222 | 892564 | 7044.12 | 628 | 616 | 126.6 |
| A | 10 | 83 | 424500 | 3347.6 | 628 | 616 | 126.6 |
| A | 12 | 189 | 65793 | 514.73 | 628 | 616 | 126.6 |
| B | 5 | 184 | 1324015 | 11862.62 | 581 | 565 | 111.6 |
| B | 8 | 3 | 709566 | 6355.06 | 581 | 565 | 111.6 |
| B | 0 | 229 | 191694 | 1713.17 | 581 | 565 | 111.6 |
| C | 15 | 214 | 235291 | 1636.46 | 615 | 619 | 143.4 |
| C | 0 | 10 | 18011 | 121.28 | 615 | 619 | 143.4 |
| C | 14 | 254 | 5627 | 34.92 | 615 | 619 | 143.4 |
| D | 13 | 249 | 170576 | 1137.53 | 614 | 598 | 149.4 |
| D | 2 | 250 | 62058 | 411.31 | 614 | 598 | 149.4 |
| D | 7 | 223 | 42548 | 280.74 | 614 | 598 | 149.4 |
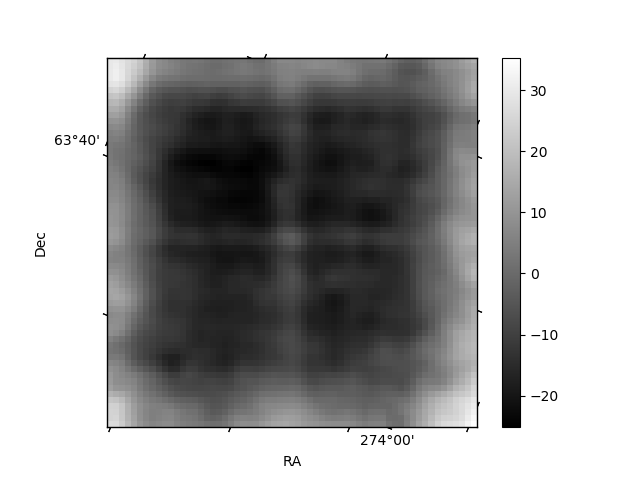
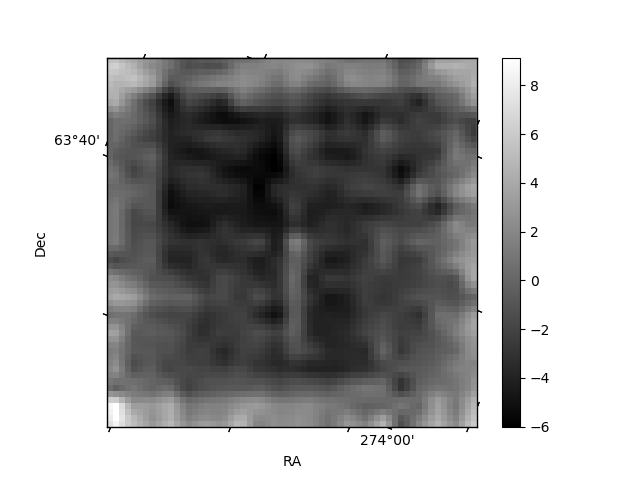
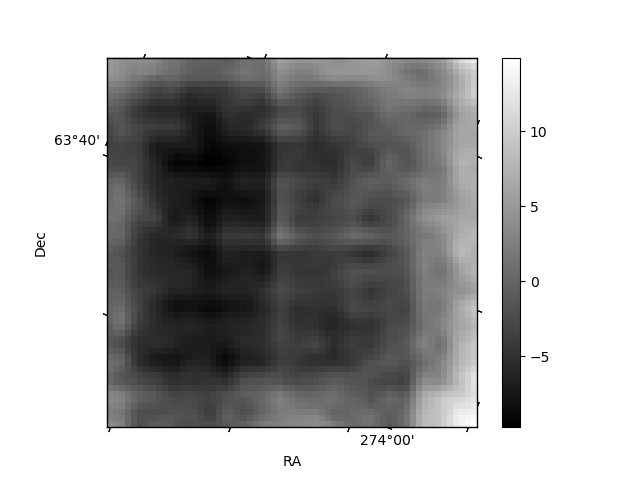
Histogram calculated using DETX and DETY for each event in the final _common_clean file
| Quadrant A | 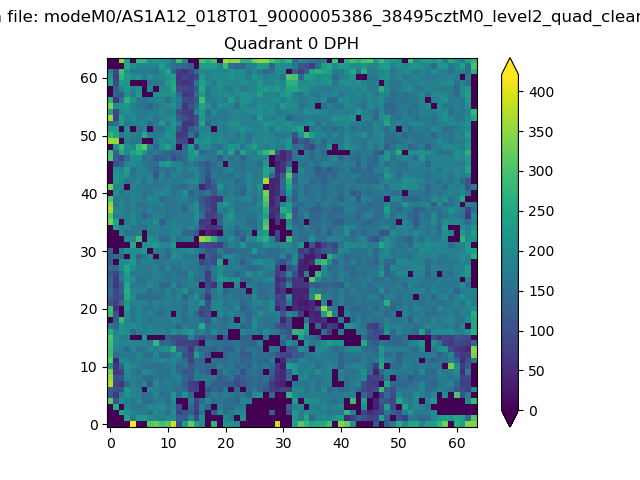 |
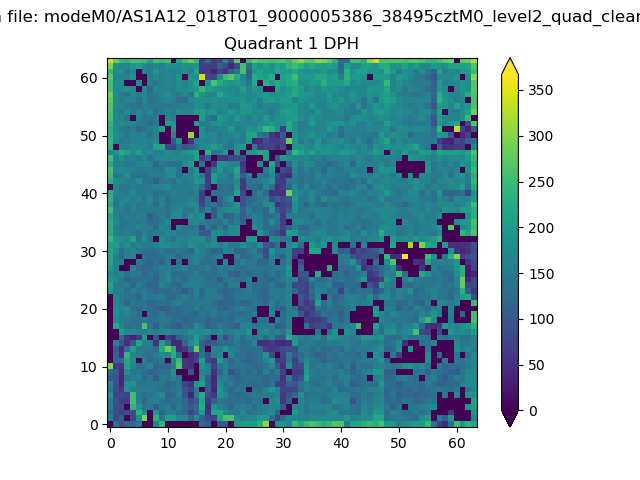 |
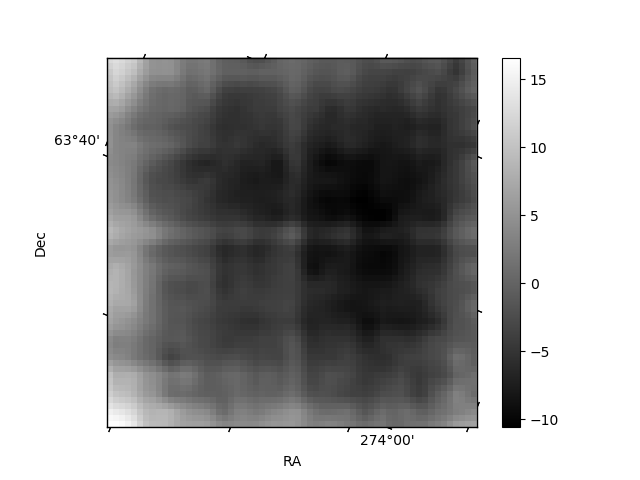
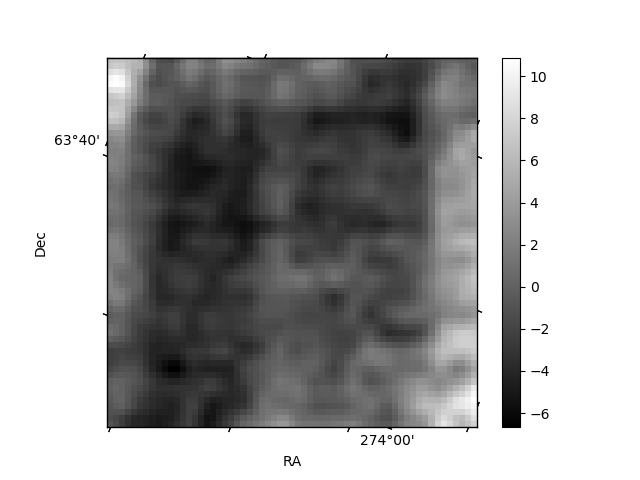
Quadrant B |
|---|---|---|---|
| Quadrant D | 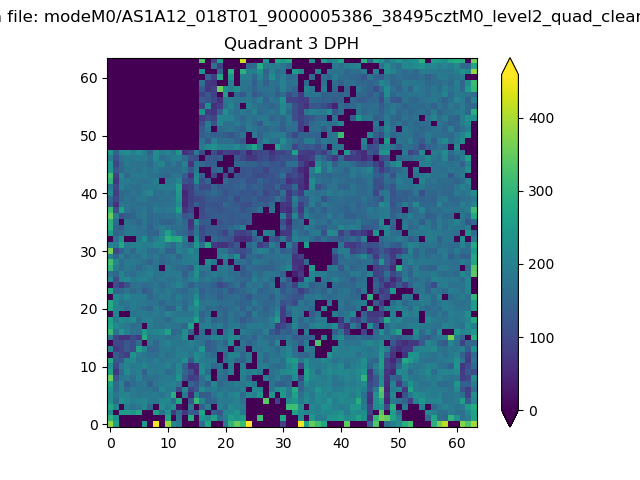 |
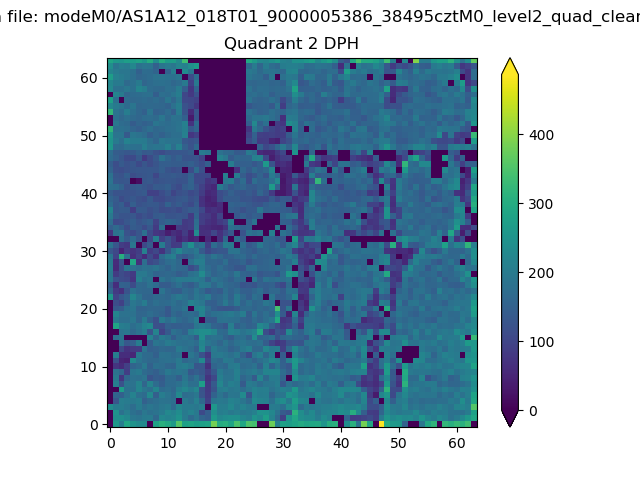 |
Quadrant C |
| Plot type | Count rate plots | Images |
|---|---|---|
| Comparison with Poisson distribution Blue bars denote a histogram of data divided into 1 sec bins. Red curve is a Poisson curve with rate = median count rate of data. |
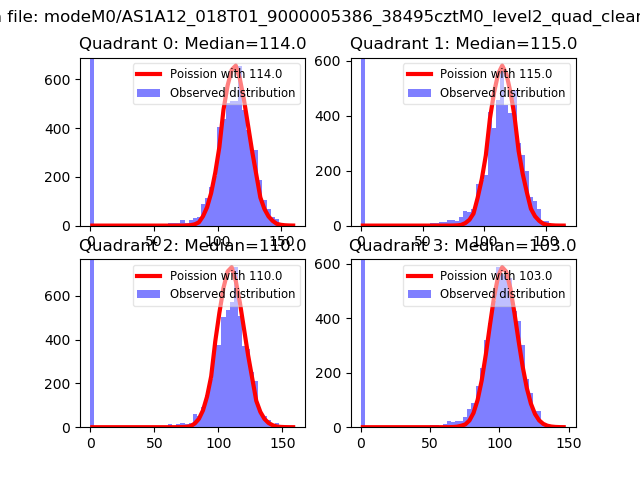 |
 |
| Quadrant-wise count rates Data is divided into 100 sec bins |
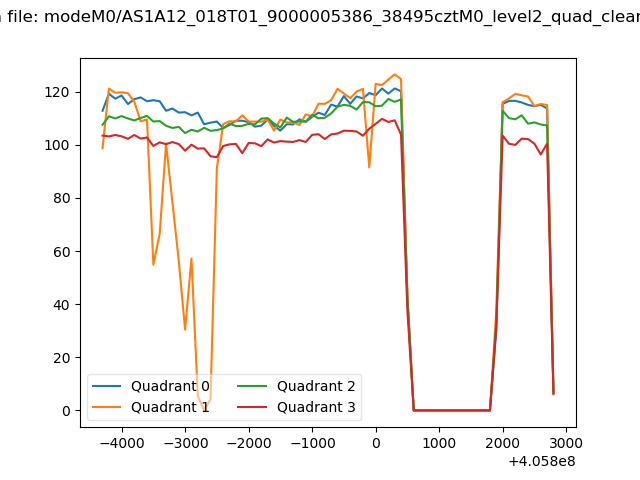 |
|
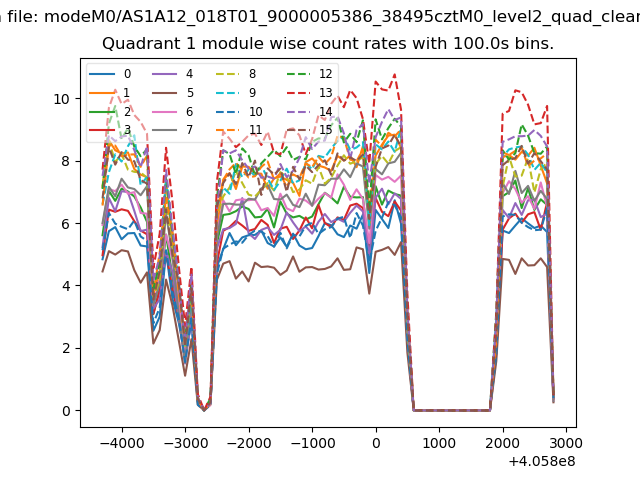
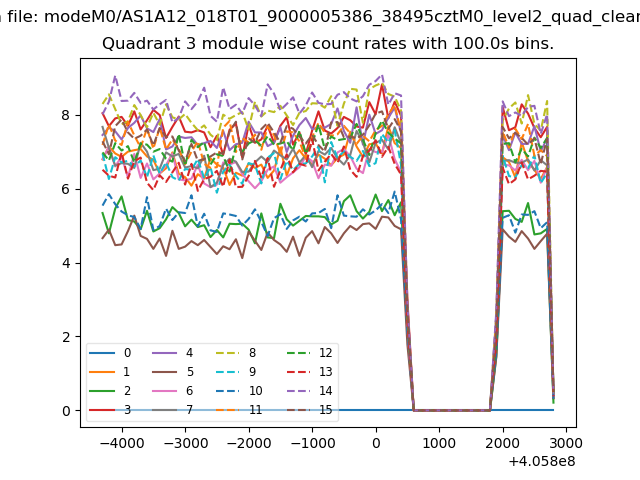
| Module-wise count rates for Quadrant A Data is divided into 100 sec bins |
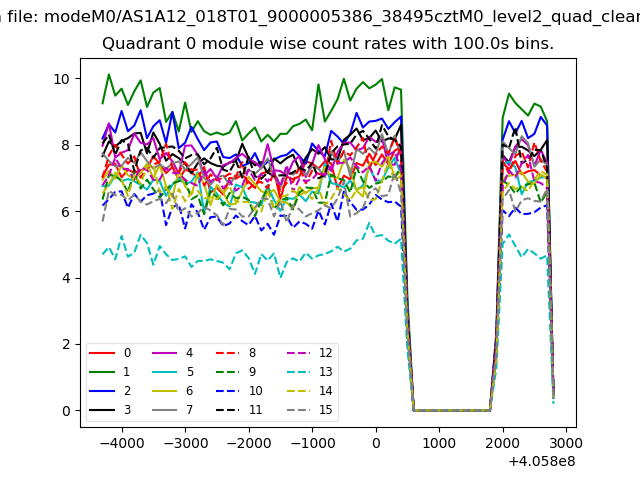 |
 |
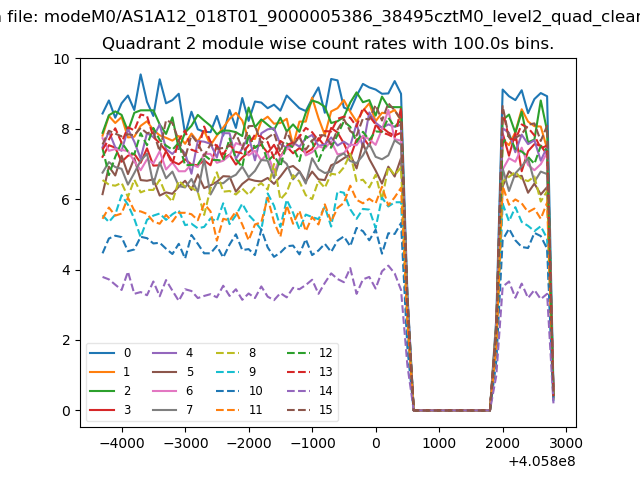
| Module-wise count rates for Quadrant B Data is divided into 100 sec bins |
 |
 |
| Module-wise count rates for Quadrant C Data is divided into 100 sec bins |
 |
 |
| Module-wise count rates for Quadrant D Data is divided into 100 sec bins |
 |
 |
| Parameter | Plot |
|---|---|
| CZT HV Monitor | 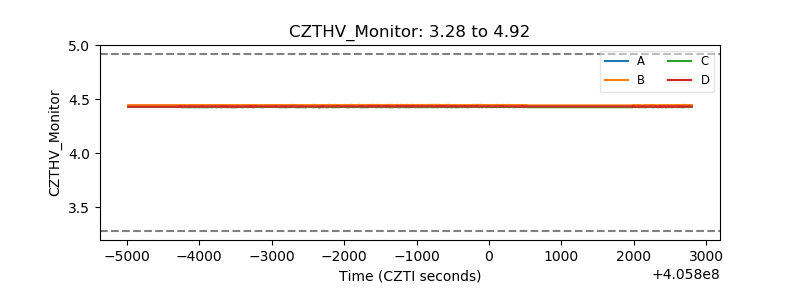 |
| D_VDD | 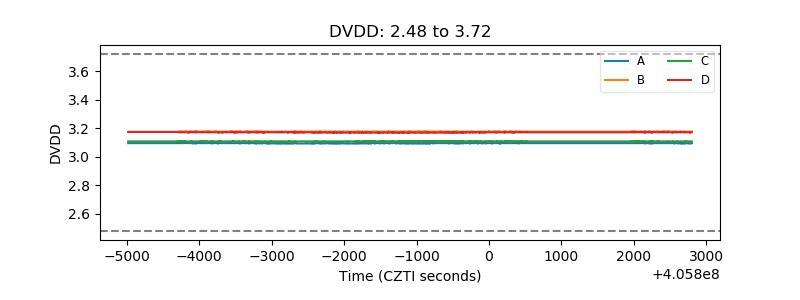 |
| Temperature 1 | 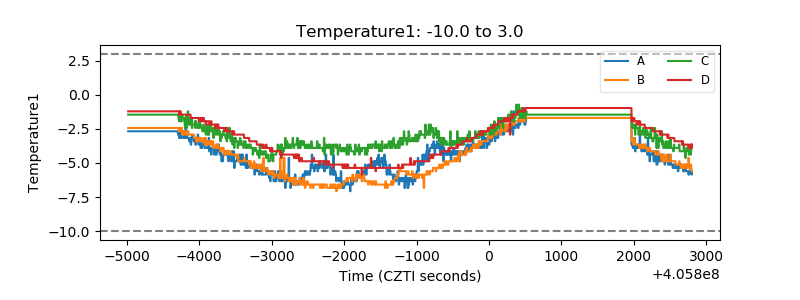 |
| Veto HV Monitor | 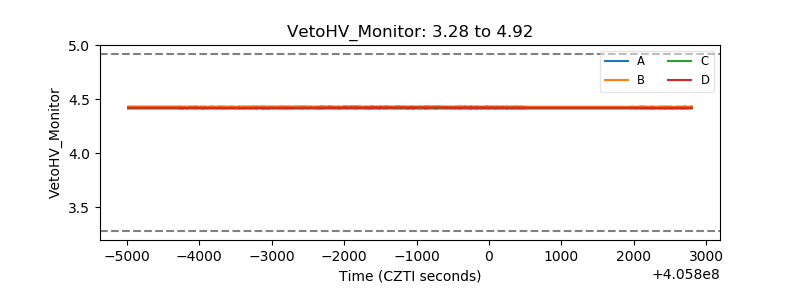 |
| Veto LLD | 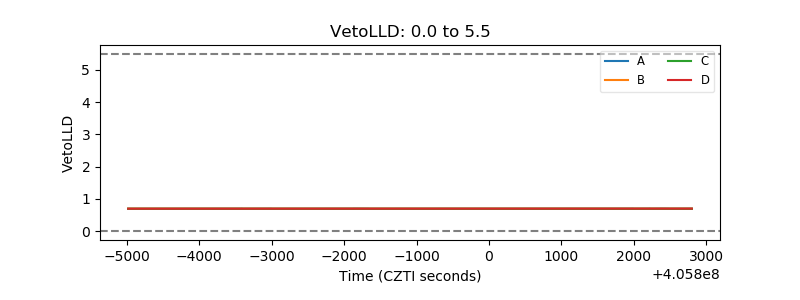 |
| Alpha Counter | 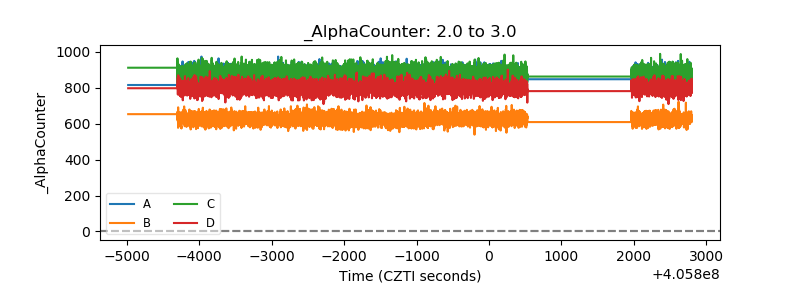 |
| _CPM_Rate | 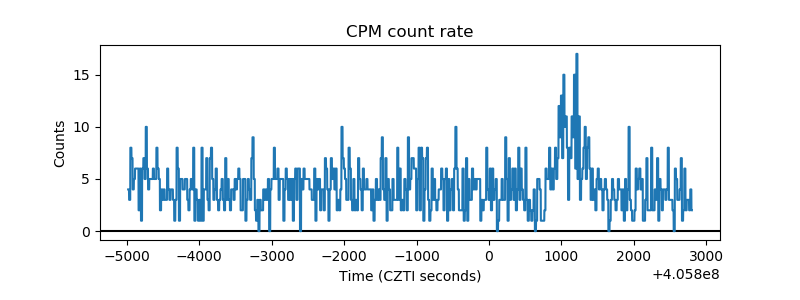 |
| CZT Counter | 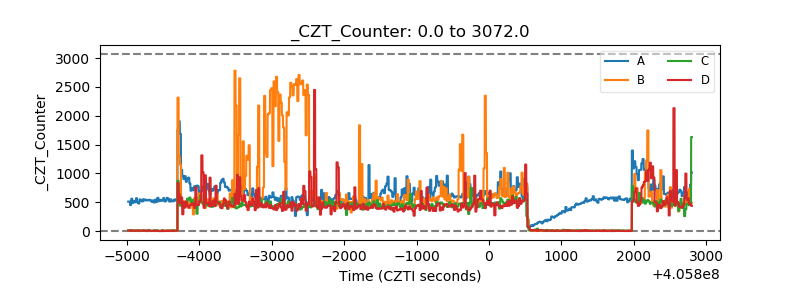 |
| +2.5 Volts monitor | 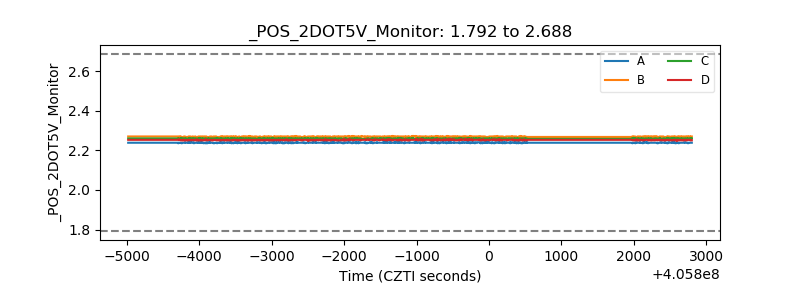 |
| +5 Volts monitor | 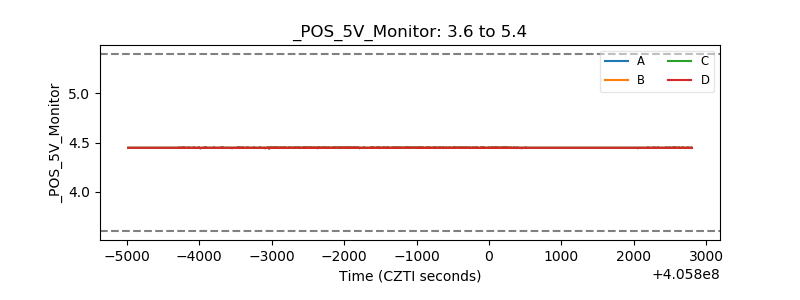 |
| _ROLL_ROT | 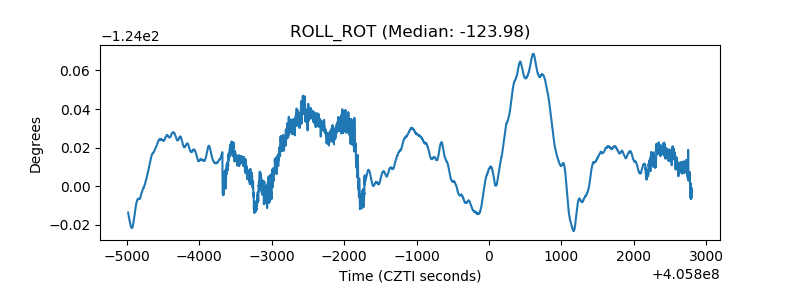 |
| _Roll_DEC | 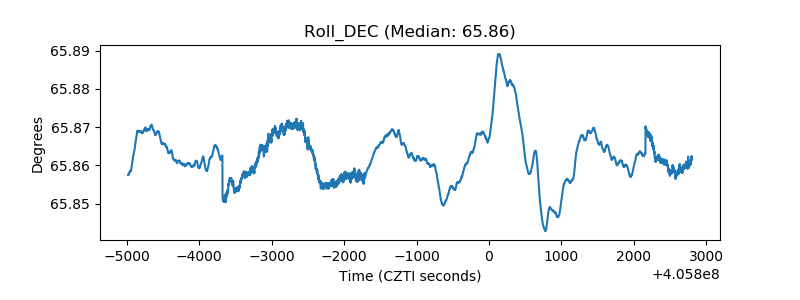 |
| _Roll_RA | 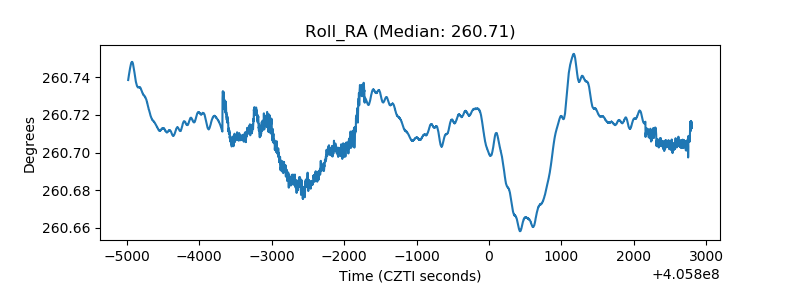 |
| Veto Counter | 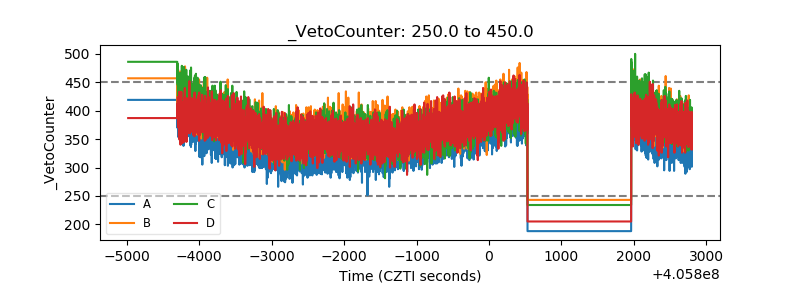 |