| Param | Original file | Final file |
|---|---|---|
| Filename | modeM0/AS1A12_018T01_9000005386_38496cztM0_level2.fits | modeM0/AS1A12_018T01_9000005386_38496cztM0_level2_quad_clean.evt |
| Size (bytes) | 384,664,320 | 97,882,560 |
| Size | 366.8 MB | 93.3 MB |
| Events in quadrant A | 3,952,954 | 661,763 |
| Events in quadrant B | 3,307,117 | 666,777 |
| Events in quadrant C | 2,847,576 | 640,937 |
| Events in quadrant D | 3,672,959 | 582,368 |
| Mode SS | |||
|---|---|---|---|
| Quadrant | BADHDUFLAG | Total packets | Discarded packets |
| A | 0 | 120 | 0 |
| B | 0 | 120 | 0 |
| C | 0 | 120 | 0 |
| D | 0 | 120 | 0 |
| Mode M9 | |||
|---|---|---|---|
| Quadrant | BADHDUFLAG | Total packets | Discarded packets |
| A | 0 | 18 | 0 |
| B | 0 | 18 | 0 |
| C | 0 | 18 | 0 |
| D | 0 | 19 | 0 |
| Mode M0 | |||
|---|---|---|---|
| Quadrant | BADHDUFLAG | Total packets | Discarded packets |
| A | 0 | 15943 | 3 |
| B | 0 | 13833 | 2 |
| C | 0 | 12149 | 2 |
| D | 0 | 15136 | 2 |
| Quadrant | Total seconds | Saturated seconds | Saturation percentage |
|---|---|---|---|
| A | 5894 | 33 | 0.559891% |
| B | 5894 | 92 | 1.560909% |
| C | 5894 | 10 | 0.169664% |
| D | 5894 | 208 | 3.529013% |
Noise dominated data is calculated using 1-second bins in cleaned event files. If a bin has >2000 counts, and if more than 50% of those come from <1% of pixels, then it is considered to be noise-dominated and hence unusable.
| Quadrant | # 1 sec bins | Bins with >0 counts | Bins with >2000 counts | High rate bins dominated by noise | Noise dominated (total time) | Noise dominated (detector-on time) | Marked lightcurve |
|---|---|---|---|---|---|---|---|
| A | 7206 | 5895 | 18 | 18 | 0.25% | 0.31% | 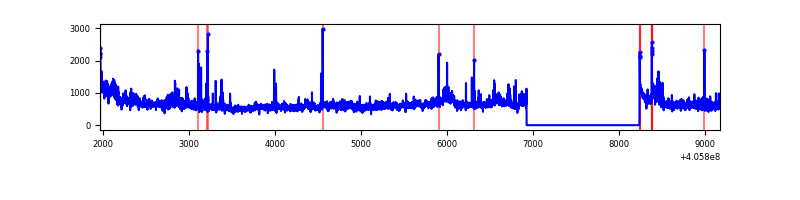 |
| B | 7206 | 5895 | 55 | 55 | 0.76% | 0.93% | 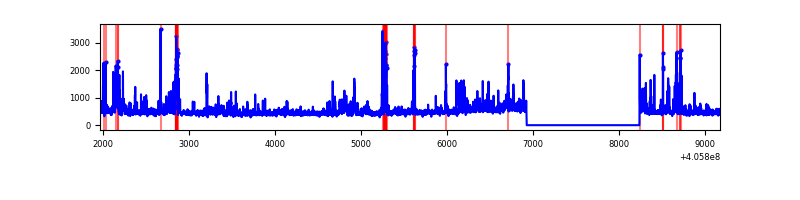 |
| C | 7206 | 5895 | 9 | 9 | 0.12% | 0.15% | 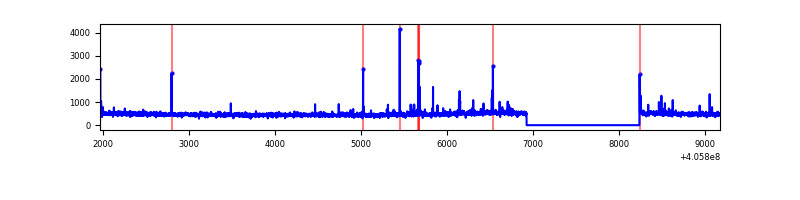 |
| D | 7206 | 5895 | 175 | 175 | 2.43% | 2.97% | 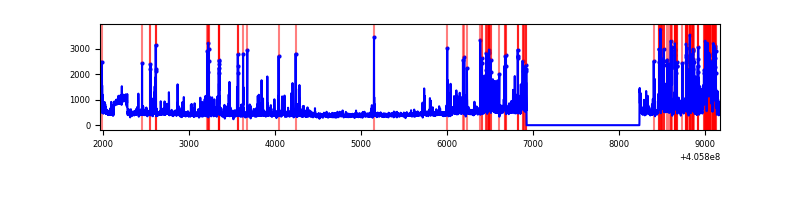 |
Top three noisy pixels from each quadrant. If the there are fewer than three noisy pixels in the level2.evt file, extra rows are filled as -1
| Pixel properties | Quadrant properties | ||||||
|---|---|---|---|---|---|---|---|
| Quadrant | DetID | PixID | Counts | Sigma | Mean | Median | Sigma |
| A | 15 | 222 | 866600 | 6530.55 | 653 | 640 | 132.6 |
| A | 10 | 83 | 421365 | 3172.86 | 653 | 640 | 132.6 |
| A | 9 | 143 | 75777 | 566.64 | 653 | 640 | 132.6 |
| B | 5 | 184 | 177294 | 1408.0 | 649 | 632 | 125.5 |
| B | 0 | 229 | 125453 | 994.83 | 649 | 632 | 125.5 |
| B | 4 | 171 | 104909 | 831.09 | 649 | 632 | 125.5 |
| C | 15 | 214 | 244379 | 1610.43 | 641 | 644 | 151.3 |
| C | 14 | 254 | 55445 | 362.09 | 641 | 644 | 151.3 |
| C | 1 | 23 | 19532 | 124.8 | 641 | 644 | 151.3 |
| D | 12 | 227 | 390960 | 2528.28 | 633 | 615 | 154.4 |
| D | 13 | 249 | 335203 | 2167.14 | 633 | 615 | 154.4 |
| D | 2 | 250 | 174096 | 1123.64 | 633 | 615 | 154.4 |
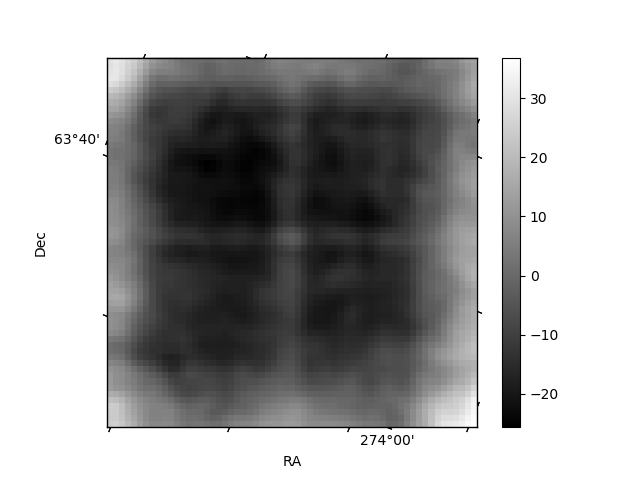
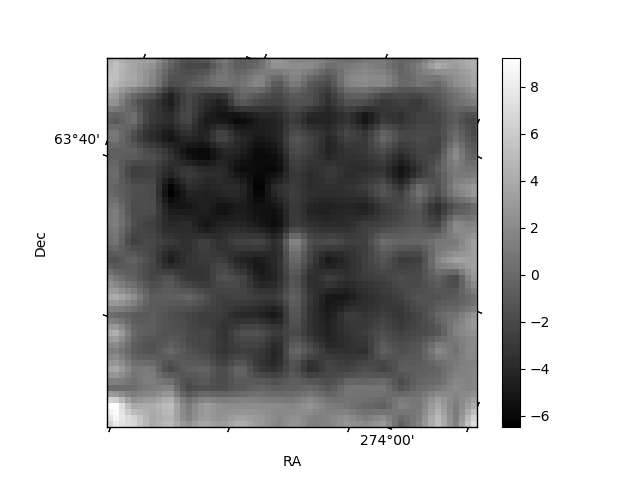
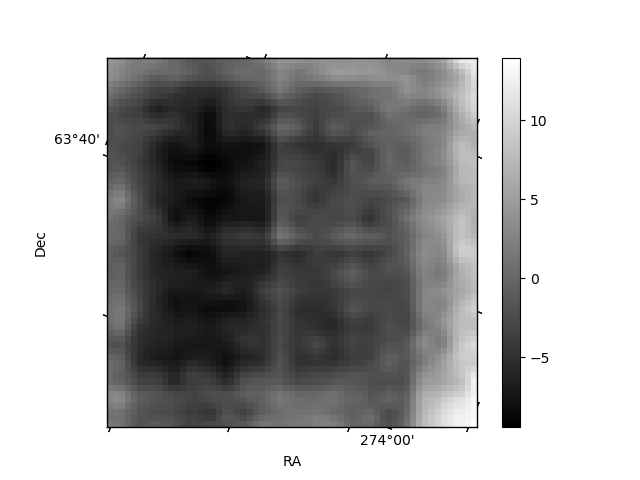
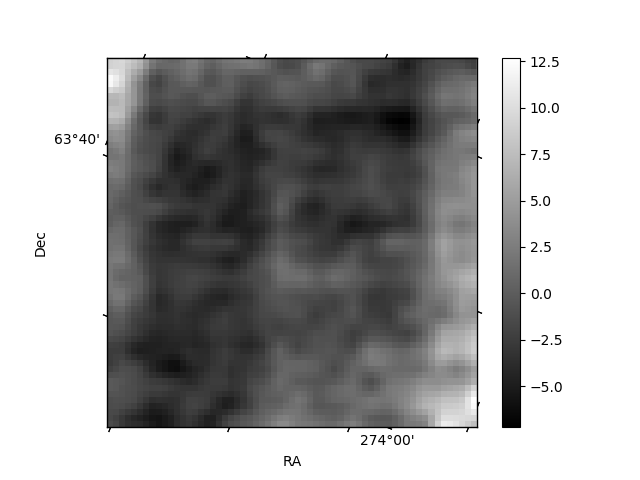
Histogram calculated using DETX and DETY for each event in the final _common_clean file
| Quadrant A | 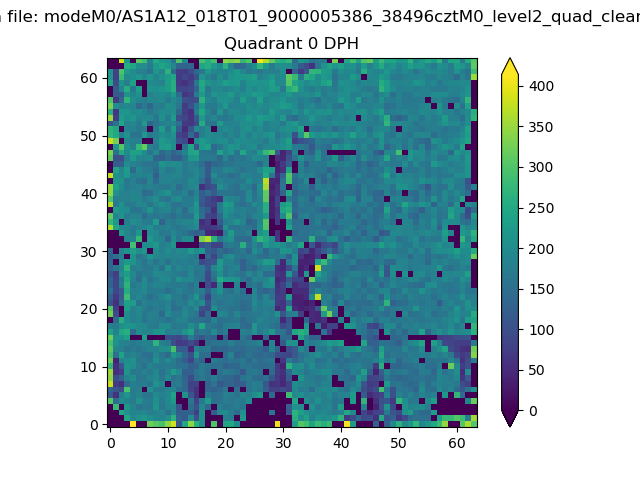 |
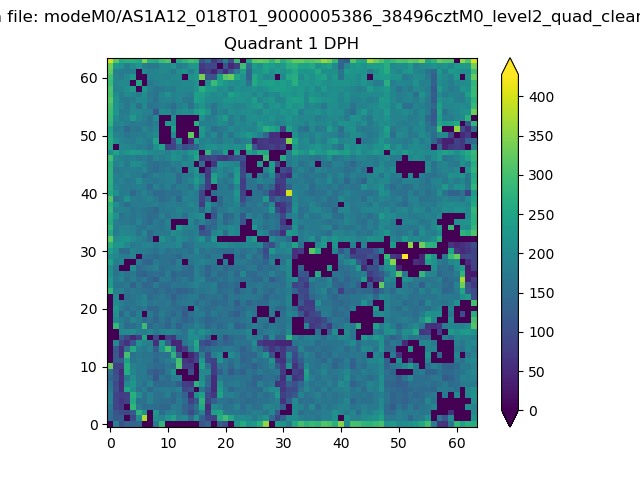 |
Quadrant B |
|---|---|---|---|
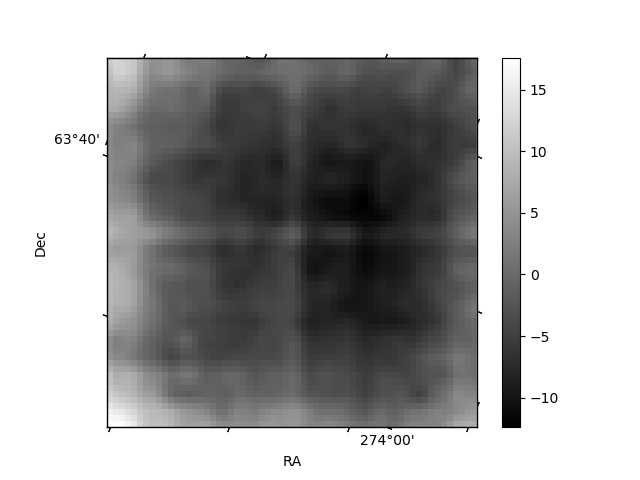
| Quadrant D | 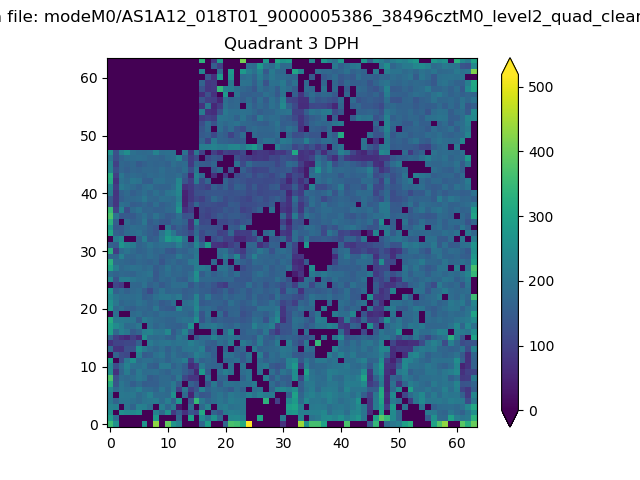 |
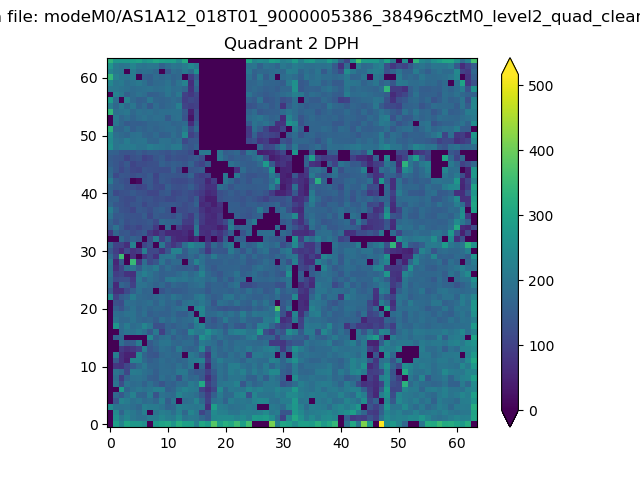 |
Quadrant C |
| Plot type | Count rate plots | Images |
|---|---|---|
| Comparison with Poisson distribution Blue bars denote a histogram of data divided into 1 sec bins. Red curve is a Poisson curve with rate = median count rate of data. |
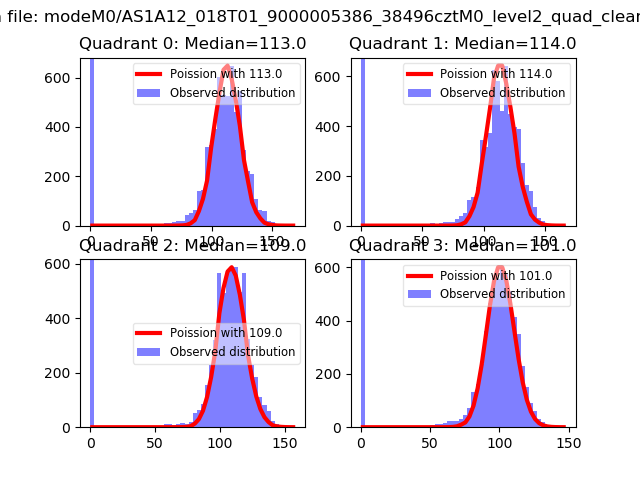 |
 |
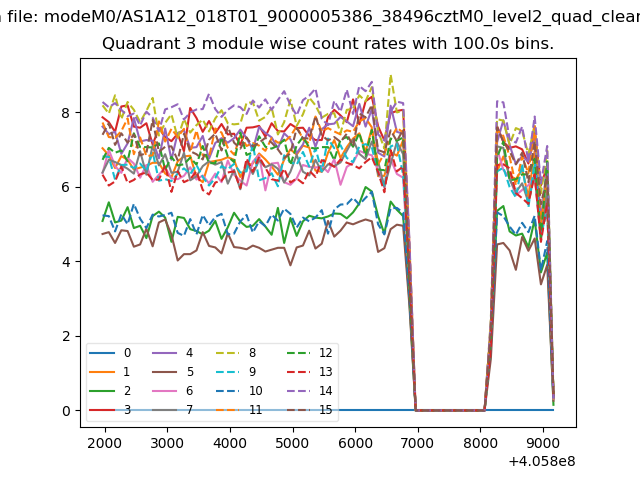
| Quadrant-wise count rates Data is divided into 100 sec bins |
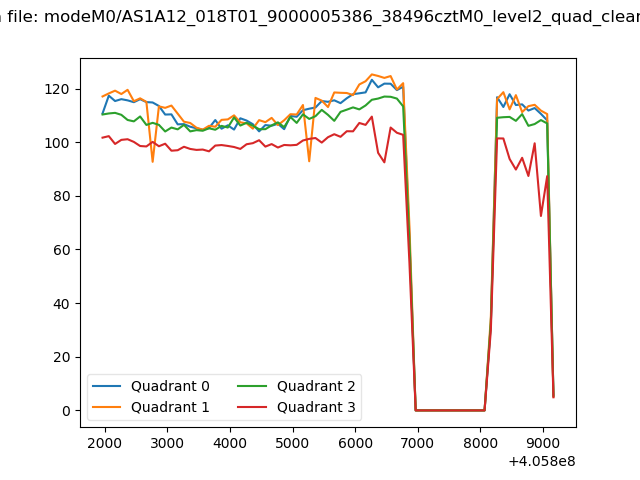 |
|
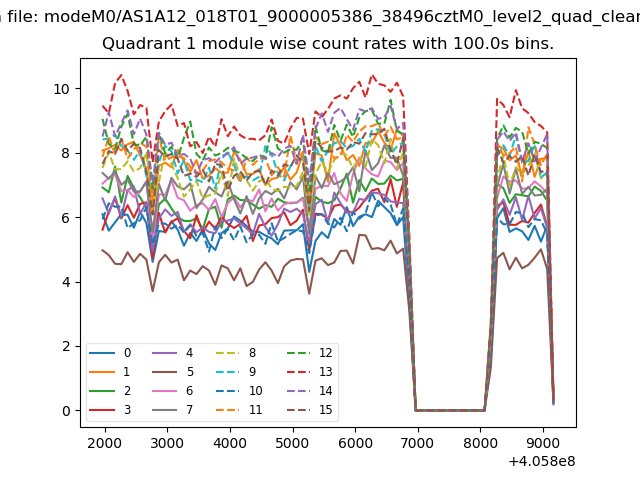
| Module-wise count rates for Quadrant A Data is divided into 100 sec bins |
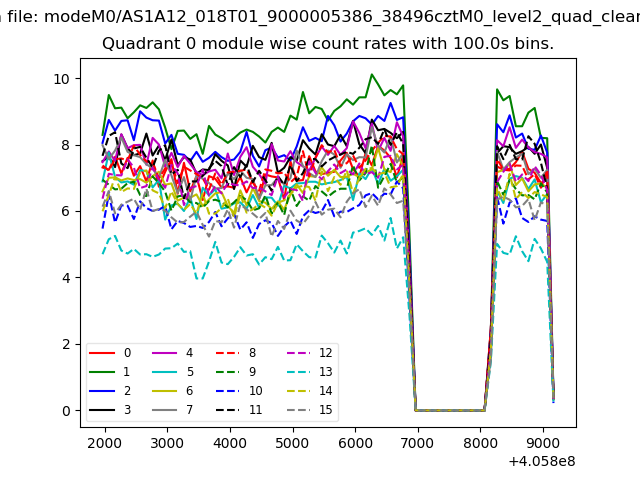 |
 |
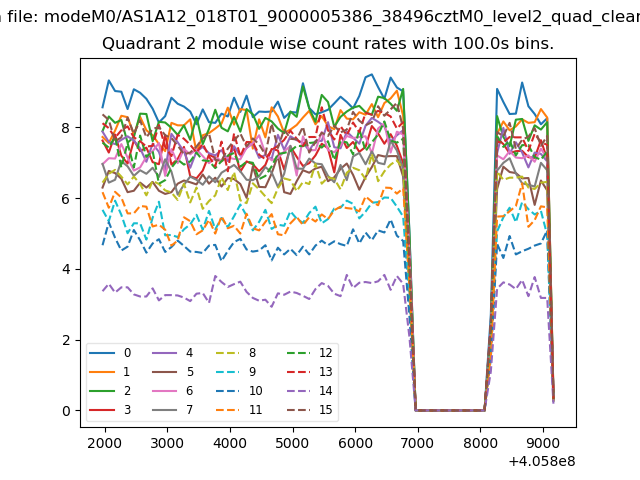
| Module-wise count rates for Quadrant B Data is divided into 100 sec bins |
 |
 |
| Module-wise count rates for Quadrant C Data is divided into 100 sec bins |
 |
 |
| Module-wise count rates for Quadrant D Data is divided into 100 sec bins |
 |
 |
| Parameter | Plot |
|---|---|
| CZT HV Monitor | 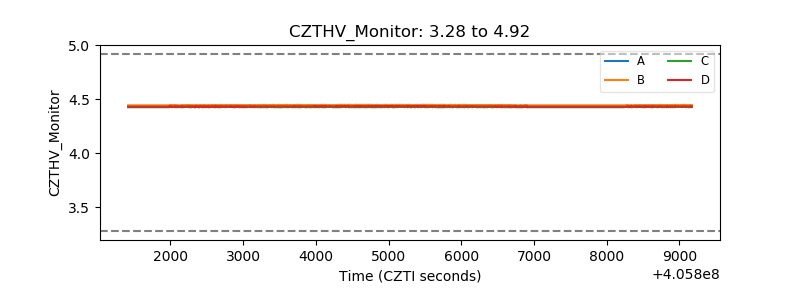 |
| D_VDD | 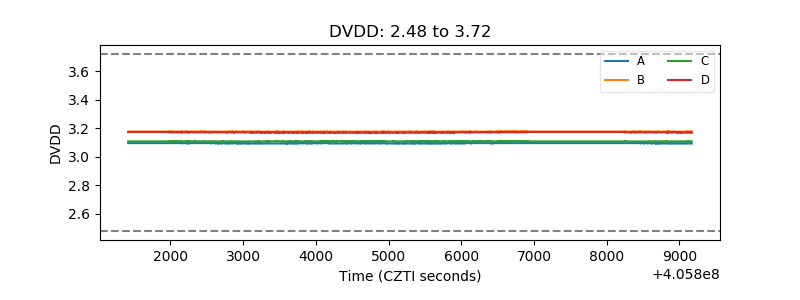 |
| Temperature 1 | 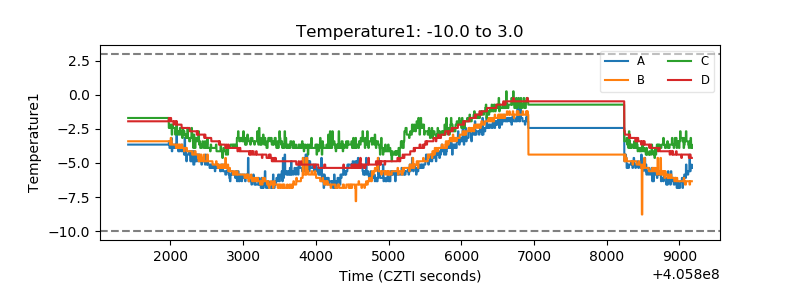 |
| Veto HV Monitor | 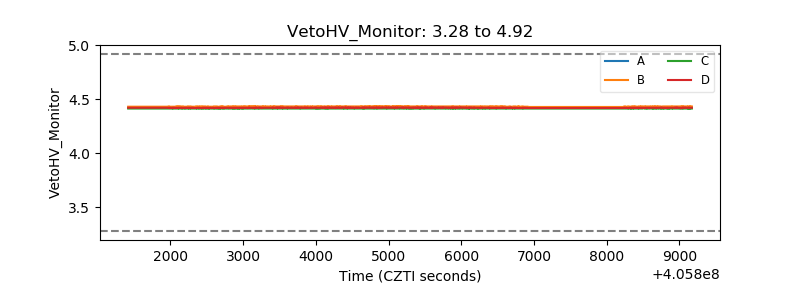 |
| Veto LLD | 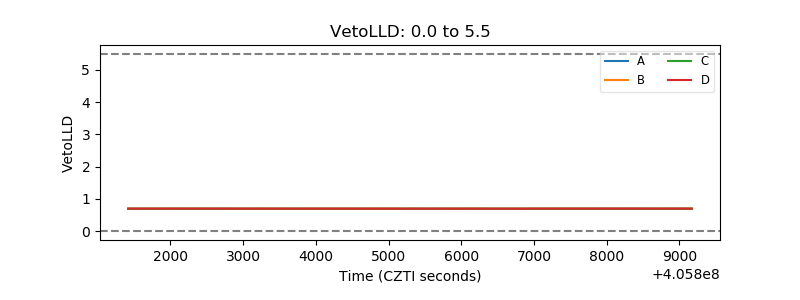 |
| Alpha Counter |  |
| _CPM_Rate | 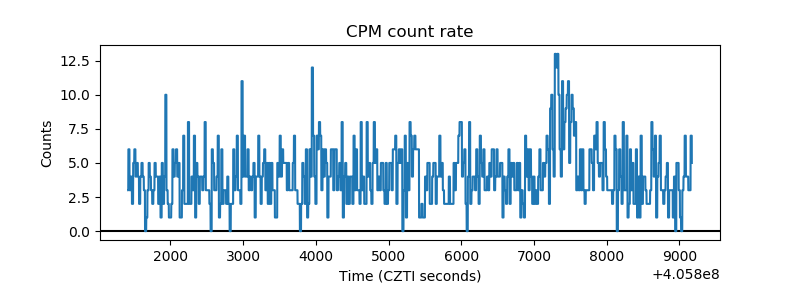 |
| CZT Counter | 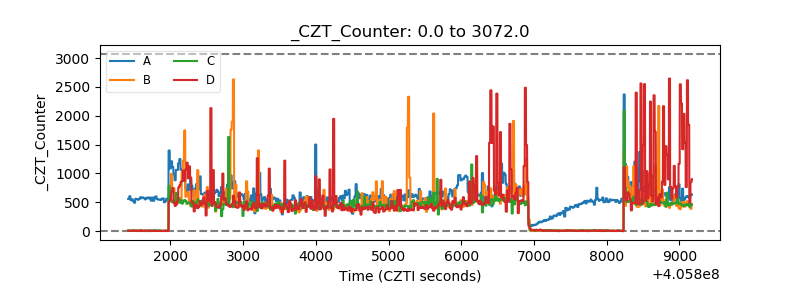 |
| +2.5 Volts monitor | 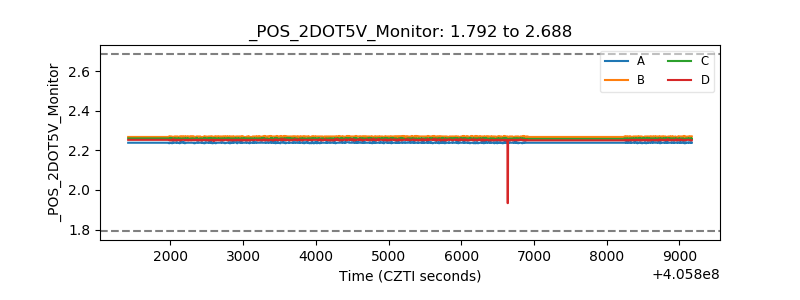 |
| +5 Volts monitor | 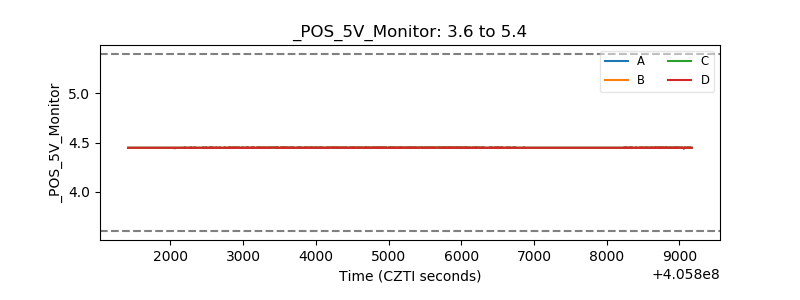 |
| _ROLL_ROT | 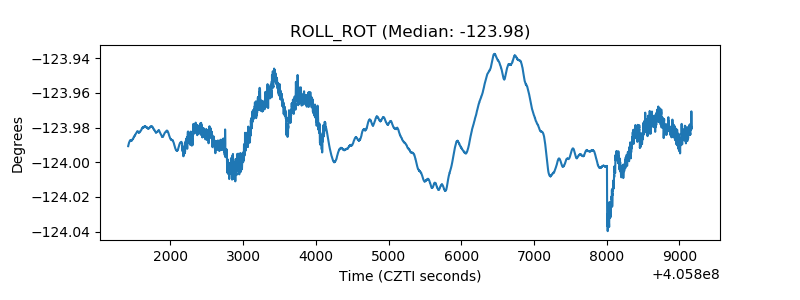 |
| _Roll_DEC | 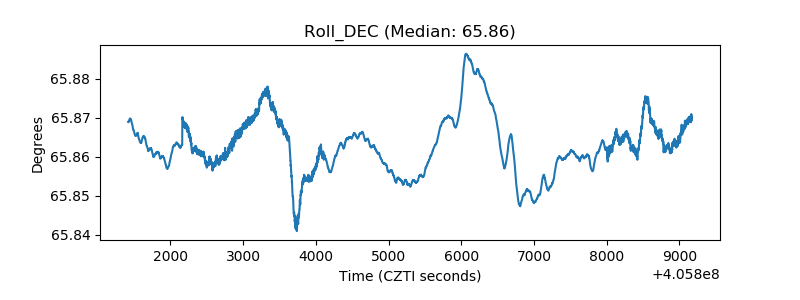 |
| _Roll_RA | 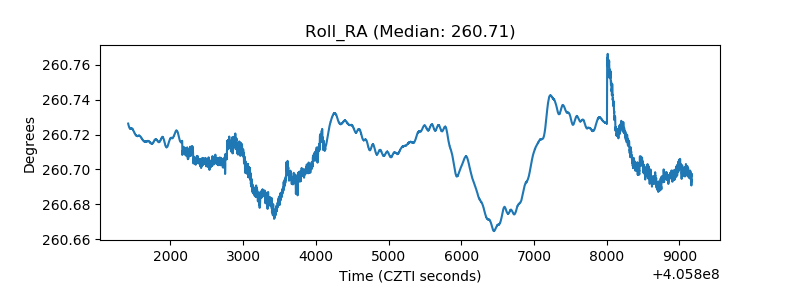 |
| Veto Counter | 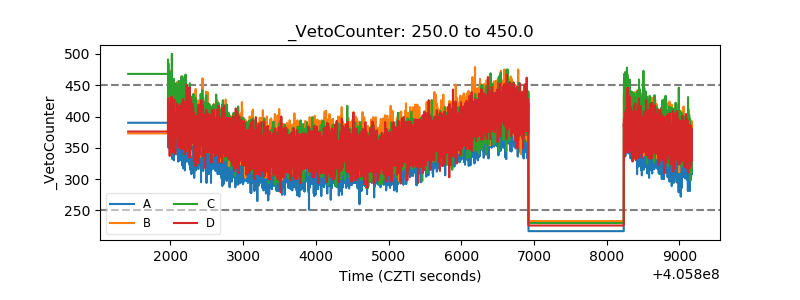 |