| Param | Original file | Final file |
|---|---|---|
| Filename | modeM0/AS1A12_018T01_9000005386_38499cztM0_level2.fits | modeM0/AS1A12_018T01_9000005386_38499cztM0_level2_quad_clean.evt |
| Size (bytes) | 1,102,374,720 | 249,177,600 |
| Size | 1.0 GB | 237.6 MB |
| Events in quadrant A | 9,378,158 | 1,713,965 |
| Events in quadrant B | 8,500,878 | 1,734,088 |
| Events in quadrant C | 7,536,798 | 1,674,904 |
| Events in quadrant D | 14,182,736 | 1,344,801 |
| Mode SS | |||
|---|---|---|---|
| Quadrant | BADHDUFLAG | Total packets | Discarded packets |
| A | 0 | 318 | 0 |
| B | 0 | 318 | 0 |
| C | 0 | 318 | 0 |
| D | 0 | 318 | 0 |
| Mode M9 | |||
|---|---|---|---|
| Quadrant | BADHDUFLAG | Total packets | Discarded packets |
| A | 0 | 47 | 0 |
| B | 0 | 47 | 0 |
| C | 0 | 47 | 0 |
| D | 0 | 48 | 0 |
| Mode M0 | |||
|---|---|---|---|
| Quadrant | BADHDUFLAG | Total packets | Discarded packets |
| A | 0 | 37986 | 5 |
| B | 0 | 35596 | 4 |
| C | 0 | 32171 | 4 |
| D | 0 | 53177 | 4 |
| Quadrant | Total seconds | Saturated seconds | Saturation percentage |
|---|---|---|---|
| A | 15602 | 136 | 0.871683% |
| B | 15602 | 274 | 1.756185% |
| C | 15602 | 21 | 0.134598% |
| D | 15602 | 2218 | 14.216126% |
Noise dominated data is calculated using 1-second bins in cleaned event files. If a bin has >2000 counts, and if more than 50% of those come from <1% of pixels, then it is considered to be noise-dominated and hence unusable.
| Quadrant | # 1 sec bins | Bins with >0 counts | Bins with >2000 counts | High rate bins dominated by noise | Noise dominated (total time) | Noise dominated (detector-on time) | Marked lightcurve |
|---|---|---|---|---|---|---|---|
| A | 19784 | 15605 | 115 | 115 | 0.58% | 0.74% | 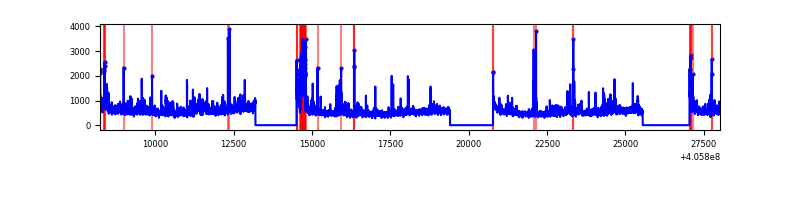 |
| B | 19784 | 15605 | 170 | 170 | 0.86% | 1.09% | 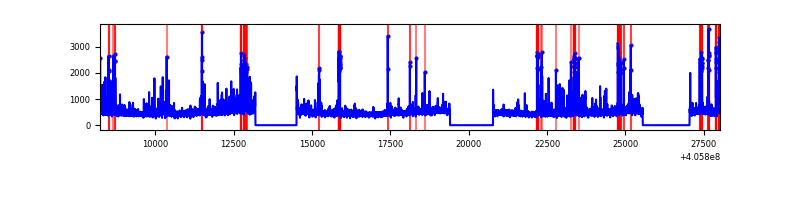 |
| C | 19784 | 15605 | 12 | 12 | 0.06% | 0.08% | 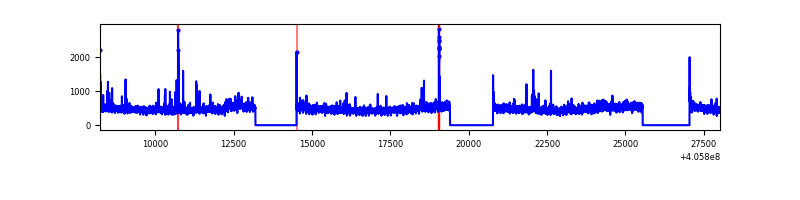 |
| D | 19784 | 15604 | 2010 | 2010 | 10.16% | 12.88% | 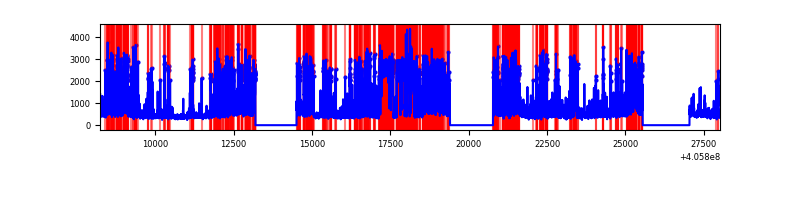 |
Top three noisy pixels from each quadrant. If the there are fewer than three noisy pixels in the level2.evt file, extra rows are filled as -1
| Pixel properties | Quadrant properties | ||||||
|---|---|---|---|---|---|---|---|
| Quadrant | DetID | PixID | Counts | Sigma | Mean | Median | Sigma |
| A | 15 | 222 | 1332716 | 3777.37 | 1738 | 1698 | 352.4 |
| A | 10 | 83 | 996910 | 2824.36 | 1738 | 1698 | 352.4 |
| A | 12 | 189 | 108905 | 304.25 | 1738 | 1698 | 352.4 |
| B | 8 | 3 | 631022 | 1914.3 | 1722 | 1675 | 328.8 |
| B | 4 | 171 | 287144 | 868.32 | 1722 | 1675 | 328.8 |
| B | 5 | 184 | 164403 | 494.97 | 1722 | 1675 | 328.8 |
| C | 15 | 214 | 641659 | 1622.37 | 1693 | 1700 | 394.5 |
| C | 3 | 233 | 118180 | 295.29 | 1693 | 1700 | 394.5 |
| C | 14 | 254 | 73804 | 182.79 | 1693 | 1700 | 394.5 |
| D | 12 | 227 | 4127396 | 10781.33 | 1583 | 1538 | 382.7 |
| D | 13 | 249 | 1704877 | 4451.02 | 1583 | 1538 | 382.7 |
| D | 2 | 250 | 807698 | 2106.59 | 1583 | 1538 | 382.7 |
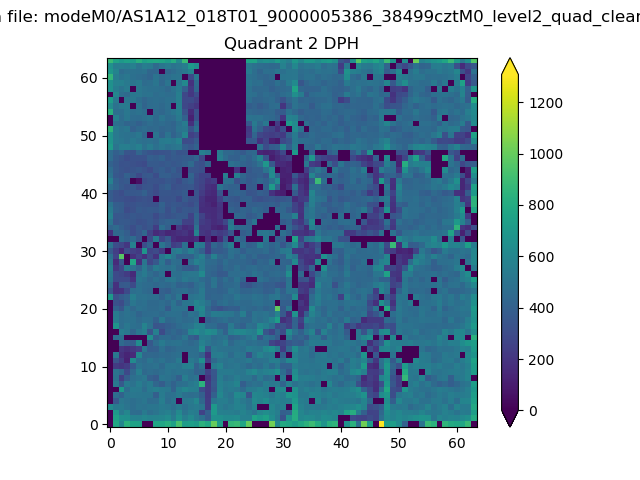
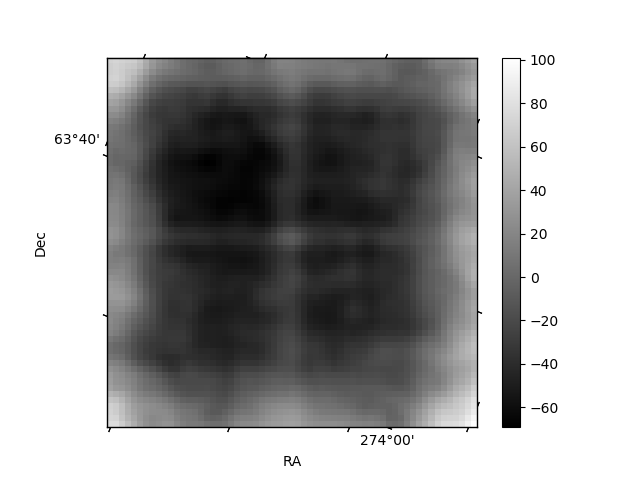
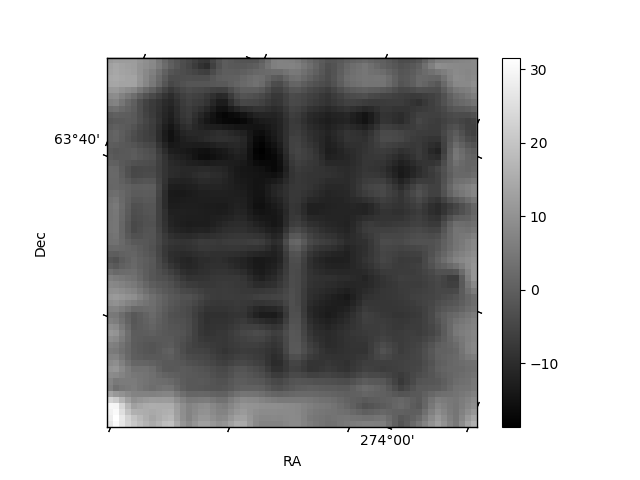
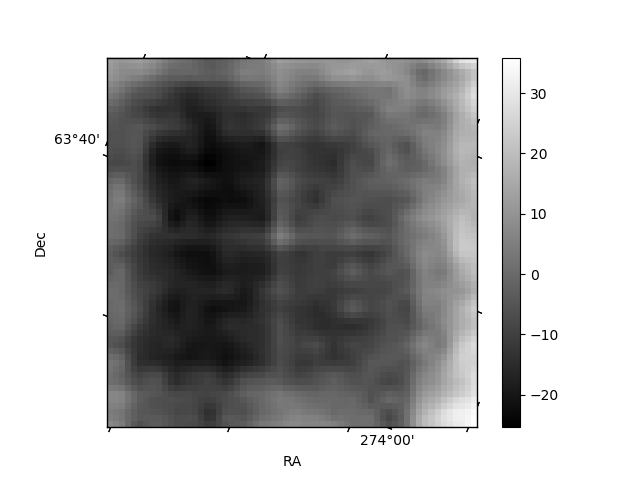
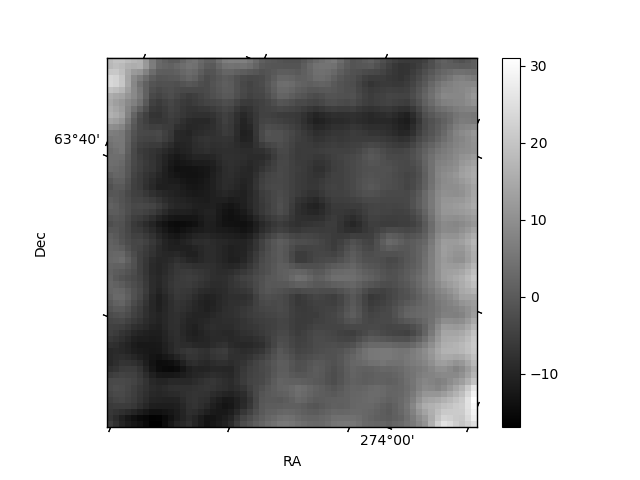
Histogram calculated using DETX and DETY for each event in the final _common_clean file
| Quadrant A | 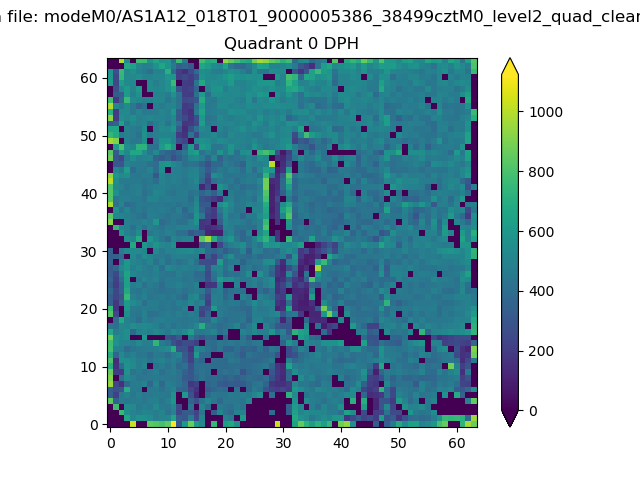 |
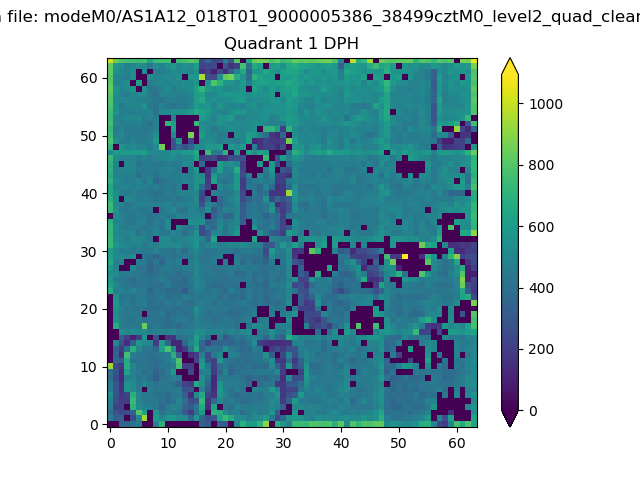 |
Quadrant B |
|---|---|---|---|
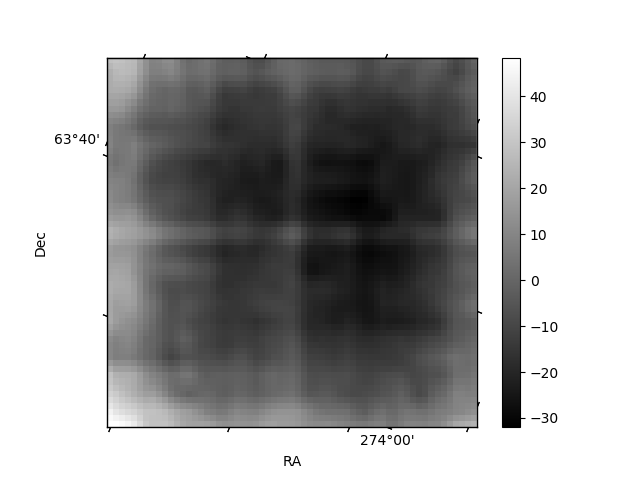
| Quadrant D | 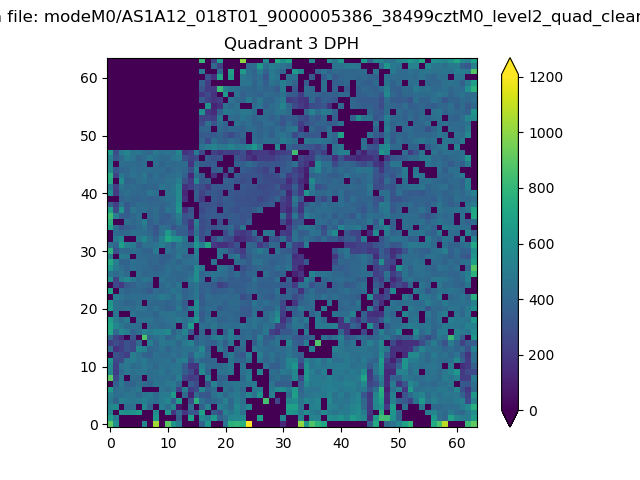 |
 |
Quadrant C |
| Plot type | Count rate plots | Images |
|---|---|---|
| Comparison with Poisson distribution Blue bars denote a histogram of data divided into 1 sec bins. Red curve is a Poisson curve with rate = median count rate of data. |
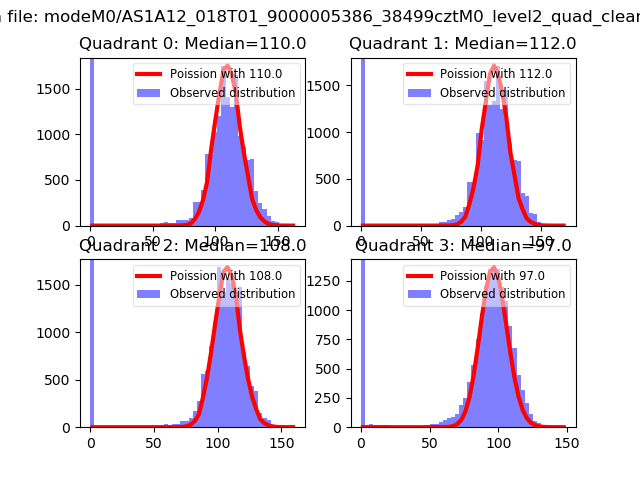 |
 |
| Quadrant-wise count rates Data is divided into 100 sec bins |
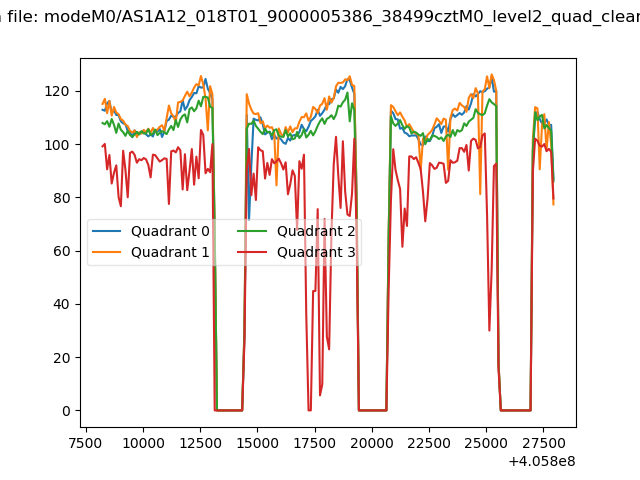 |
|
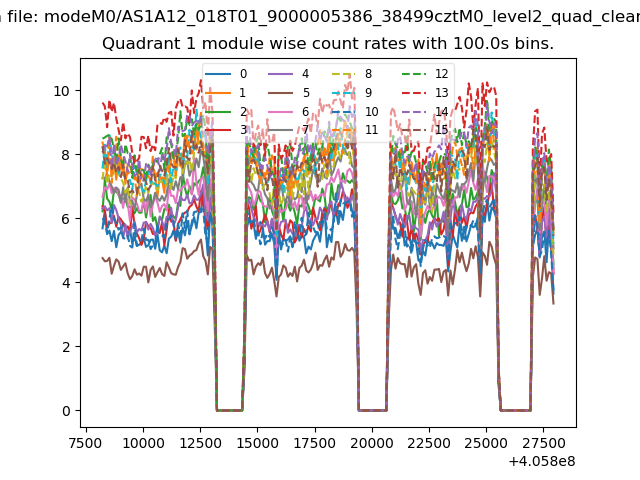
| Module-wise count rates for Quadrant A Data is divided into 100 sec bins |
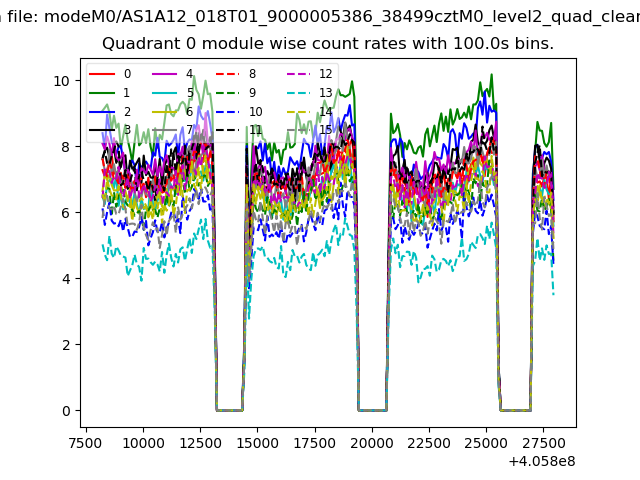 |
 |
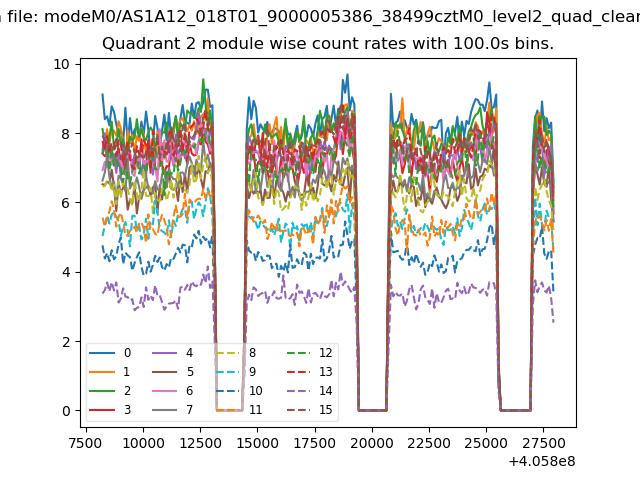
| Module-wise count rates for Quadrant B Data is divided into 100 sec bins |
 |
 |
| Module-wise count rates for Quadrant C Data is divided into 100 sec bins |
 |
 |
| Module-wise count rates for Quadrant D Data is divided into 100 sec bins |
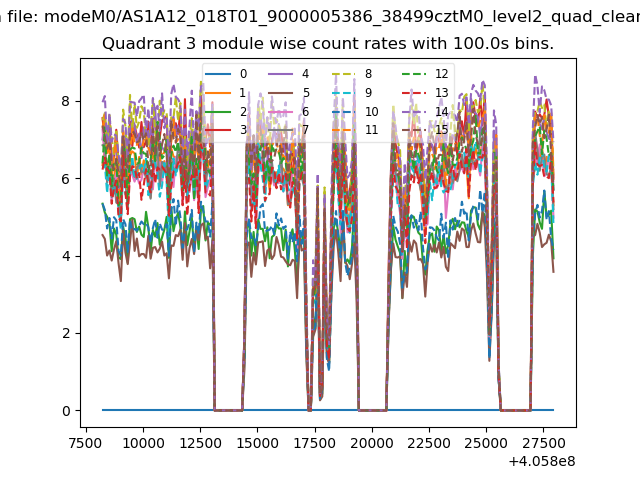 |
 |
| Parameter | Plot |
|---|---|
| CZT HV Monitor |  |
| D_VDD | 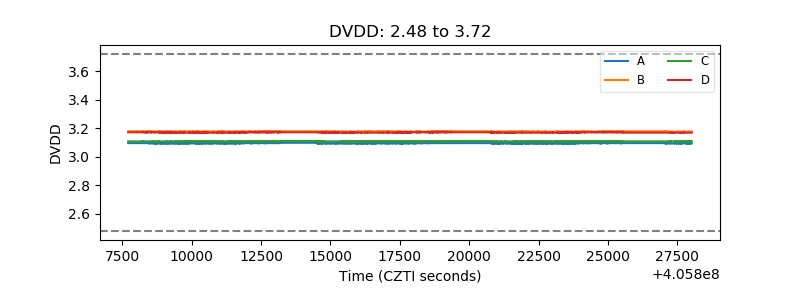 |
| Temperature 1 | 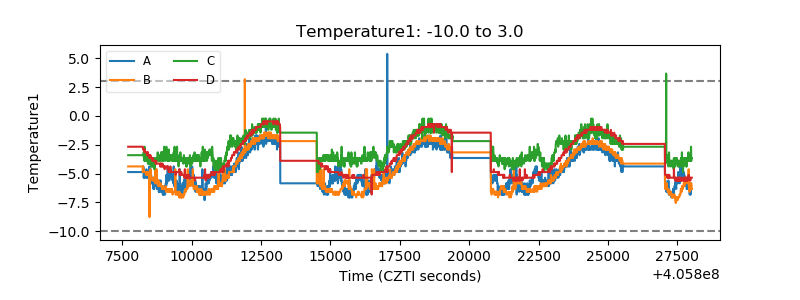 |
| Veto HV Monitor | 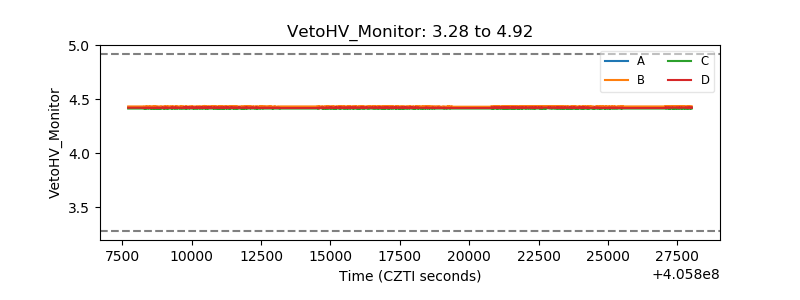 |
| Veto LLD | 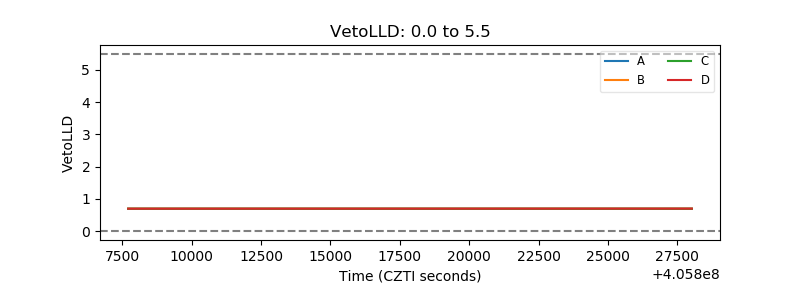 |
| Alpha Counter | 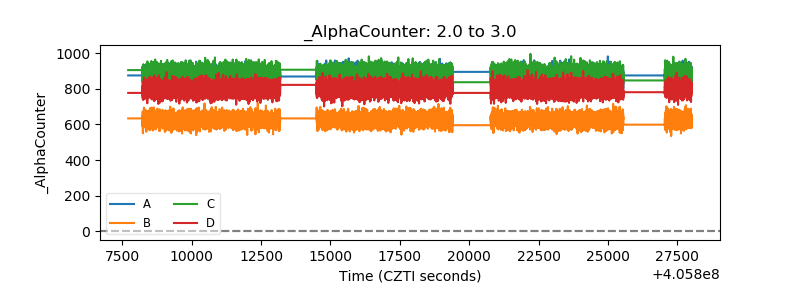 |
| _CPM_Rate | 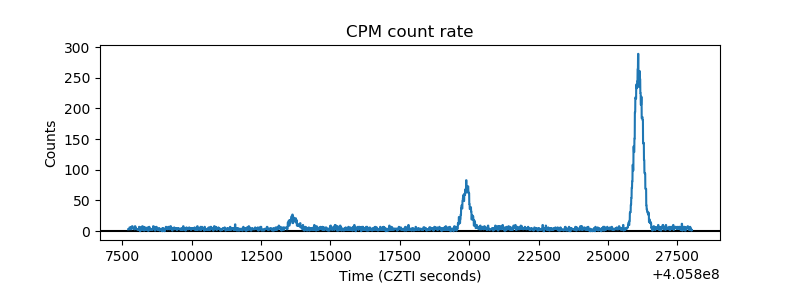 |
| CZT Counter | 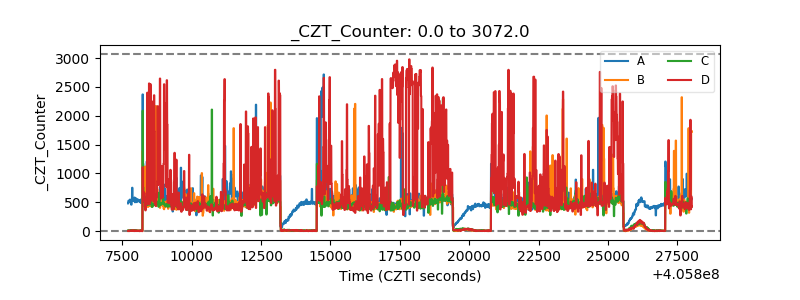 |
| +2.5 Volts monitor | 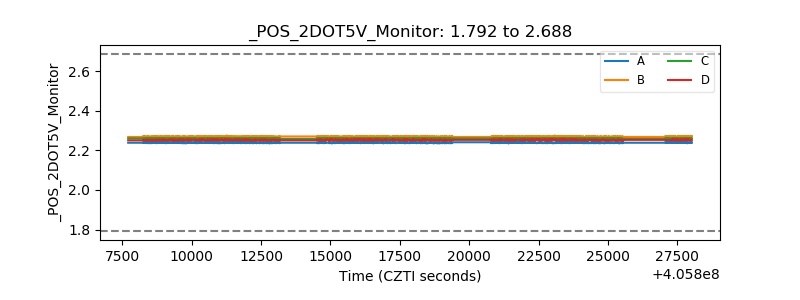 |
| +5 Volts monitor |  |
| _ROLL_ROT | 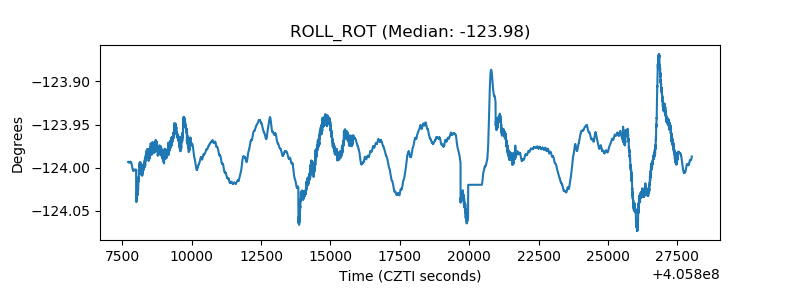 |
| _Roll_DEC | 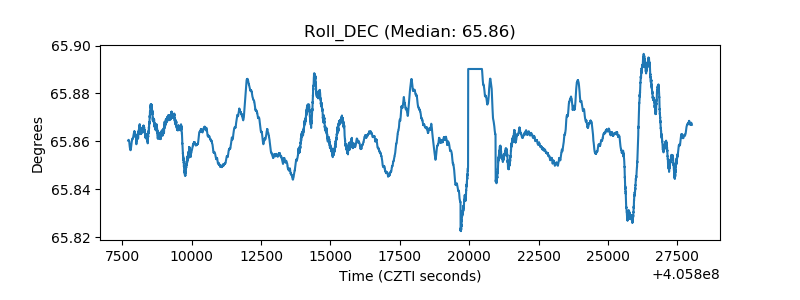 |
| _Roll_RA | 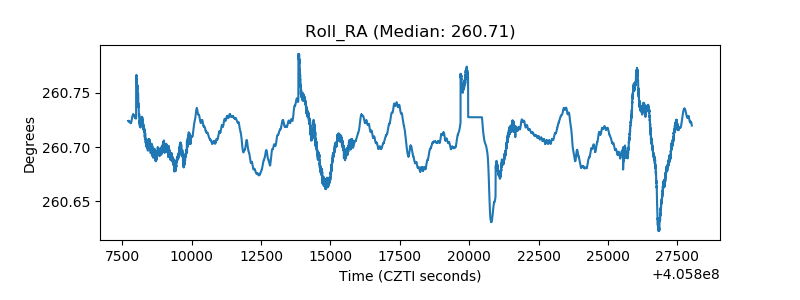 |
| Veto Counter | 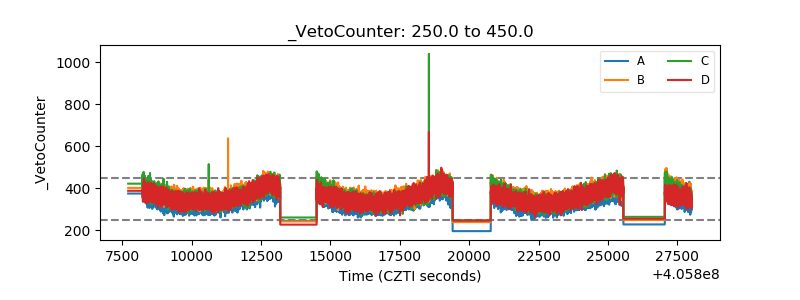 |