| Param | Original file | Final file |
|---|---|---|
| Filename | modeM0/AS1A12_018T01_9000005386_38500cztM0_level2.fits | modeM0/AS1A12_018T01_9000005386_38500cztM0_level2_quad_clean.evt |
| Size (bytes) | 345,991,680 | 93,320,640 |
| Size | 330.0 MB | 89.0 MB |
| Events in quadrant A | 2,994,025 | 628,191 |
| Events in quadrant B | 3,603,968 | 633,185 |
| Events in quadrant C | 2,658,252 | 610,983 |
| Events in quadrant D | 3,114,708 | 561,231 |
| Mode SS | |||
|---|---|---|---|
| Quadrant | BADHDUFLAG | Total packets | Discarded packets |
| A | 0 | 114 | 0 |
| B | 0 | 114 | 0 |
| C | 0 | 114 | 0 |
| D | 0 | 114 | 0 |
| Mode M9 | |||
|---|---|---|---|
| Quadrant | BADHDUFLAG | Total packets | Discarded packets |
| A | 0 | 23 | 0 |
| B | 0 | 23 | 0 |
| C | 0 | 23 | 0 |
| D | 0 | 24 | 0 |
| Mode M0 | |||
|---|---|---|---|
| Quadrant | BADHDUFLAG | Total packets | Discarded packets |
| A | 0 | 12362 | 3 |
| B | 0 | 14471 | 2 |
| C | 0 | 11437 | 2 |
| D | 0 | 13223 | 2 |
| Quadrant | Total seconds | Saturated seconds | Saturation percentage |
|---|---|---|---|
| A | 5604 | 19 | 0.339044% |
| B | 5604 | 185 | 3.301213% |
| C | 5604 | 5 | 0.089222% |
| D | 5604 | 120 | 2.141328% |
Noise dominated data is calculated using 1-second bins in cleaned event files. If a bin has >2000 counts, and if more than 50% of those come from <1% of pixels, then it is considered to be noise-dominated and hence unusable.
| Quadrant | # 1 sec bins | Bins with >0 counts | Bins with >2000 counts | High rate bins dominated by noise | Noise dominated (total time) | Noise dominated (detector-on time) | Marked lightcurve |
|---|---|---|---|---|---|---|---|
| A | 7217 | 5605 | 8 | 8 | 0.11% | 0.14% | 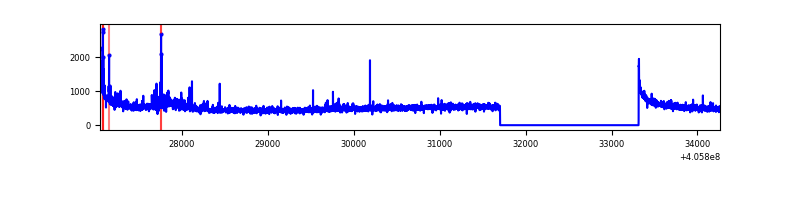 |
| B | 7217 | 5605 | 104 | 104 | 1.44% | 1.86% | 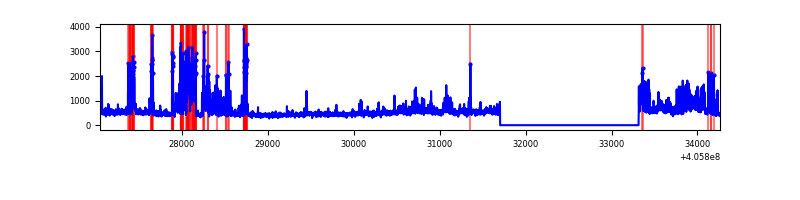 |
| C | 7217 | 5605 | 2 | 2 | 0.03% | 0.04% | 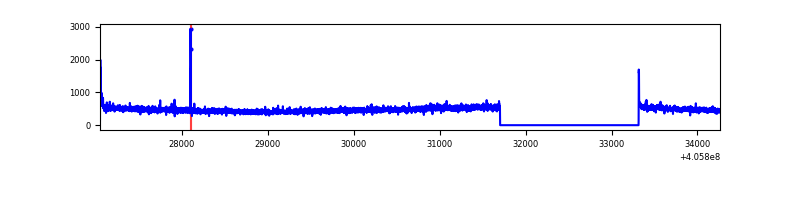 |
| D | 7217 | 5605 | 89 | 89 | 1.23% | 1.59% | 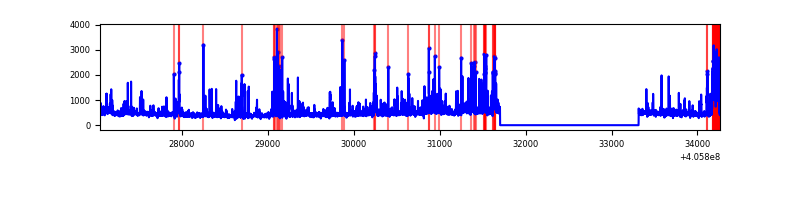 |
Top three noisy pixels from each quadrant. If the there are fewer than three noisy pixels in the level2.evt file, extra rows are filled as -1
| Pixel properties | Quadrant properties | ||||||
|---|---|---|---|---|---|---|---|
| Quadrant | DetID | PixID | Counts | Sigma | Mean | Median | Sigma |
| A | 10 | 83 | 407325 | 3168.16 | 627 | 615 | 128.4 |
| A | 15 | 222 | 81290 | 628.44 | 627 | 615 | 128.4 |
| A | 12 | 189 | 38731 | 296.91 | 627 | 615 | 128.4 |
| B | 8 | 3 | 1019965 | 8596.46 | 617 | 599 | 118.6 |
| B | 4 | 170 | 58672 | 489.74 | 617 | 599 | 118.6 |
| B | 0 | 229 | 48364 | 402.81 | 617 | 599 | 118.6 |
| C | 15 | 214 | 236174 | 1663.22 | 607 | 609 | 141.6 |
| C | 0 | 10 | 19286 | 131.87 | 607 | 609 | 141.6 |
| C | 1 | 23 | 13458 | 90.72 | 607 | 609 | 141.6 |
| D | 12 | 233 | 179056 | 1230.91 | 601 | 584 | 145.0 |
| D | 10 | 118 | 173083 | 1189.71 | 601 | 584 | 145.0 |
| D | 2 | 250 | 136130 | 934.85 | 601 | 584 | 145.0 |
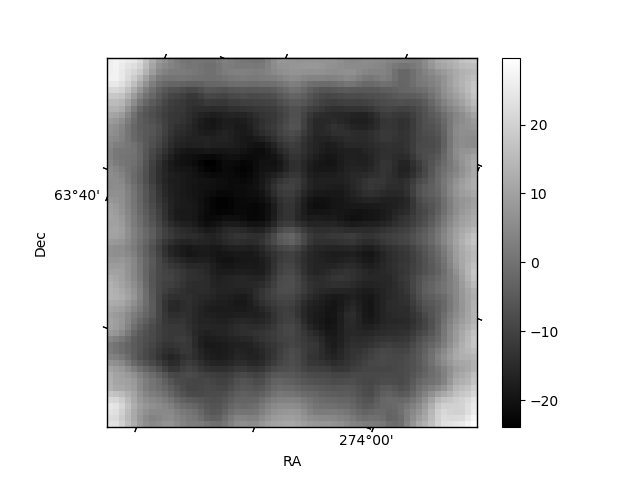
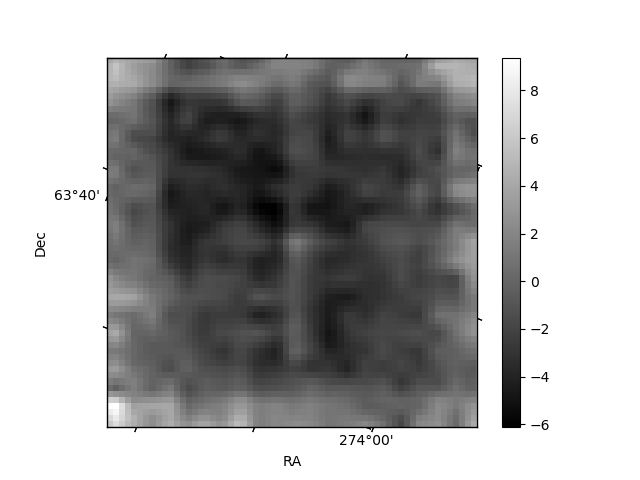
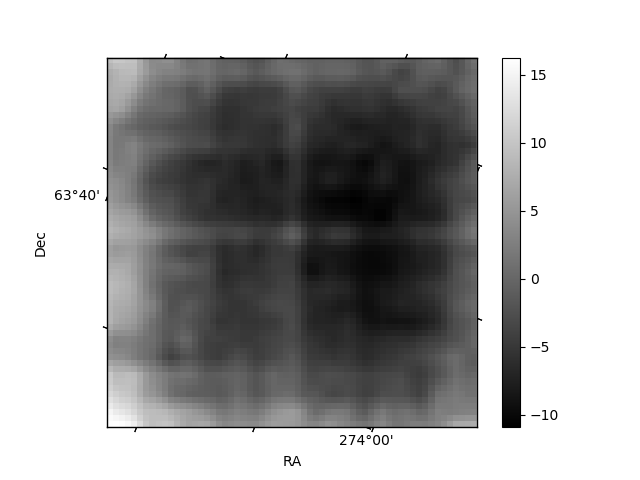
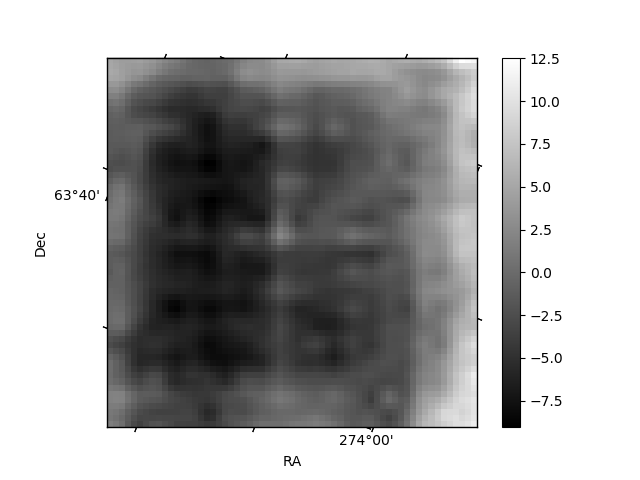
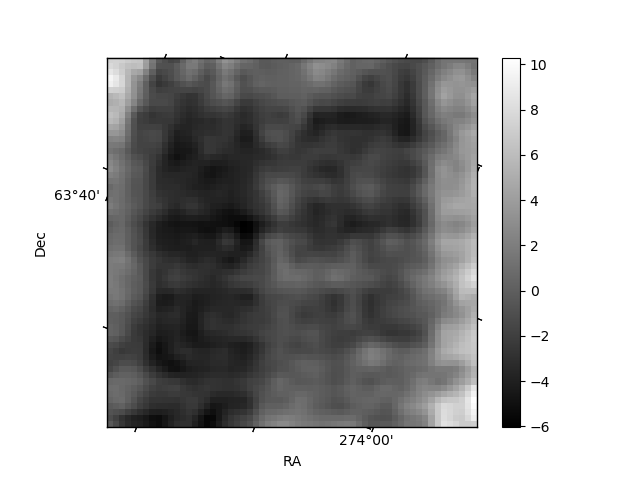
Histogram calculated using DETX and DETY for each event in the final _common_clean file
| Quadrant A | 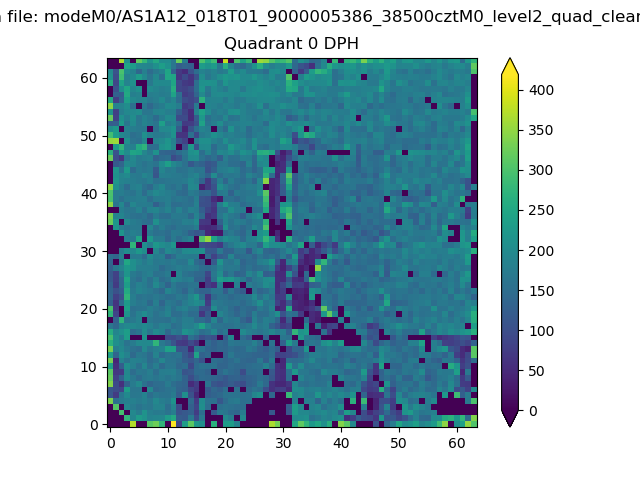 |
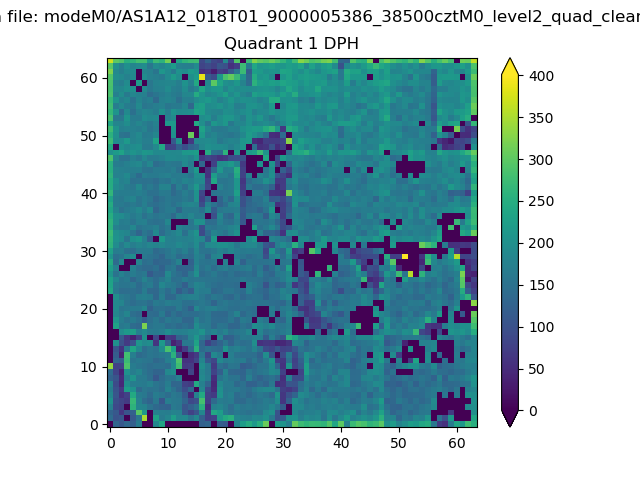 |
Quadrant B |
|---|---|---|---|
| Quadrant D | 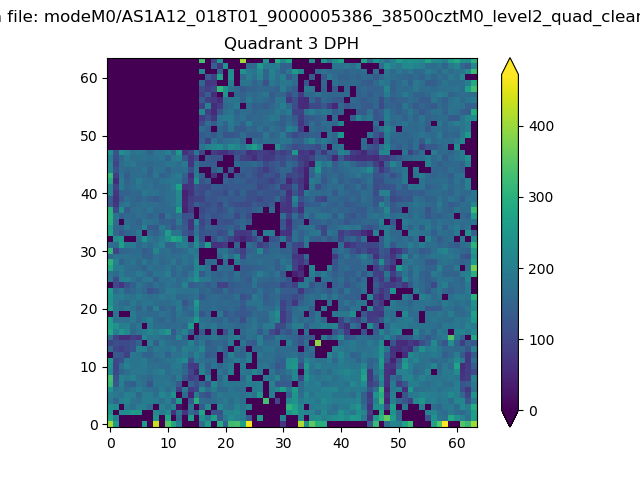 |
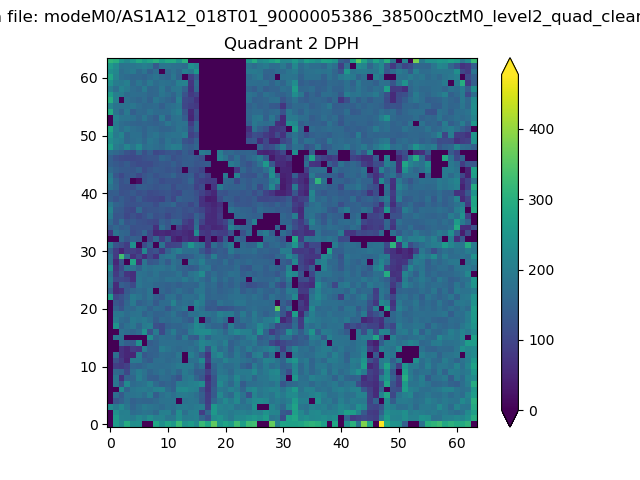 |
Quadrant C |
| Plot type | Count rate plots | Images |
|---|---|---|
| Comparison with Poisson distribution Blue bars denote a histogram of data divided into 1 sec bins. Red curve is a Poisson curve with rate = median count rate of data. |
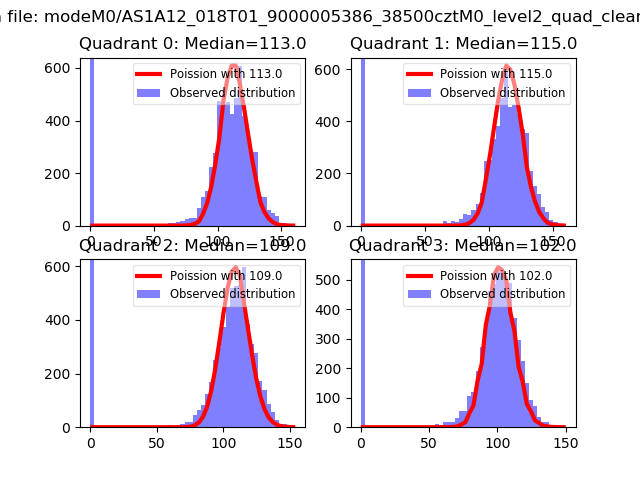 |
 |
| Quadrant-wise count rates Data is divided into 100 sec bins |
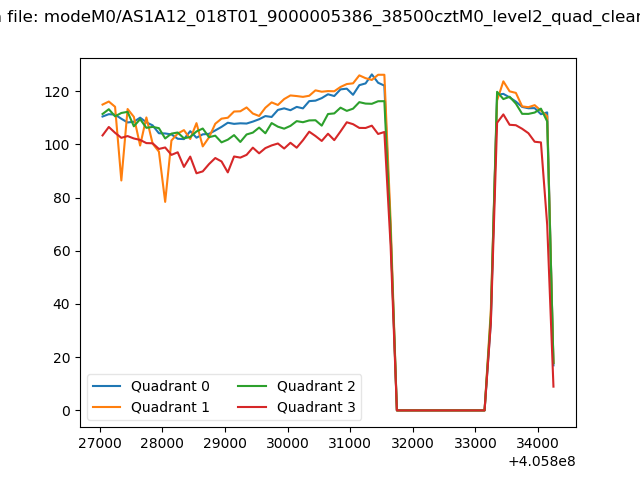 |
|
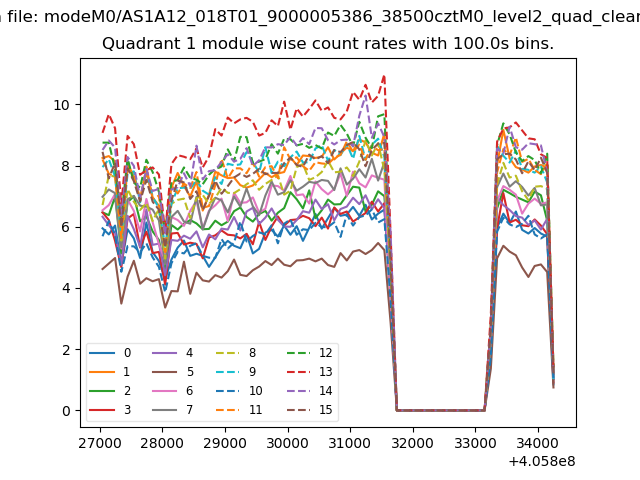
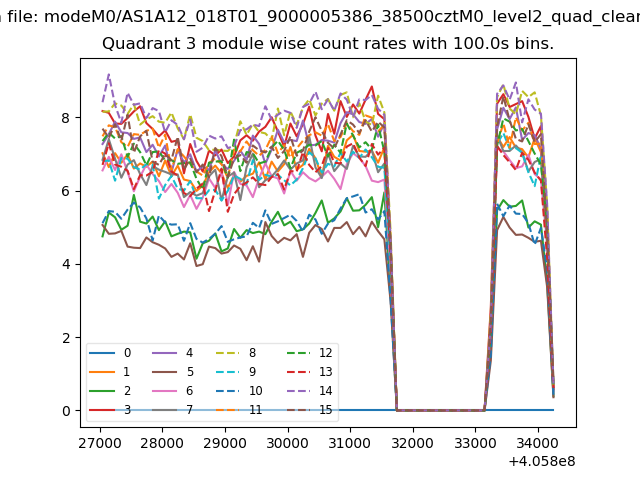
| Module-wise count rates for Quadrant A Data is divided into 100 sec bins |
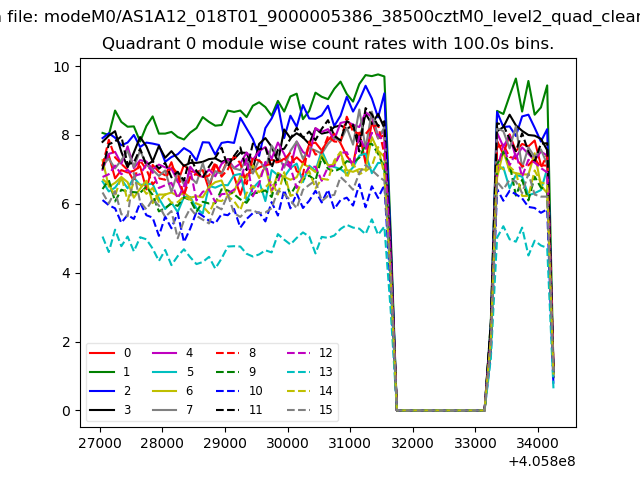 |
 |
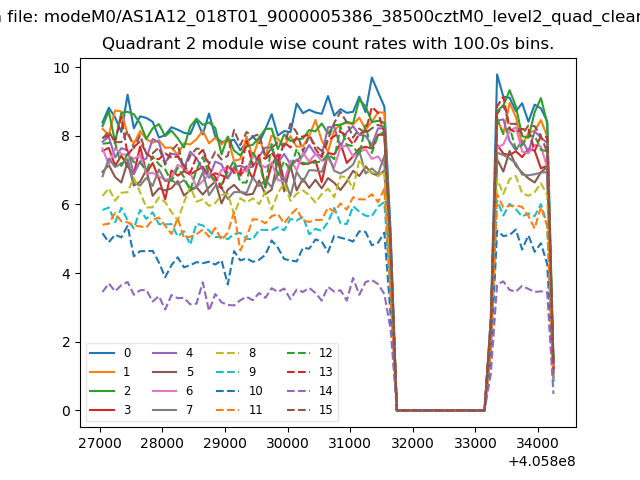
| Module-wise count rates for Quadrant B Data is divided into 100 sec bins |
 |
 |
| Module-wise count rates for Quadrant C Data is divided into 100 sec bins |
 |
 |
| Module-wise count rates for Quadrant D Data is divided into 100 sec bins |
 |
 |
| Parameter | Plot |
|---|---|
| CZT HV Monitor | 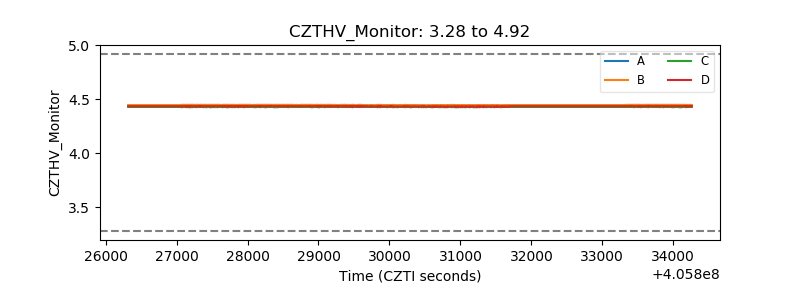 |
| D_VDD | 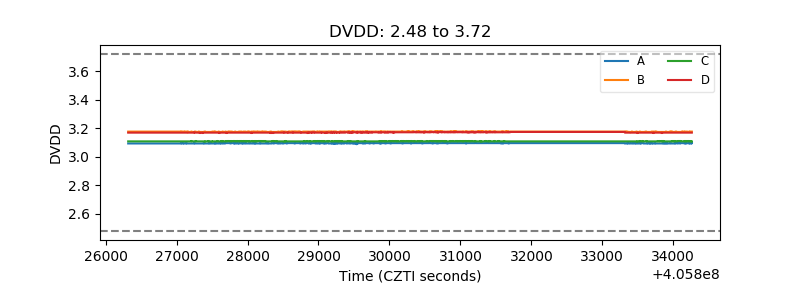 |
| Temperature 1 | 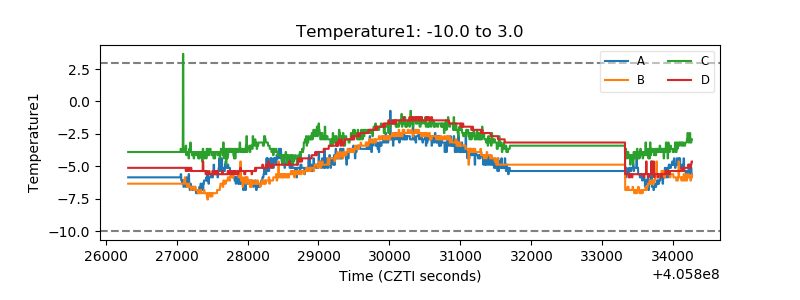 |
| Veto HV Monitor | 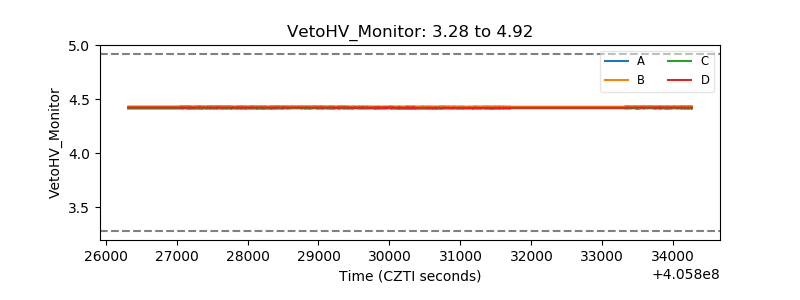 |
| Veto LLD | 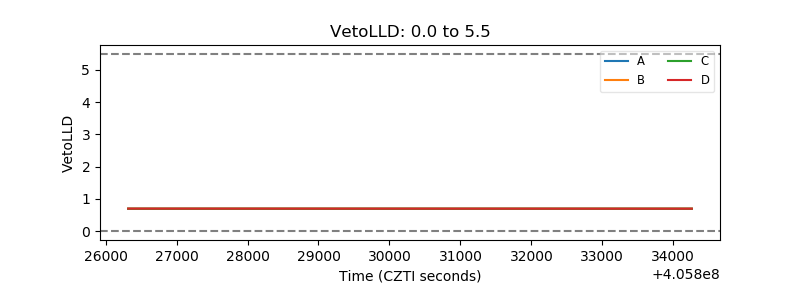 |
| Alpha Counter | 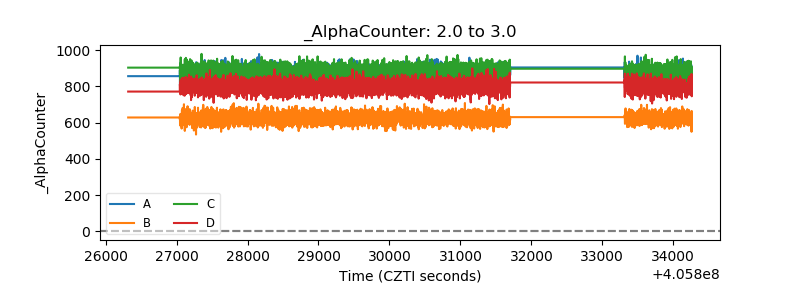 |
| _CPM_Rate | 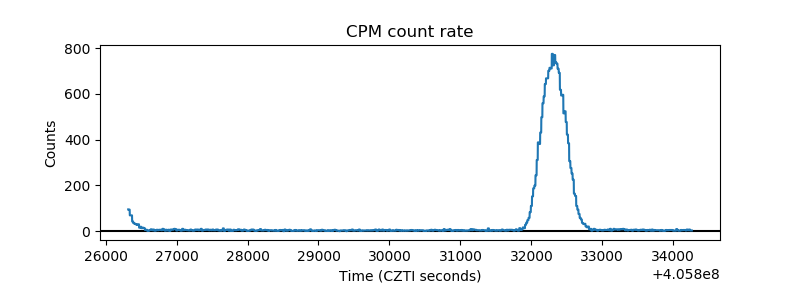 |
| CZT Counter | 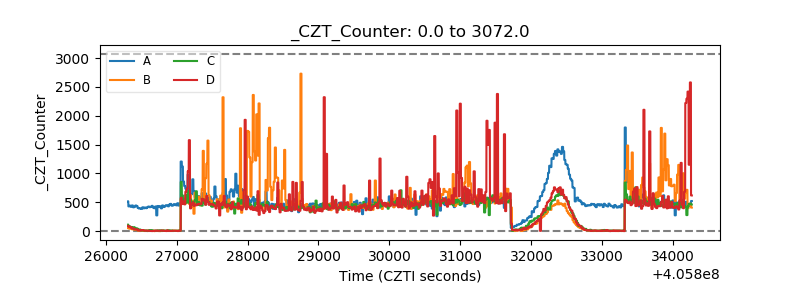 |
| +2.5 Volts monitor | 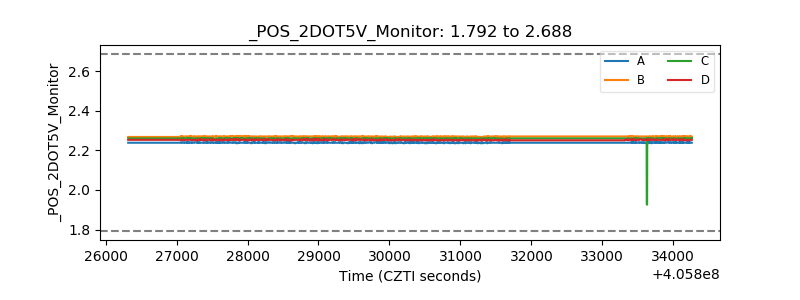 |
| +5 Volts monitor | 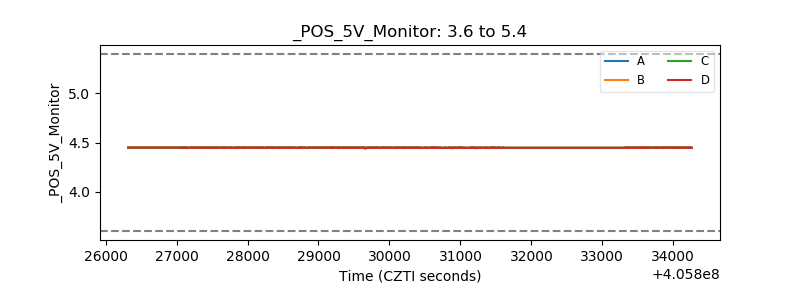 |
| _ROLL_ROT | 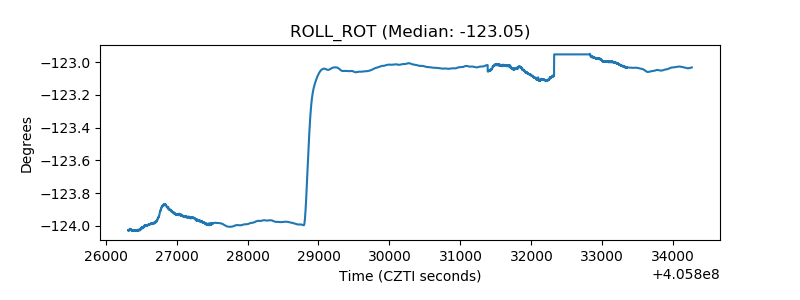 |
| _Roll_DEC | 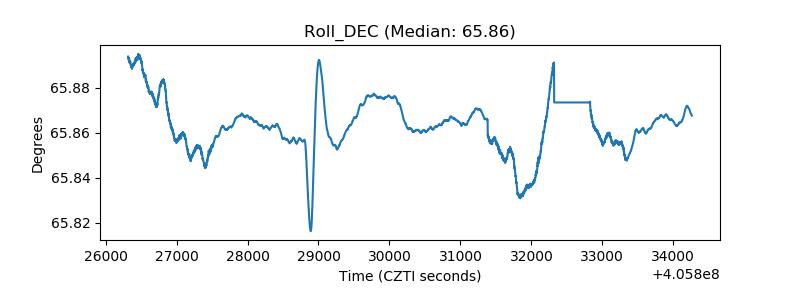 |
| _Roll_RA | 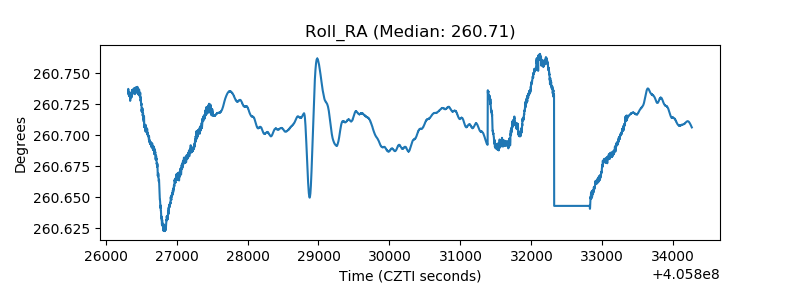 |
| Veto Counter | 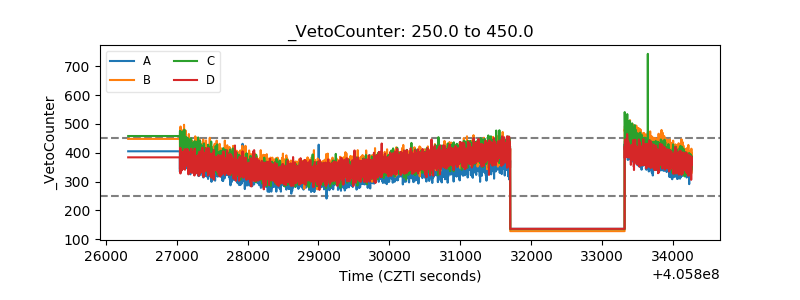 |