| Param | Original file | Final file |
|---|---|---|
| Filename | modeM0/AS1A12_018T01_9000005386_38502cztM0_level2.fits | modeM0/AS1A12_018T01_9000005386_38502cztM0_level2_quad_clean.evt |
| Size (bytes) | 379,800,000 | 92,580,480 |
| Size | 362.2 MB | 88.3 MB |
| Events in quadrant A | 2,854,852 | 634,774 |
| Events in quadrant B | 4,449,589 | 634,018 |
| Events in quadrant C | 2,585,667 | 610,302 |
| Events in quadrant D | 3,745,602 | 542,977 |
| Mode SS | |||
|---|---|---|---|
| Quadrant | BADHDUFLAG | Total packets | Discarded packets |
| A | 0 | 112 | 0 |
| B | 0 | 112 | 0 |
| C | 0 | 112 | 0 |
| D | 0 | 112 | 0 |
| Mode M9 | |||
|---|---|---|---|
| Quadrant | BADHDUFLAG | Total packets | Discarded packets |
| A | 0 | 20 | 0 |
| B | 0 | 20 | 0 |
| C | 0 | 20 | 0 |
| D | 0 | 21 | 0 |
| Mode M0 | |||
|---|---|---|---|
| Quadrant | BADHDUFLAG | Total packets | Discarded packets |
| A | 0 | 11798 | 3 |
| B | 0 | 16928 | 2 |
| C | 0 | 11095 | 2 |
| D | 0 | 14976 | 2 |
| Quadrant | Total seconds | Saturated seconds | Saturation percentage |
|---|---|---|---|
| A | 5441 | 15 | 0.275685% |
| B | 5441 | 256 | 4.705017% |
| C | 5441 | 3 | 0.055137% |
| D | 5441 | 300 | 5.513692% |
Noise dominated data is calculated using 1-second bins in cleaned event files. If a bin has >2000 counts, and if more than 50% of those come from <1% of pixels, then it is considered to be noise-dominated and hence unusable.
| Quadrant | # 1 sec bins | Bins with >0 counts | Bins with >2000 counts | High rate bins dominated by noise | Noise dominated (total time) | Noise dominated (detector-on time) | Marked lightcurve |
|---|---|---|---|---|---|---|---|
| A | 7175 | 5442 | 2 | 2 | 0.03% | 0.04% | 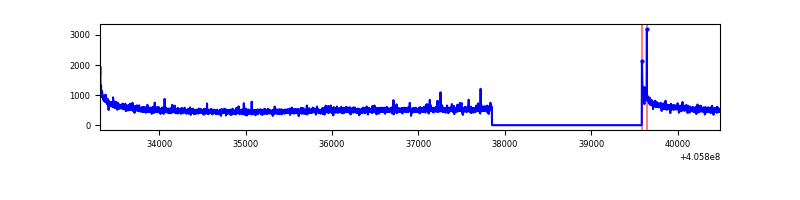 |
| B | 7175 | 5442 | 134 | 134 | 1.87% | 2.46% | 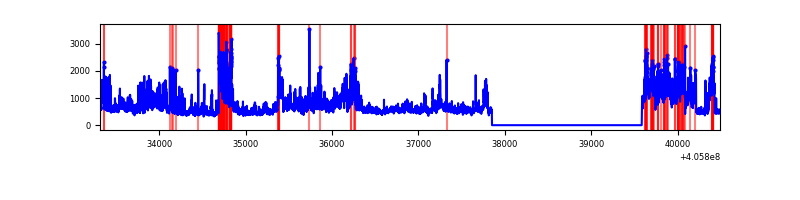 |
| C | 7175 | 5442 | 2 | 2 | 0.03% | 0.04% | 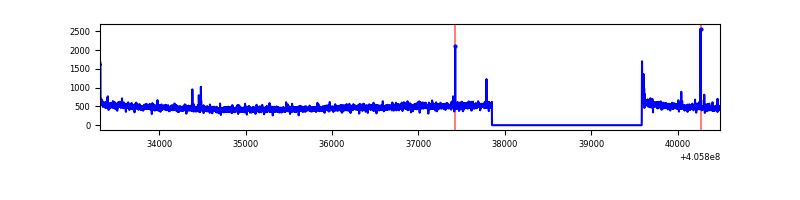 |
| D | 7175 | 5442 | 270 | 270 | 3.76% | 4.96% | 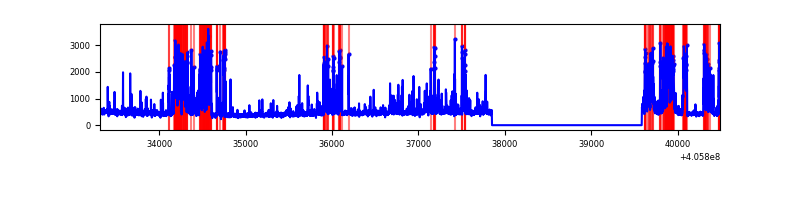 |
Top three noisy pixels from each quadrant. If the there are fewer than three noisy pixels in the level2.evt file, extra rows are filled as -1
| Pixel properties | Quadrant properties | ||||||
|---|---|---|---|---|---|---|---|
| Quadrant | DetID | PixID | Counts | Sigma | Mean | Median | Sigma |
| A | 10 | 83 | 395396 | 3137.01 | 618 | 605 | 125.8 |
| A | 12 | 189 | 39402 | 308.28 | 618 | 605 | 125.8 |
| A | 13 | 248 | 10680 | 80.06 | 618 | 605 | 125.8 |
| B | 8 | 3 | 1926396 | 16600.84 | 605 | 589 | 116.0 |
| B | 4 | 170 | 44821 | 381.29 | 605 | 589 | 116.0 |
| B | 0 | 183 | 42371 | 360.17 | 605 | 589 | 116.0 |
| C | 15 | 214 | 228905 | 1647.03 | 592 | 594 | 138.6 |
| C | 14 | 254 | 15908 | 110.47 | 592 | 594 | 138.6 |
| C | 0 | 10 | 14535 | 100.57 | 592 | 594 | 138.6 |
| D | 10 | 118 | 827066 | 5858.18 | 583 | 567 | 141.1 |
| D | 12 | 227 | 197699 | 1397.26 | 583 | 567 | 141.1 |
| D | 12 | 233 | 143339 | 1011.96 | 583 | 567 | 141.1 |
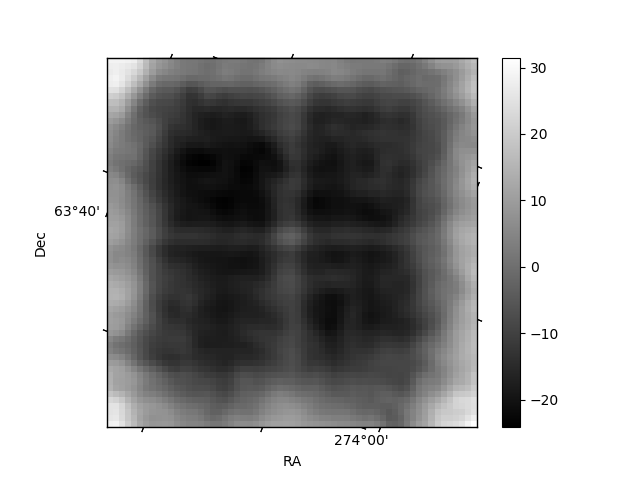
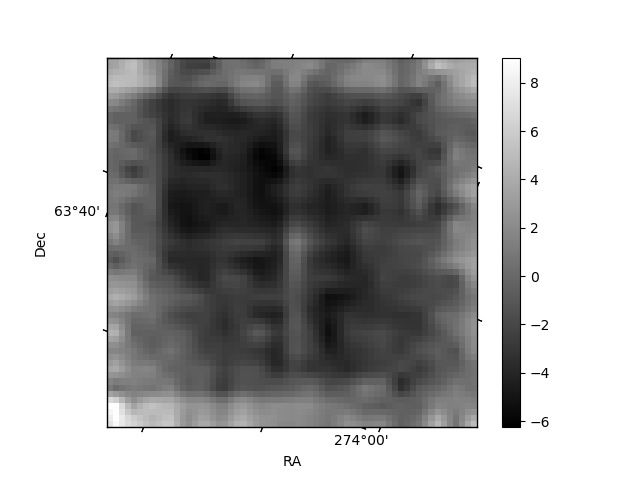
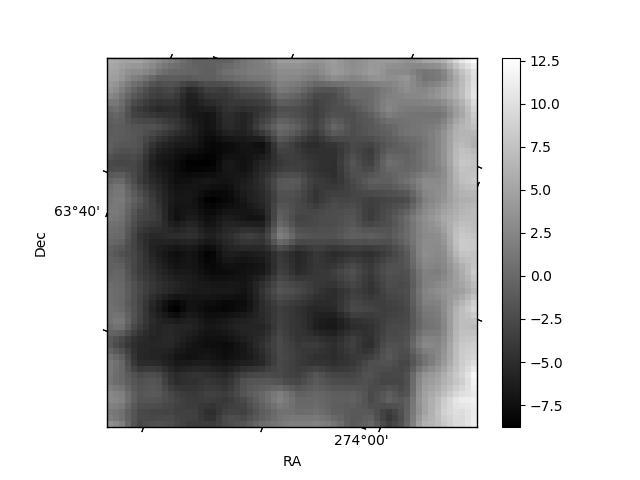
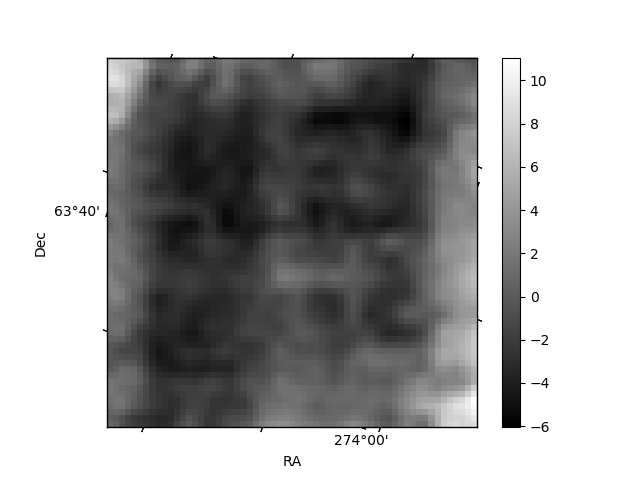
Histogram calculated using DETX and DETY for each event in the final _common_clean file
| Quadrant A | 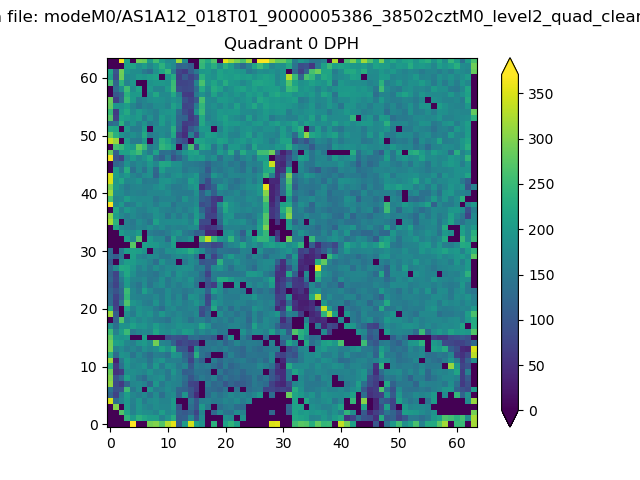 |
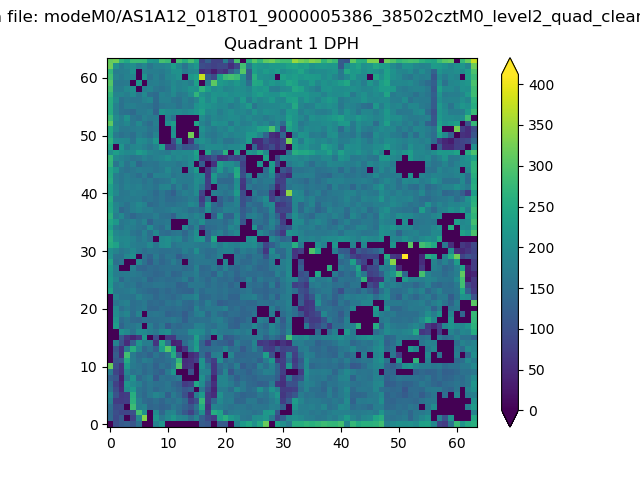 |
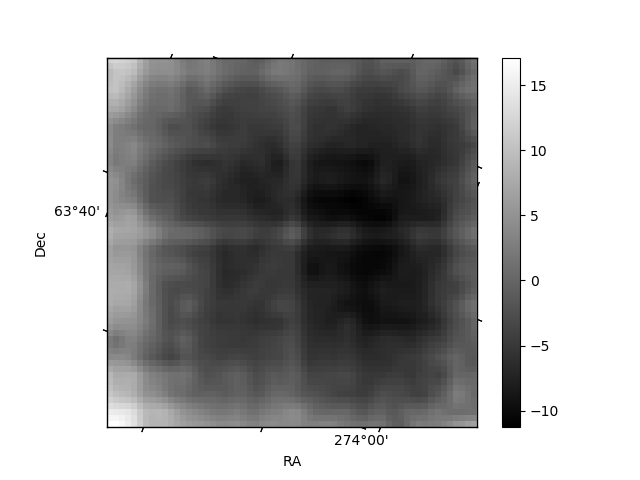
Quadrant B |
|---|---|---|---|
| Quadrant D | 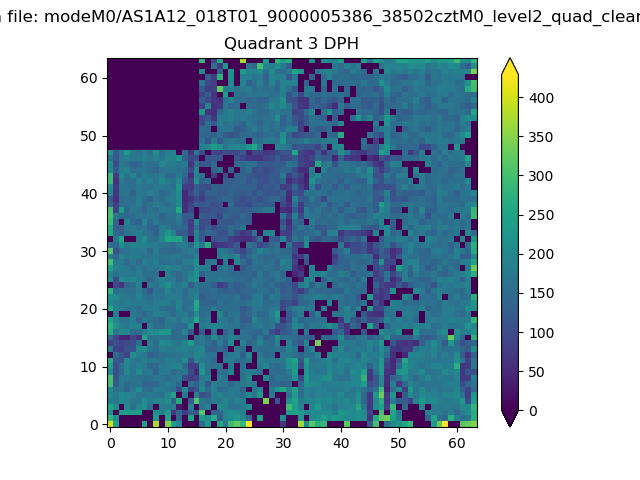 |
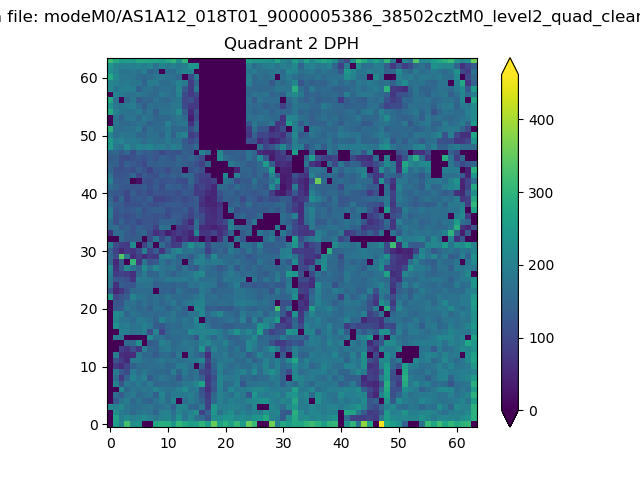 |
Quadrant C |
| Plot type | Count rate plots | Images |
|---|---|---|
| Comparison with Poisson distribution Blue bars denote a histogram of data divided into 1 sec bins. Red curve is a Poisson curve with rate = median count rate of data. |
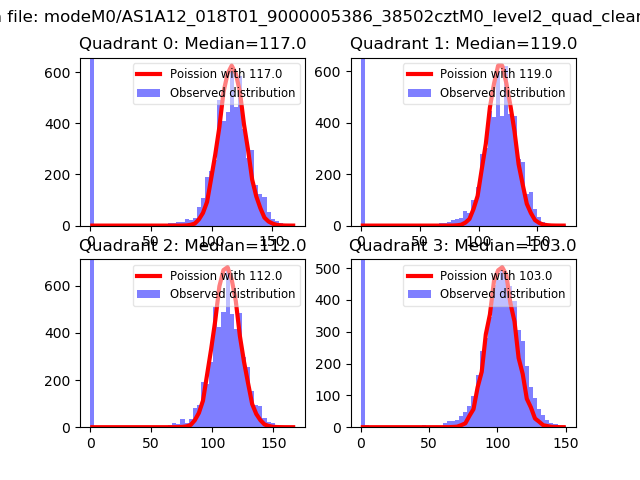 |
 |
| Quadrant-wise count rates Data is divided into 100 sec bins |
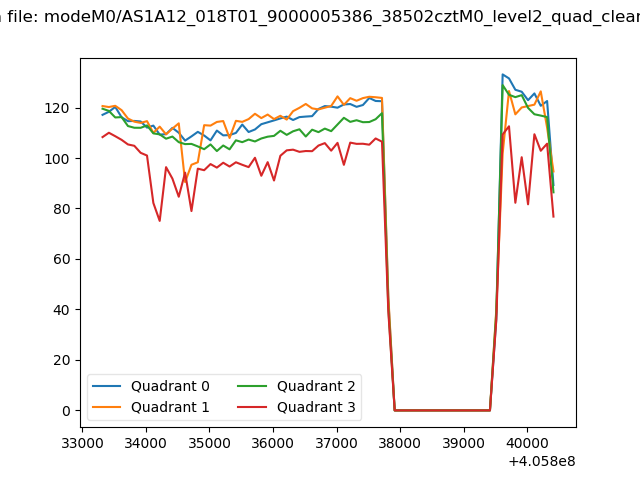 |
|
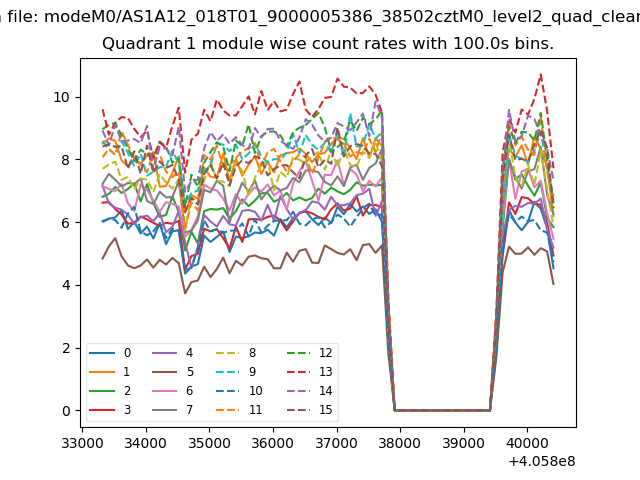
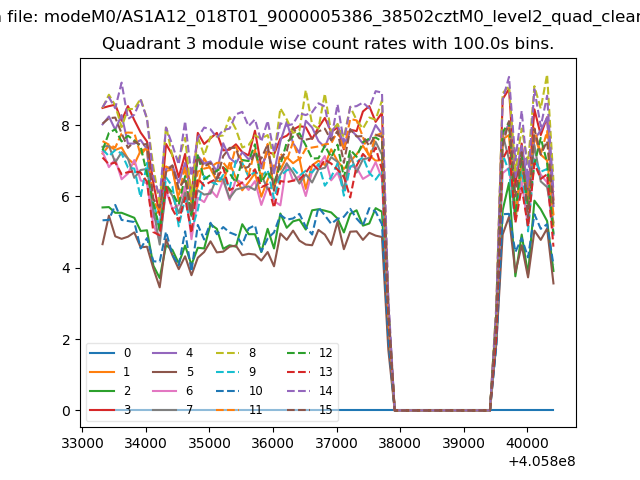
| Module-wise count rates for Quadrant A Data is divided into 100 sec bins |
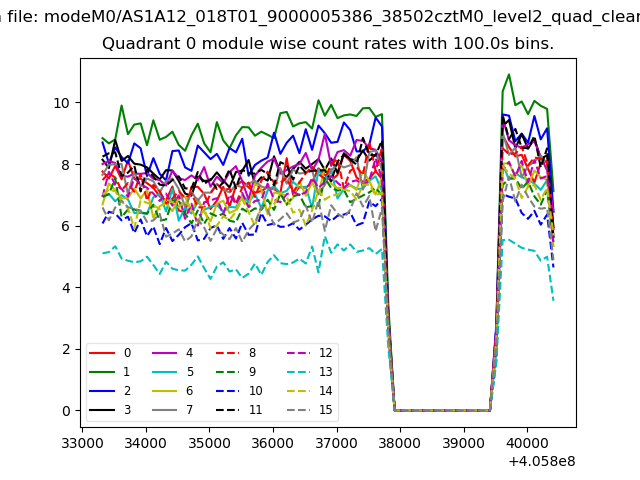 |
 |
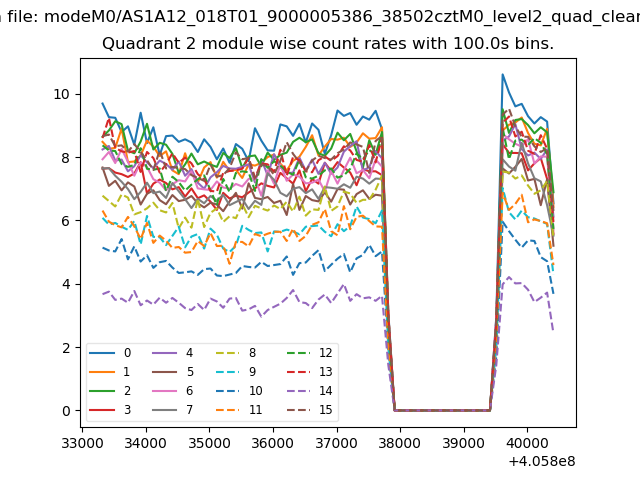
| Module-wise count rates for Quadrant B Data is divided into 100 sec bins |
 |
 |
| Module-wise count rates for Quadrant C Data is divided into 100 sec bins |
 |
 |
| Module-wise count rates for Quadrant D Data is divided into 100 sec bins |
 |
 |
| Parameter | Plot |
|---|---|
| CZT HV Monitor | 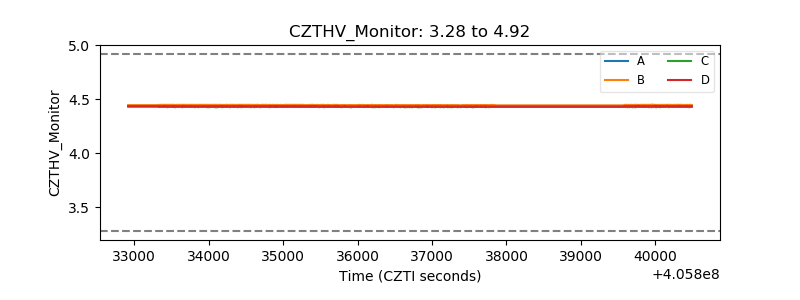 |
| D_VDD | 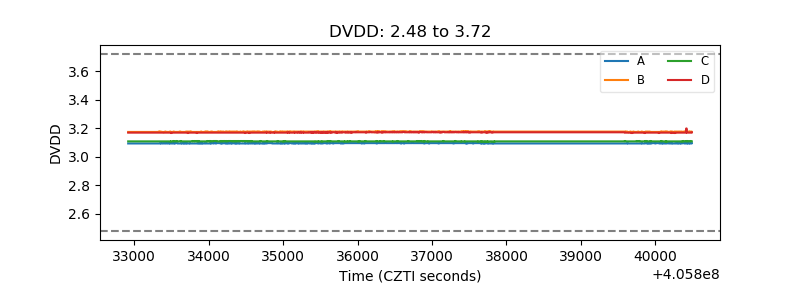 |
| Temperature 1 | 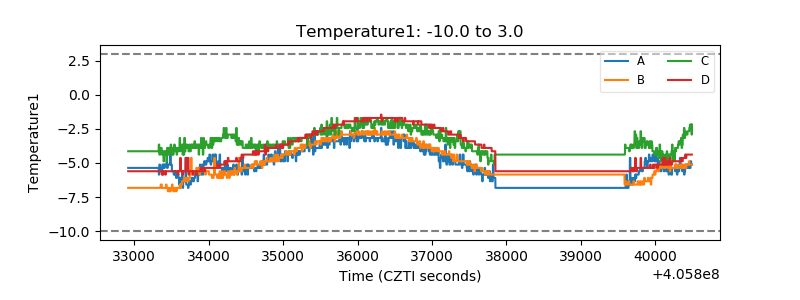 |
| Veto HV Monitor |  |
| Veto LLD | 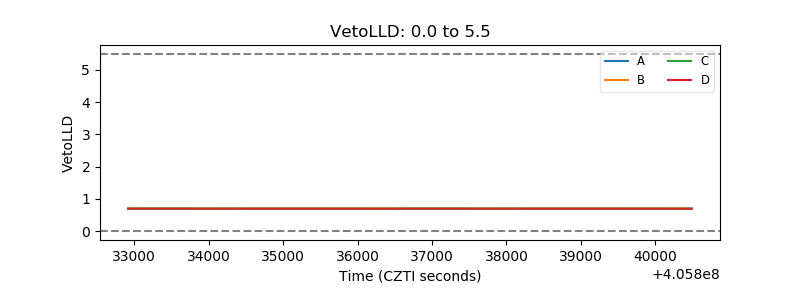 |
| Alpha Counter | 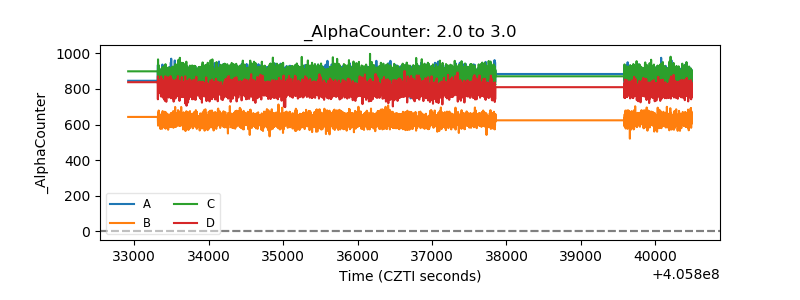 |
| _CPM_Rate | 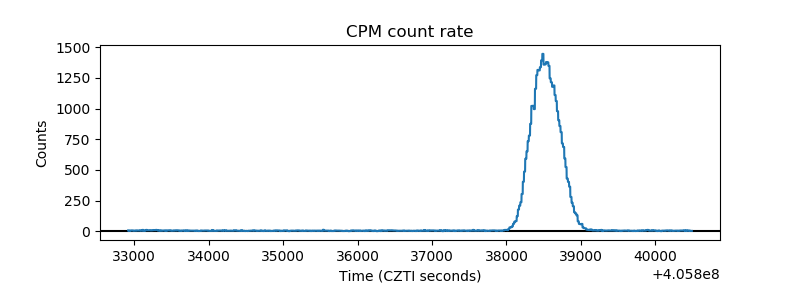 |
| CZT Counter | 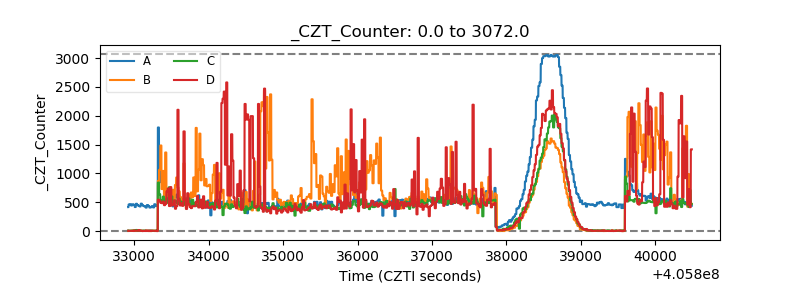 |
| +2.5 Volts monitor | 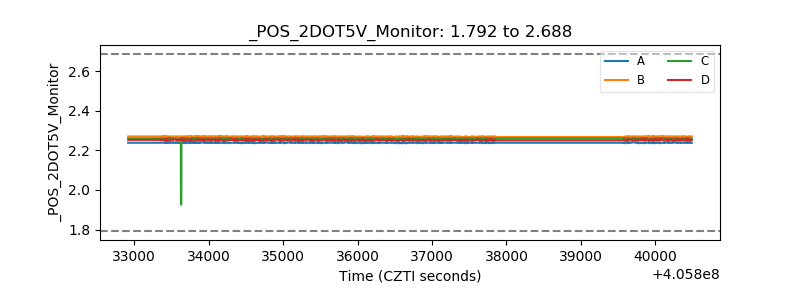 |
| +5 Volts monitor | 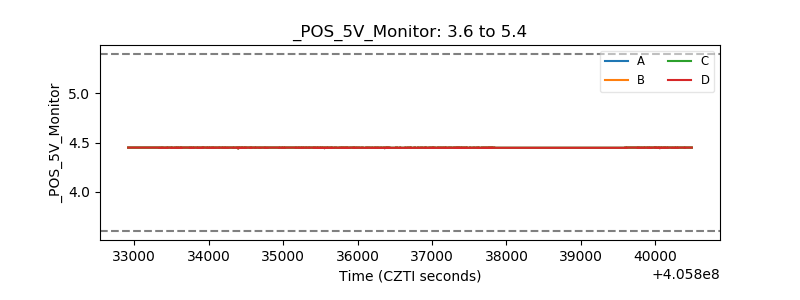 |
| _ROLL_ROT | 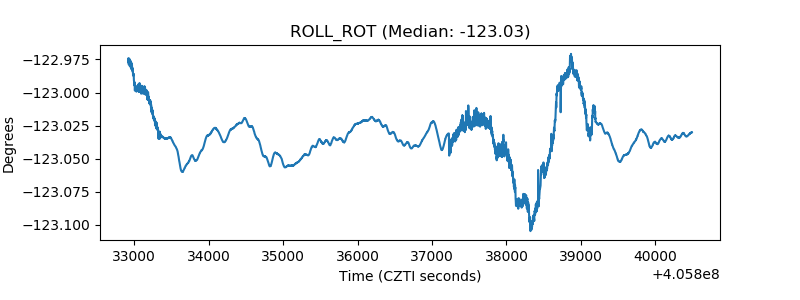 |
| _Roll_DEC | 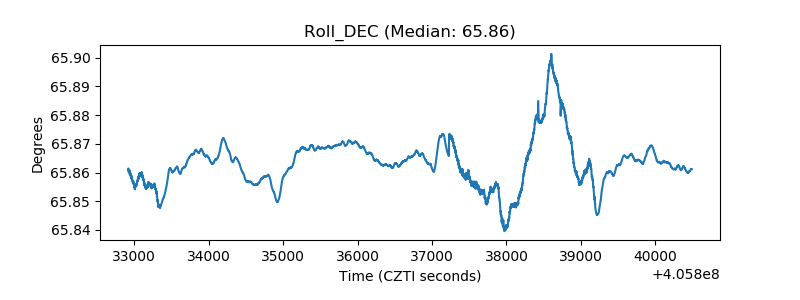 |
| _Roll_RA | 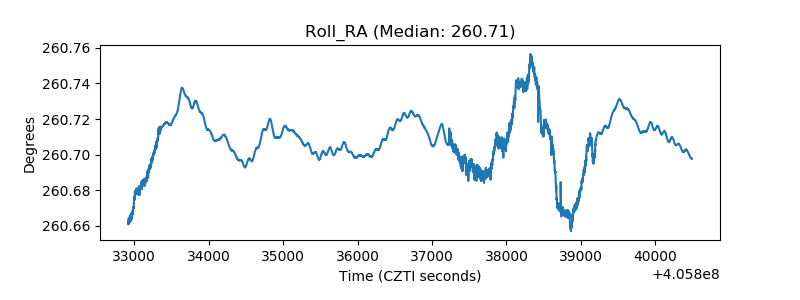 |
| Veto Counter | 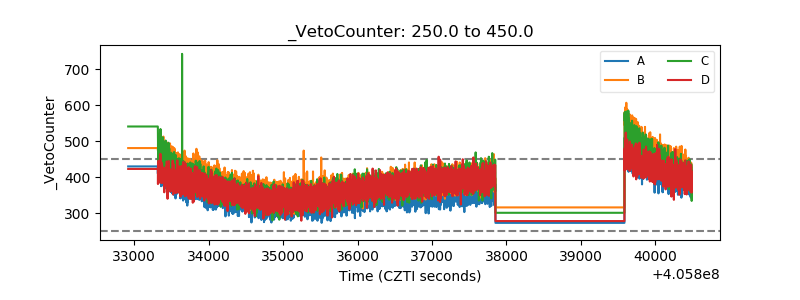 |