| Param | Original file | Final file |
|---|---|---|
| Filename | modeM0/AS1A12_018T01_9000005386_38503cztM0_level2.fits | modeM0/AS1A12_018T01_9000005386_38503cztM0_level2_quad_clean.evt |
| Size (bytes) | 451,120,320 | 88,125,120 |
| Size | 430.2 MB | 84.0 MB |
| Events in quadrant A | 2,850,728 | 650,446 |
| Events in quadrant B | 3,728,403 | 646,649 |
| Events in quadrant C | 2,553,135 | 613,683 |
| Events in quadrant D | 7,159,378 | 391,257 |
| Mode SS | |||
|---|---|---|---|
| Quadrant | BADHDUFLAG | Total packets | Discarded packets |
| A | 0 | 106 | 0 |
| B | 0 | 106 | 0 |
| C | 0 | 106 | 0 |
| D | 0 | 106 | 0 |
| Mode M9 | |||
|---|---|---|---|
| Quadrant | BADHDUFLAG | Total packets | Discarded packets |
| A | 0 | 21 | 0 |
| B | 0 | 21 | 0 |
| C | 0 | 21 | 0 |
| D | 0 | 22 | 0 |
| Mode M0 | |||
|---|---|---|---|
| Quadrant | BADHDUFLAG | Total packets | Discarded packets |
| A | 0 | 11627 | 3 |
| B | 0 | 14463 | 2 |
| C | 0 | 10754 | 2 |
| D | 0 | 24847 | 2 |
| Quadrant | Total seconds | Saturated seconds | Saturation percentage |
|---|---|---|---|
| A | 5234 | 17 | 0.324799% |
| B | 5234 | 272 | 5.196790% |
| C | 5234 | 5 | 0.095529% |
| D | 5234 | 1795 | 34.294994% |
Noise dominated data is calculated using 1-second bins in cleaned event files. If a bin has >2000 counts, and if more than 50% of those come from <1% of pixels, then it is considered to be noise-dominated and hence unusable.
| Quadrant | # 1 sec bins | Bins with >0 counts | Bins with >2000 counts | High rate bins dominated by noise | Noise dominated (total time) | Noise dominated (detector-on time) | Marked lightcurve |
|---|---|---|---|---|---|---|---|
| A | 7117 | 5235 | 6 | 6 | 0.08% | 0.11% | 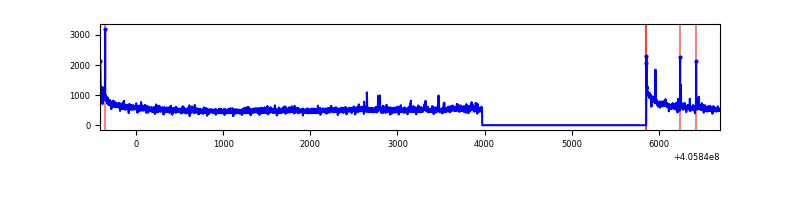 |
| B | 7117 | 5235 | 160 | 160 | 2.25% | 3.06% | 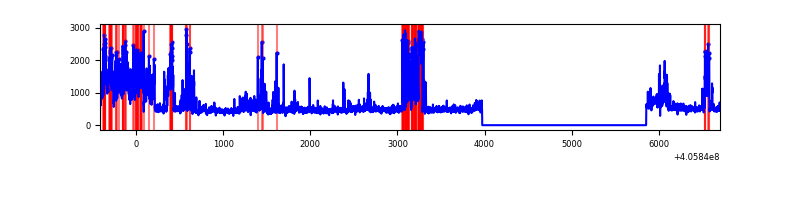 |
| C | 7117 | 5235 | 2 | 2 | 0.03% | 0.04% | 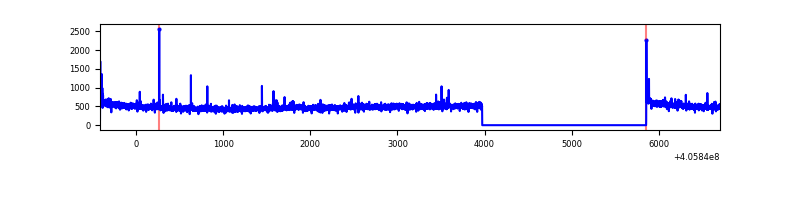 |
| D | 7117 | 5235 | 1754 | 1754 | 24.65% | 33.51% | 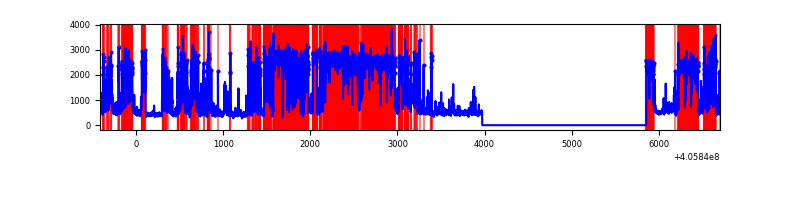 |
Top three noisy pixels from each quadrant. If the there are fewer than three noisy pixels in the level2.evt file, extra rows are filled as -1
| Pixel properties | Quadrant properties | ||||||
|---|---|---|---|---|---|---|---|
| Quadrant | DetID | PixID | Counts | Sigma | Mean | Median | Sigma |
| A | 10 | 83 | 385491 | 3131.6 | 611 | 600 | 122.9 |
| A | 12 | 189 | 72065 | 581.46 | 611 | 600 | 122.9 |
| A | 9 | 143 | 19190 | 151.25 | 611 | 600 | 122.9 |
| B | 8 | 3 | 1242683 | 10993.59 | 596 | 581 | 113.0 |
| B | 0 | 183 | 75965 | 667.21 | 596 | 581 | 113.0 |
| B | 4 | 170 | 29997 | 260.35 | 596 | 581 | 113.0 |
| C | 15 | 214 | 221808 | 1647.98 | 581 | 583 | 134.2 |
| C | 3 | 233 | 19934 | 144.15 | 581 | 583 | 134.2 |
| C | 0 | 10 | 15635 | 112.13 | 581 | 583 | 134.2 |
| D | 12 | 227 | 2084598 | 17883.95 | 481 | 467 | 116.5 |
| D | 2 | 250 | 1756360 | 15067.33 | 481 | 467 | 116.5 |
| D | 10 | 118 | 1250180 | 10723.8 | 481 | 467 | 116.5 |
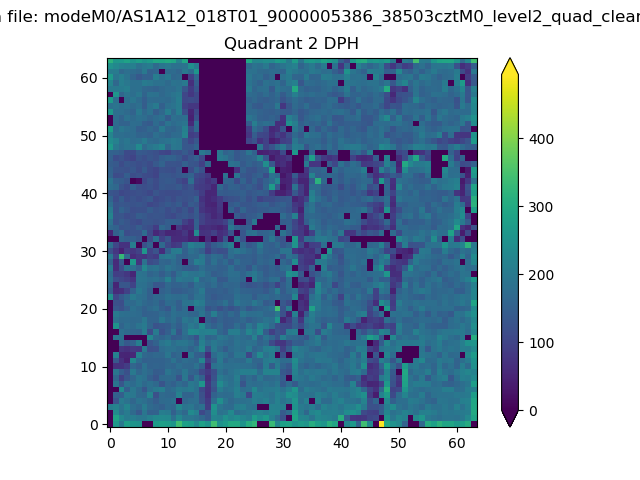
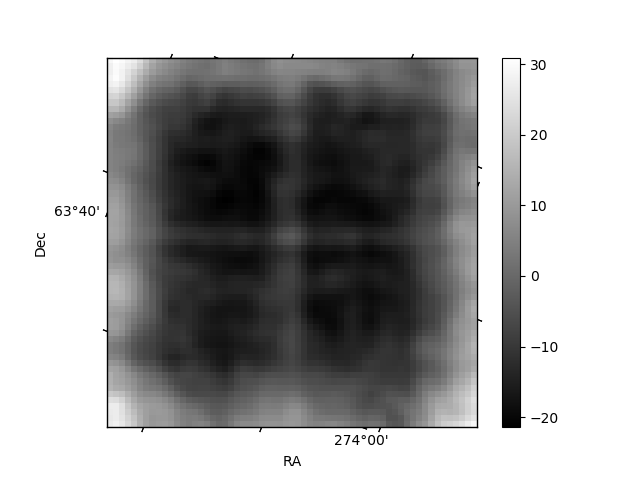
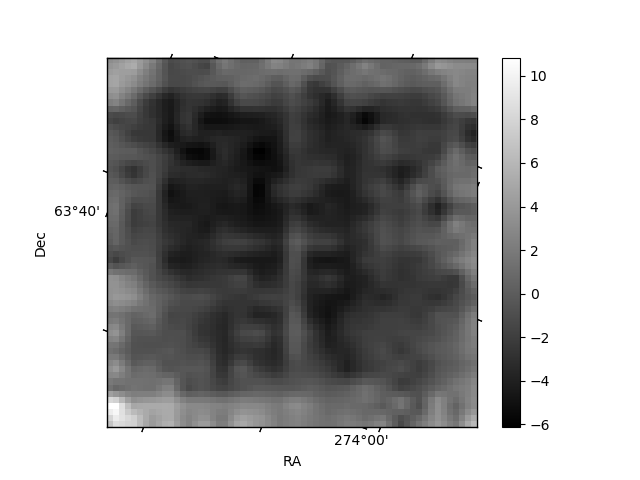
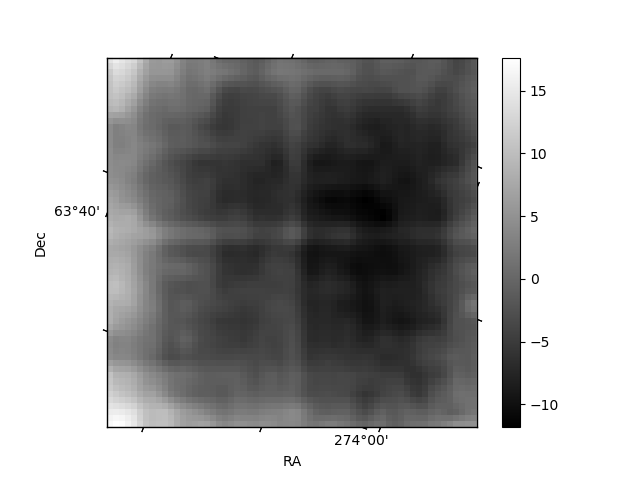
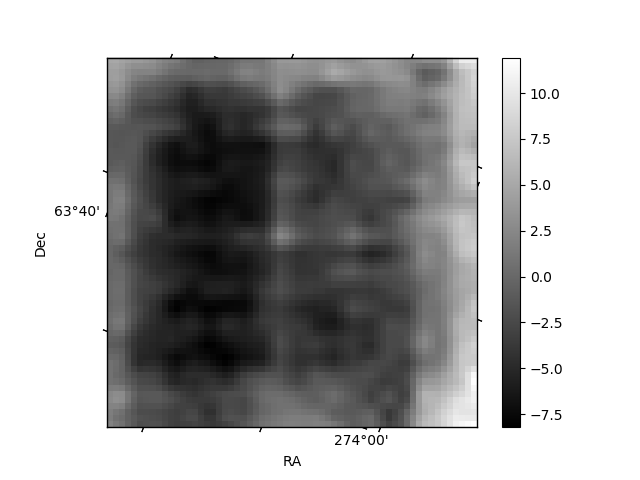
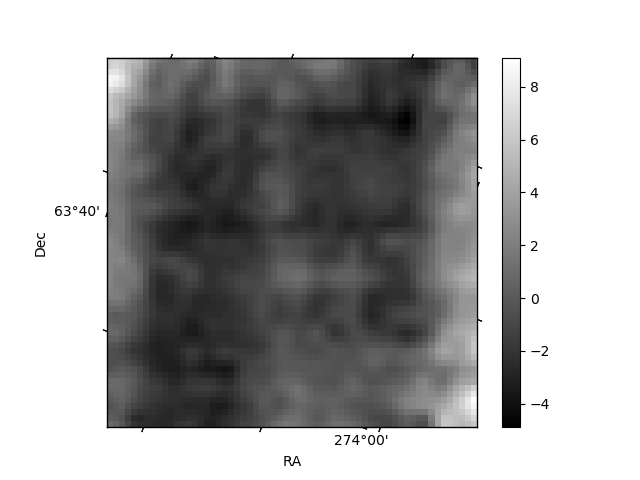
Histogram calculated using DETX and DETY for each event in the final _common_clean file
| Quadrant A | 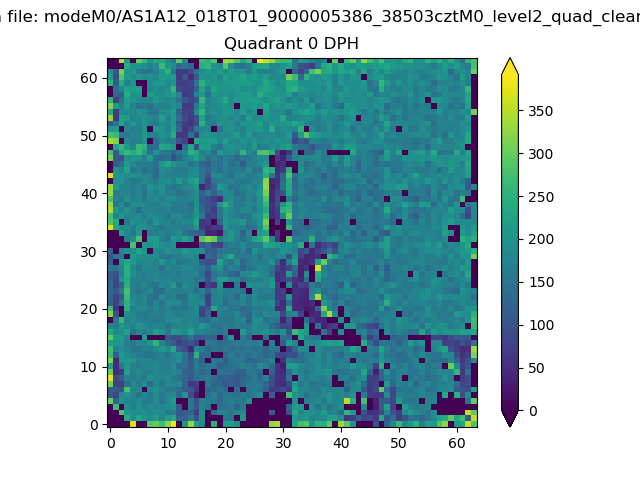 |
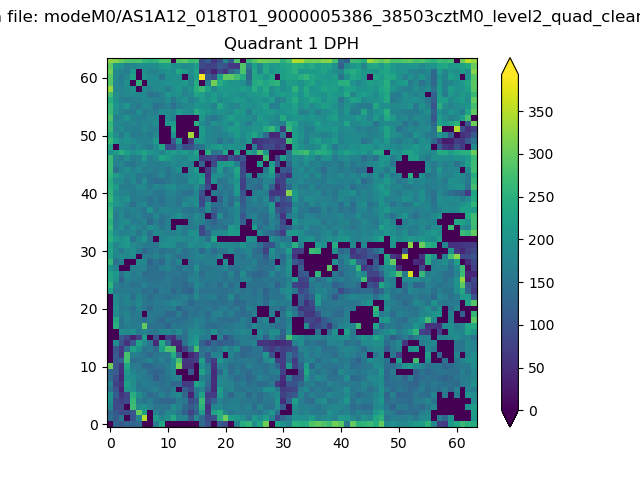 |
Quadrant B |
|---|---|---|---|
| Quadrant D | 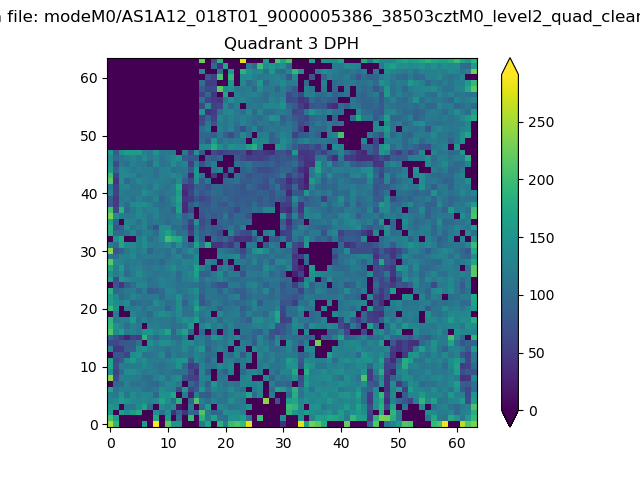 |
 |
Quadrant C |
| Plot type | Count rate plots | Images |
|---|---|---|
| Comparison with Poisson distribution Blue bars denote a histogram of data divided into 1 sec bins. Red curve is a Poisson curve with rate = median count rate of data. |
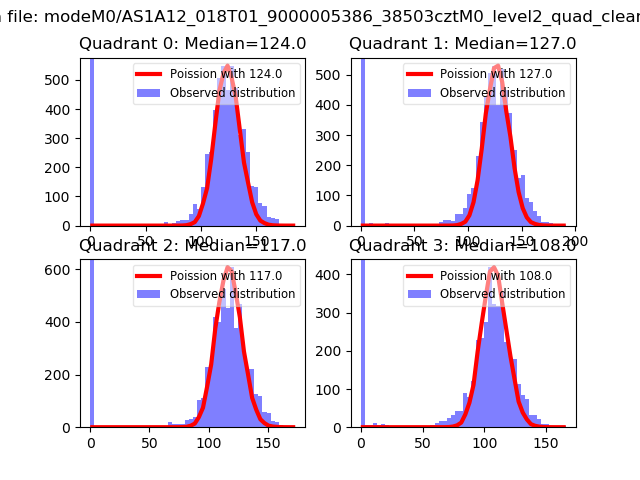 |
 |
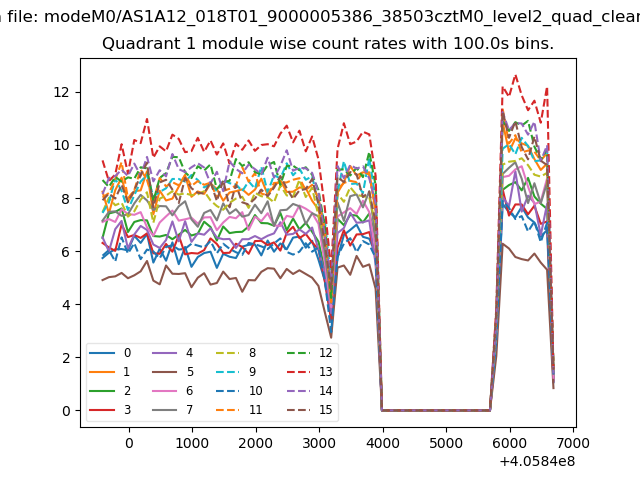
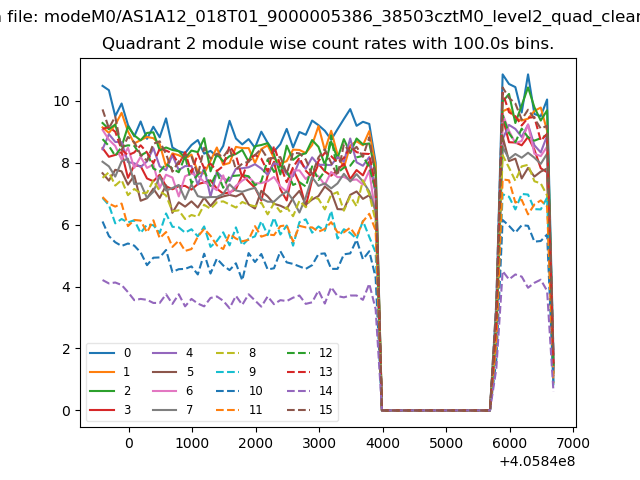
| Quadrant-wise count rates Data is divided into 100 sec bins |
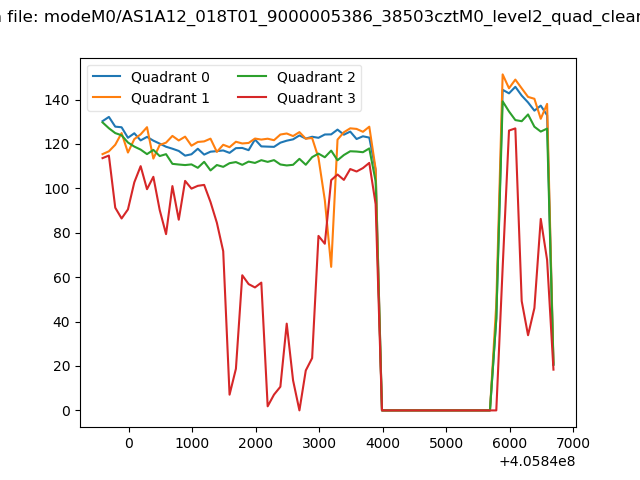 |
|
| Module-wise count rates for Quadrant A Data is divided into 100 sec bins |
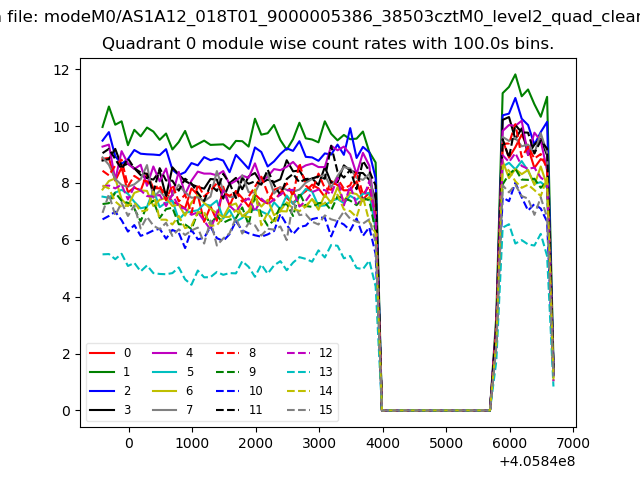 |
 |
| Module-wise count rates for Quadrant B Data is divided into 100 sec bins |
 |
 |
| Module-wise count rates for Quadrant C Data is divided into 100 sec bins |
 |
 |
| Module-wise count rates for Quadrant D Data is divided into 100 sec bins |
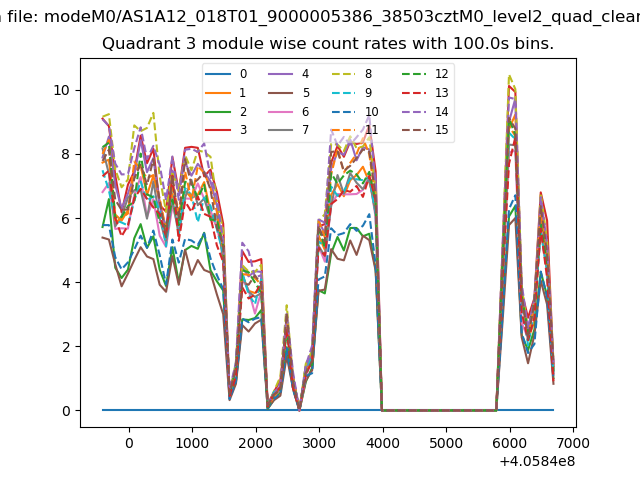 |
 |
| Parameter | Plot |
|---|---|
| CZT HV Monitor | 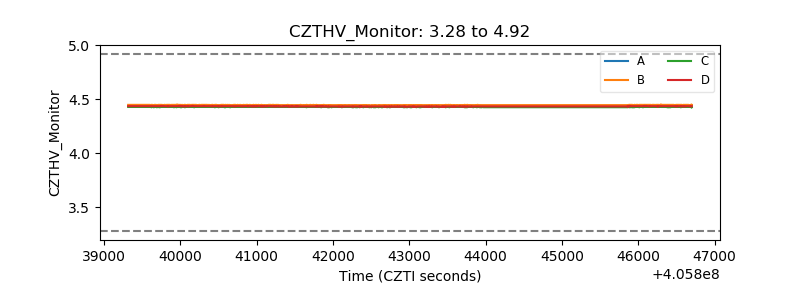 |
| D_VDD | 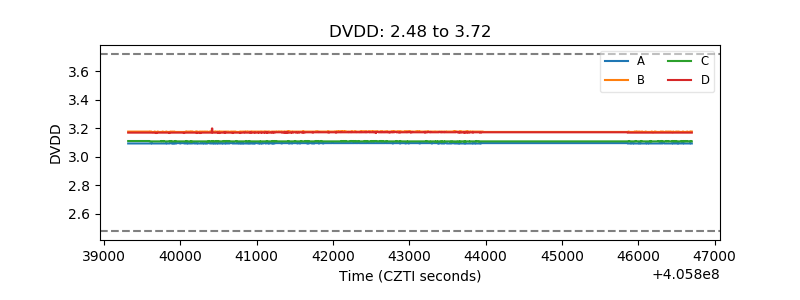 |
| Temperature 1 | 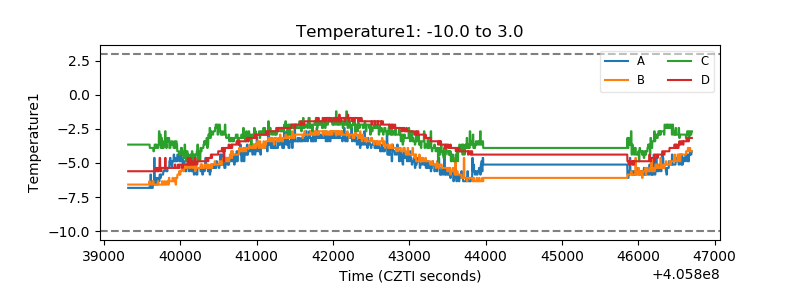 |
| Veto HV Monitor | 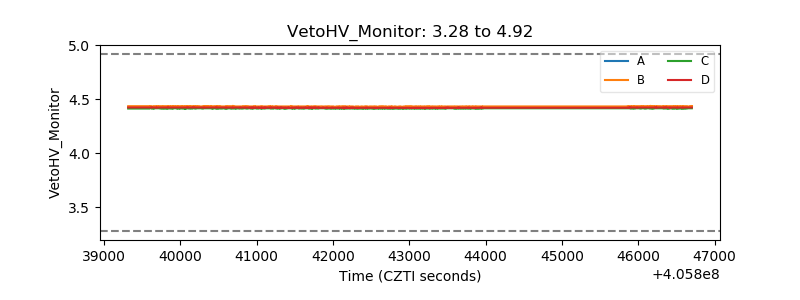 |
| Veto LLD | 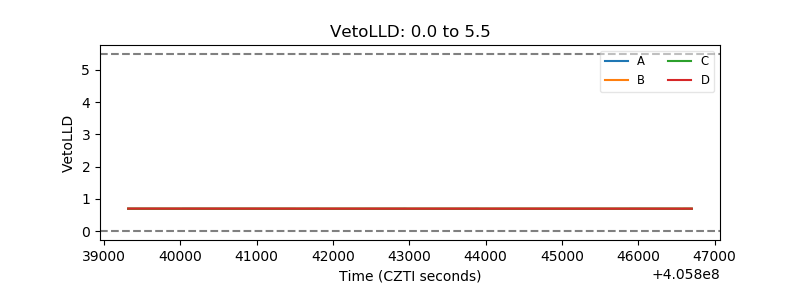 |
| Alpha Counter | 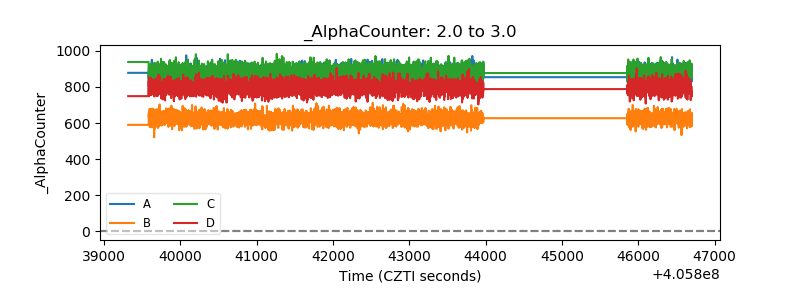 |
| _CPM_Rate | 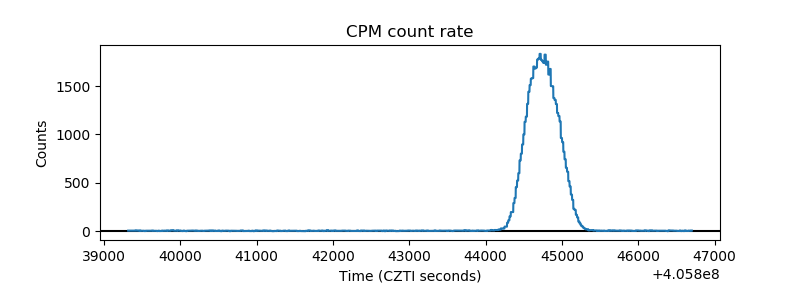 |
| CZT Counter | 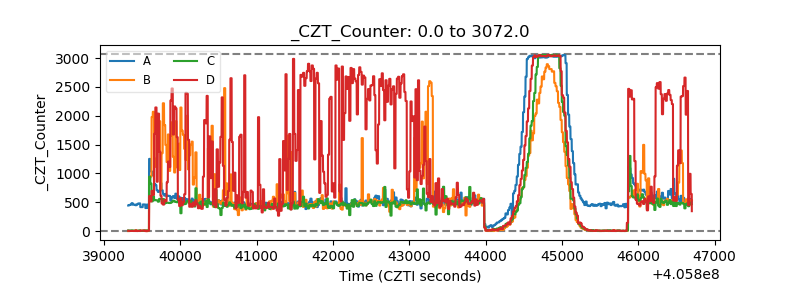 |
| +2.5 Volts monitor | 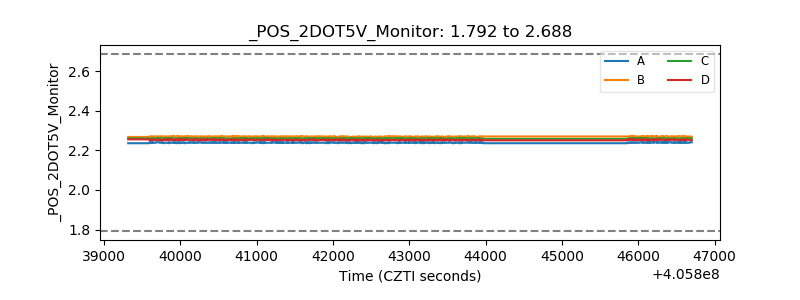 |
| +5 Volts monitor |  |
| _ROLL_ROT | 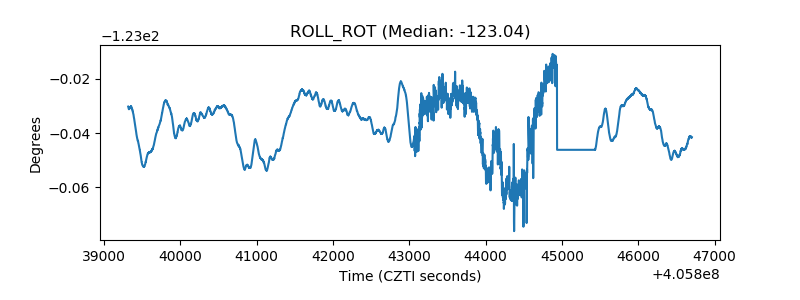 |
| _Roll_DEC | 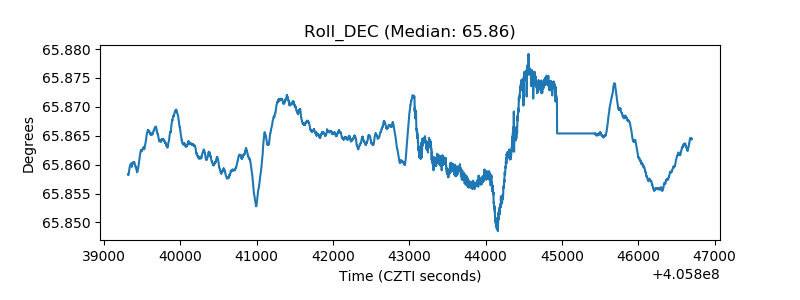 |
| _Roll_RA | 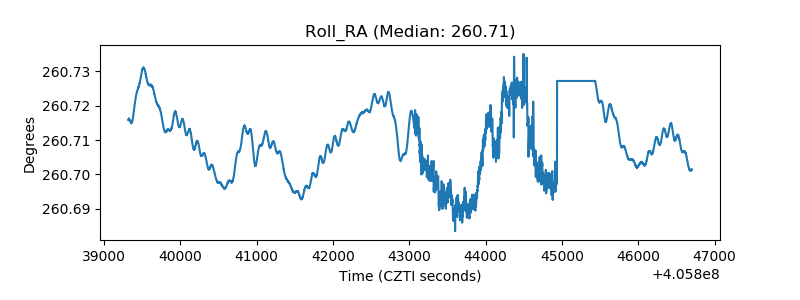 |
| Veto Counter |  |