| Param | Original file | Final file |
|---|---|---|
| Filename | modeM0/AS1A12_018T01_9000005386_38504cztM0_level2.fits | modeM0/AS1A12_018T01_9000005386_38504cztM0_level2_quad_clean.evt |
| Size (bytes) | 348,606,720 | 94,501,440 |
| Size | 332.5 MB | 90.1 MB |
| Events in quadrant A | 2,950,809 | 669,013 |
| Events in quadrant B | 3,078,127 | 683,665 |
| Events in quadrant C | 2,508,954 | 623,122 |
| Events in quadrant D | 3,971,376 | 530,311 |
| Mode SS | |||
|---|---|---|---|
| Quadrant | BADHDUFLAG | Total packets | Discarded packets |
| A | 0 | 104 | 0 |
| B | 0 | 104 | 0 |
| C | 0 | 104 | 0 |
| D | 0 | 104 | 0 |
| Mode M9 | |||
|---|---|---|---|
| Quadrant | BADHDUFLAG | Total packets | Discarded packets |
| A | 0 | 23 | 0 |
| B | 0 | 23 | 0 |
| C | 0 | 23 | 0 |
| D | 0 | 24 | 0 |
| Mode M0 | |||
|---|---|---|---|
| Quadrant | BADHDUFLAG | Total packets | Discarded packets |
| A | 0 | 11824 | 3 |
| B | 0 | 12240 | 2 |
| C | 0 | 10402 | 2 |
| D | 0 | 15180 | 2 |
| Quadrant | Total seconds | Saturated seconds | Saturation percentage |
|---|---|---|---|
| A | 5073 | 31 | 0.611078% |
| B | 5073 | 43 | 0.847625% |
| C | 5073 | 4 | 0.078849% |
| D | 5073 | 491 | 9.678691% |
Noise dominated data is calculated using 1-second bins in cleaned event files. If a bin has >2000 counts, and if more than 50% of those come from <1% of pixels, then it is considered to be noise-dominated and hence unusable.
| Quadrant | # 1 sec bins | Bins with >0 counts | Bins with >2000 counts | High rate bins dominated by noise | Noise dominated (total time) | Noise dominated (detector-on time) | Marked lightcurve |
|---|---|---|---|---|---|---|---|
| A | 7076 | 5074 | 14 | 14 | 0.20% | 0.28% | 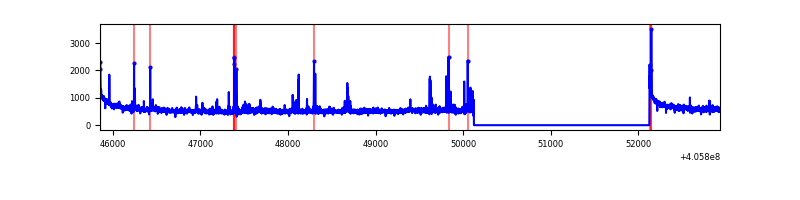 |
| B | 7076 | 5074 | 22 | 22 | 0.31% | 0.43% | 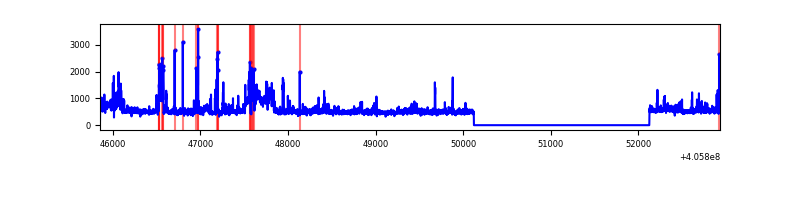 |
| C | 7076 | 5074 | 1 | 1 | 0.01% | 0.02% | 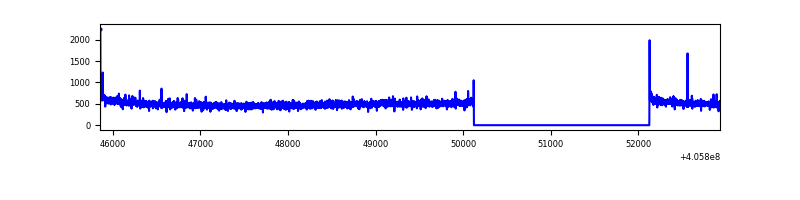 |
| D | 7076 | 5074 | 472 | 472 | 6.67% | 9.30% | 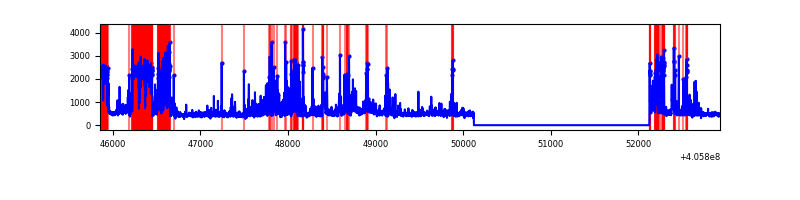 |
Top three noisy pixels from each quadrant. If the there are fewer than three noisy pixels in the level2.evt file, extra rows are filled as -1
| Pixel properties | Quadrant properties | ||||||
|---|---|---|---|---|---|---|---|
| Quadrant | DetID | PixID | Counts | Sigma | Mean | Median | Sigma |
| A | 10 | 83 | 373992 | 3041.36 | 612 | 602 | 122.8 |
| A | 9 | 143 | 73656 | 595.04 | 612 | 602 | 122.8 |
| A | 12 | 189 | 71174 | 574.83 | 612 | 602 | 122.8 |
| B | 8 | 3 | 584918 | 5193.63 | 601 | 588 | 112.5 |
| B | 0 | 213 | 31476 | 274.54 | 601 | 588 | 112.5 |
| B | 4 | 170 | 26024 | 226.08 | 601 | 588 | 112.5 |
| C | 15 | 214 | 216447 | 1620.84 | 578 | 581 | 133.2 |
| C | 0 | 10 | 14882 | 107.38 | 578 | 581 | 133.2 |
| C | 4 | 221 | 8505 | 59.49 | 578 | 581 | 133.2 |
| D | 10 | 118 | 1070439 | 7921.39 | 559 | 543 | 135.1 |
| D | 2 | 153 | 185232 | 1367.42 | 559 | 543 | 135.1 |
| D | 2 | 250 | 182823 | 1349.58 | 559 | 543 | 135.1 |
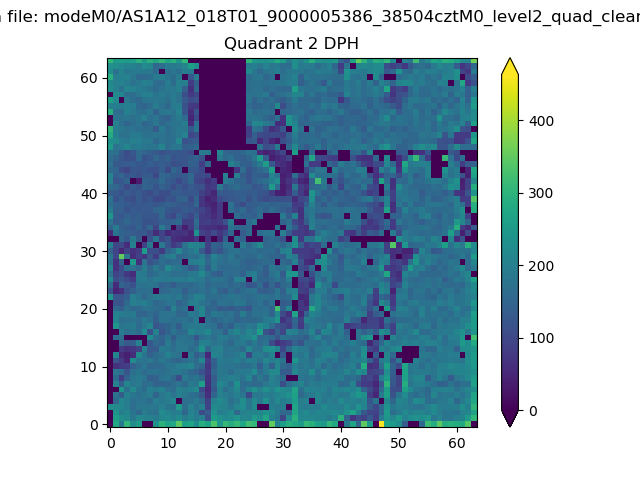
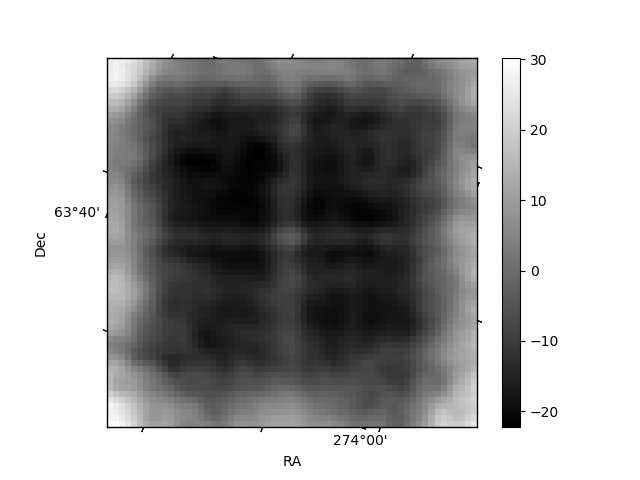
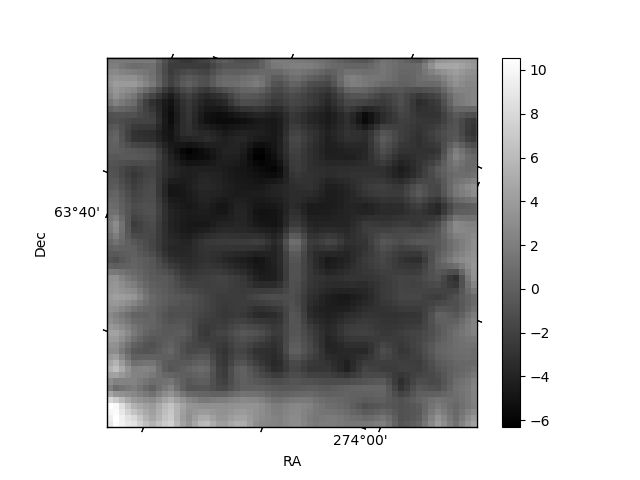
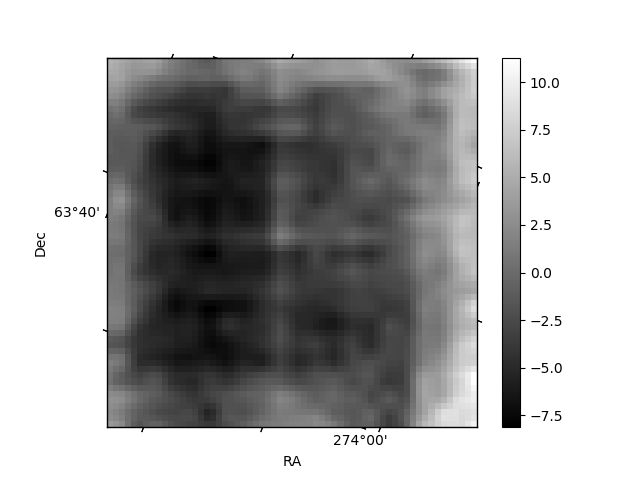
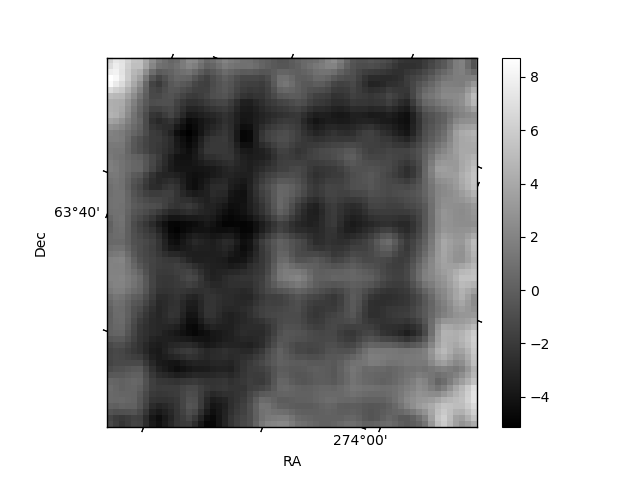
Histogram calculated using DETX and DETY for each event in the final _common_clean file
| Quadrant A | 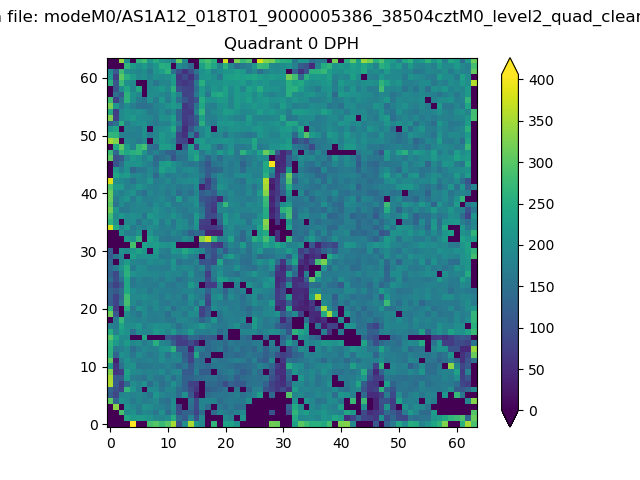 |
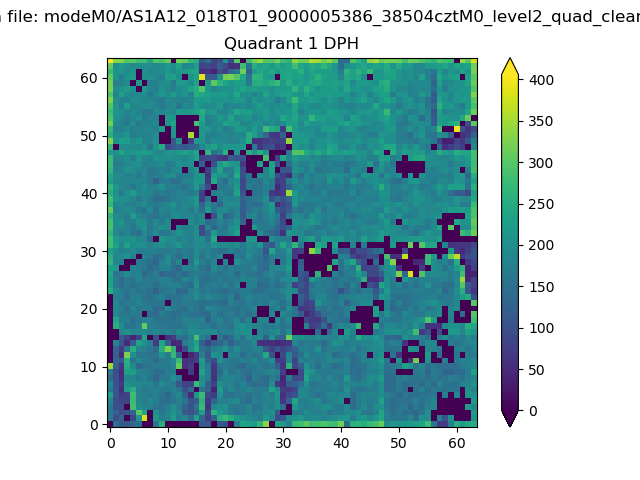 |
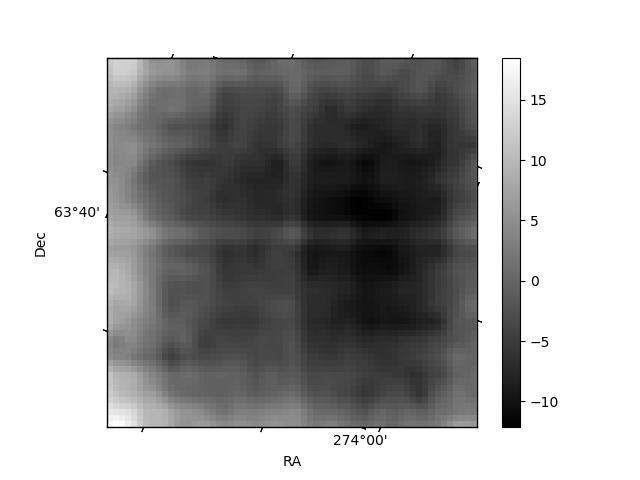
Quadrant B |
|---|---|---|---|
| Quadrant D | 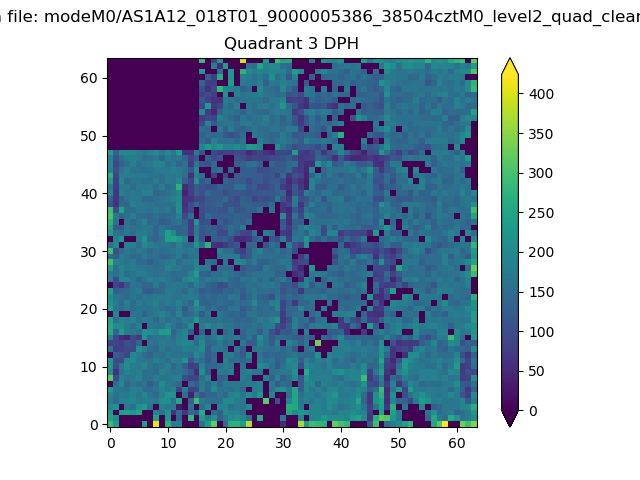 |
 |
Quadrant C |
| Plot type | Count rate plots | Images |
|---|---|---|
| Comparison with Poisson distribution Blue bars denote a histogram of data divided into 1 sec bins. Red curve is a Poisson curve with rate = median count rate of data. |
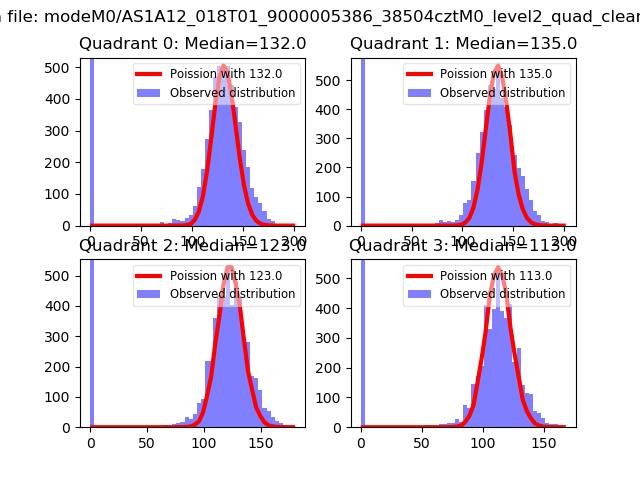 |
 |
| Quadrant-wise count rates Data is divided into 100 sec bins |
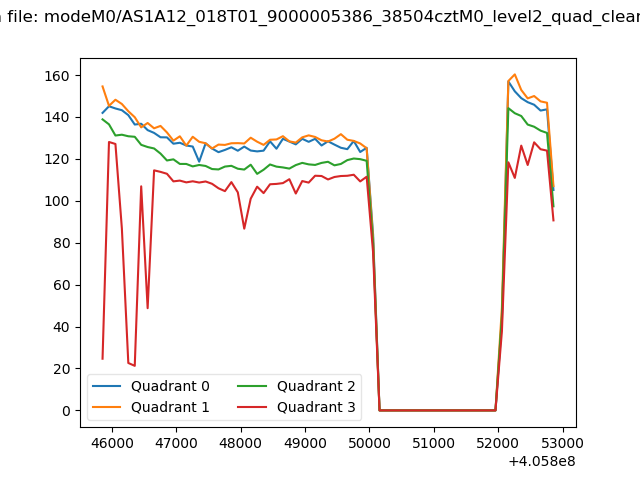 |
|
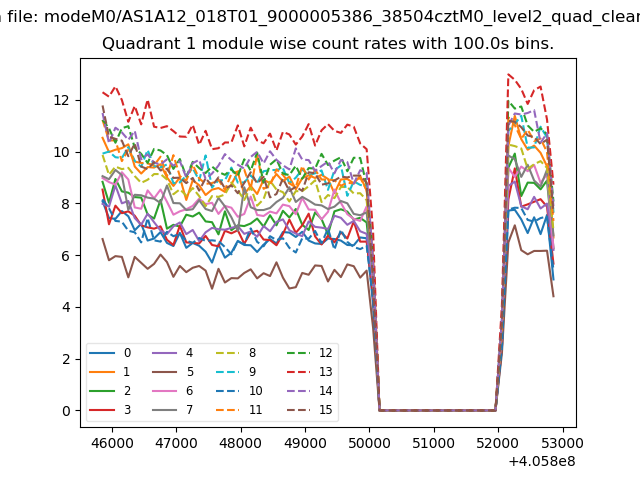
| Module-wise count rates for Quadrant A Data is divided into 100 sec bins |
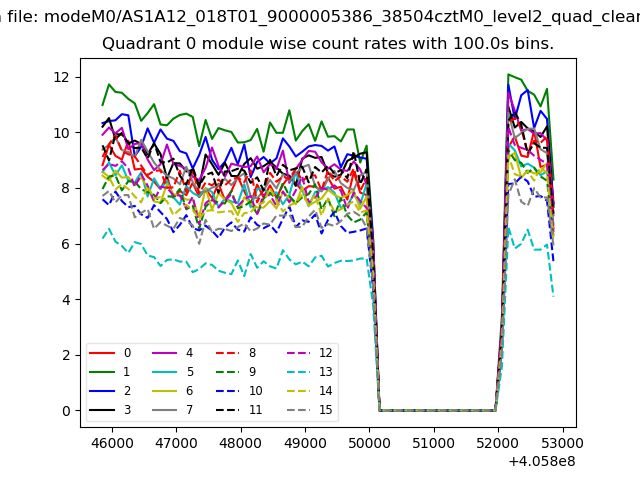 |
 |
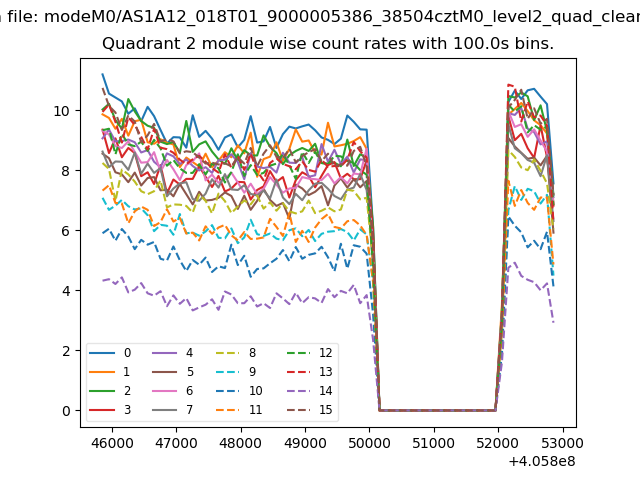
| Module-wise count rates for Quadrant B Data is divided into 100 sec bins |
 |
 |
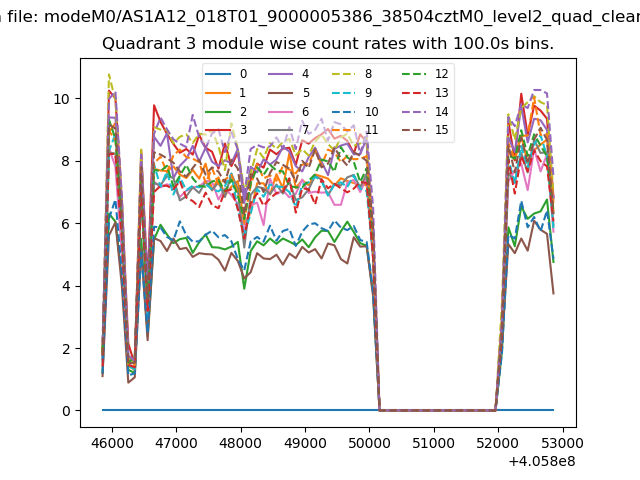
| Module-wise count rates for Quadrant C Data is divided into 100 sec bins |
 |
 |
| Module-wise count rates for Quadrant D Data is divided into 100 sec bins |
 |
 |
| Parameter | Plot |
|---|---|
| CZT HV Monitor | 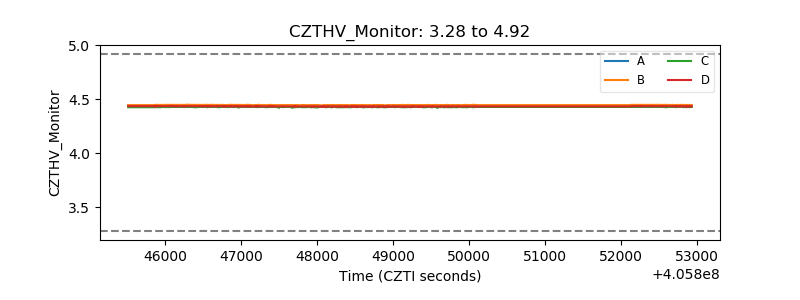 |
| D_VDD | 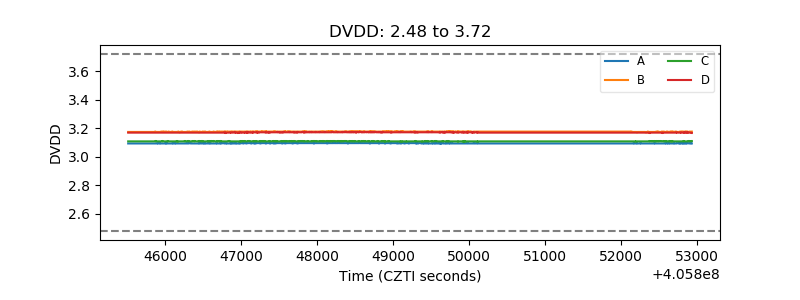 |
| Temperature 1 | 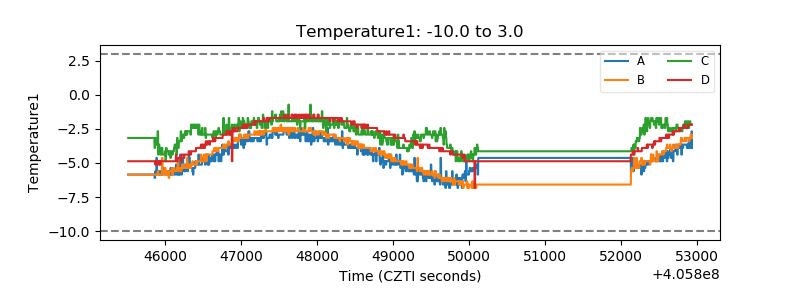 |
| Veto HV Monitor | 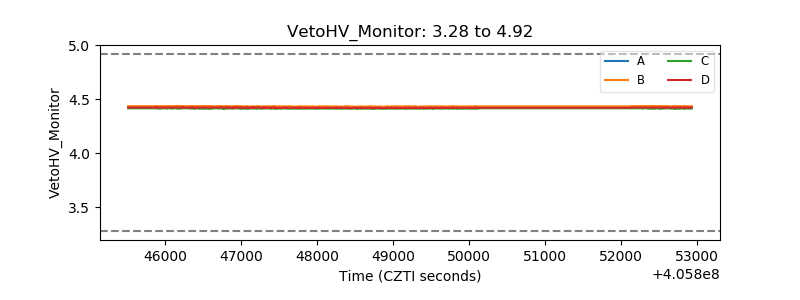 |
| Veto LLD | 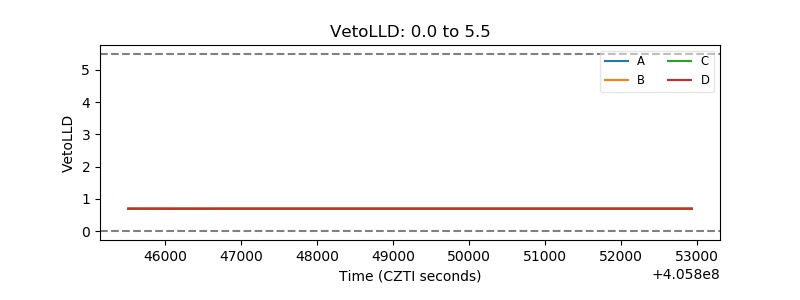 |
| Alpha Counter | 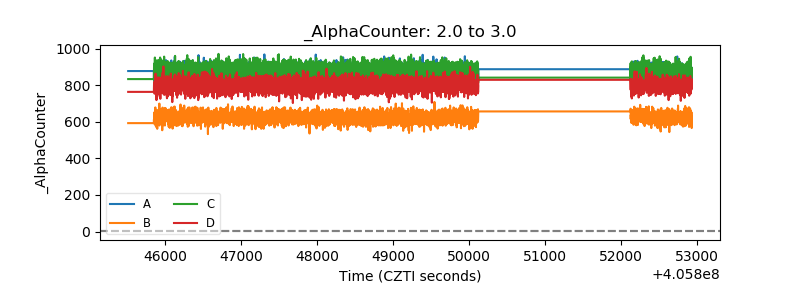 |
| _CPM_Rate | 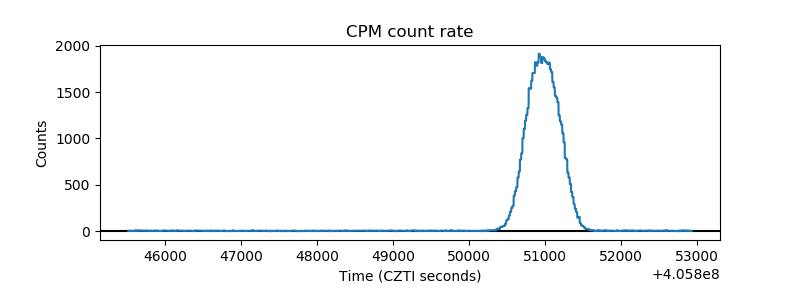 |
| CZT Counter | 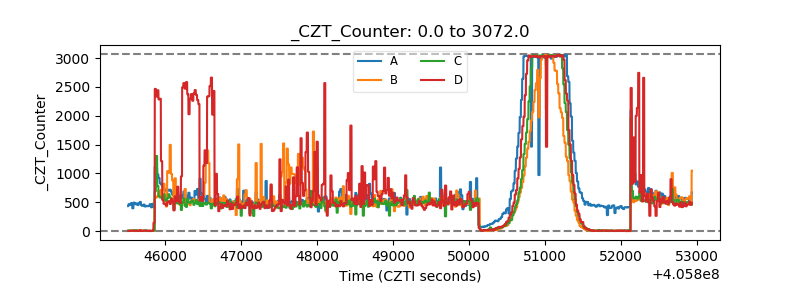 |
| +2.5 Volts monitor | 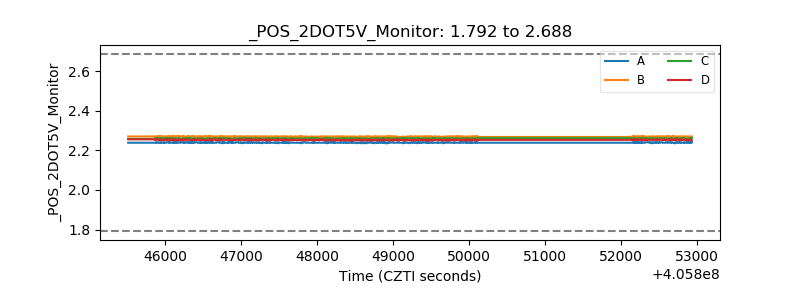 |
| +5 Volts monitor | 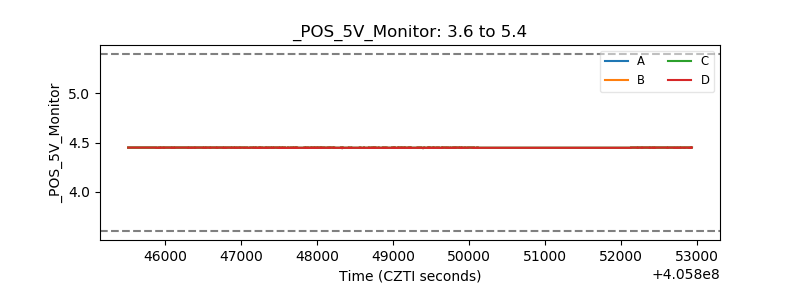 |
| _ROLL_ROT | 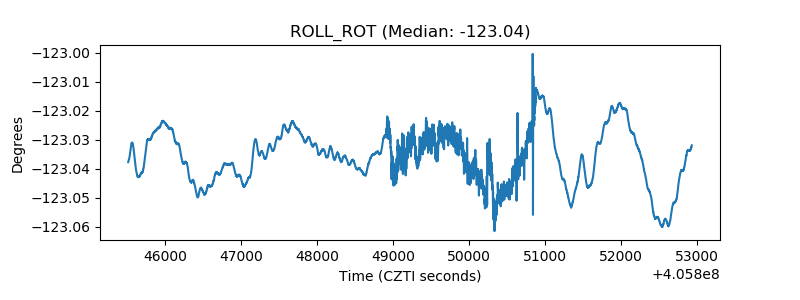 |
| _Roll_DEC | 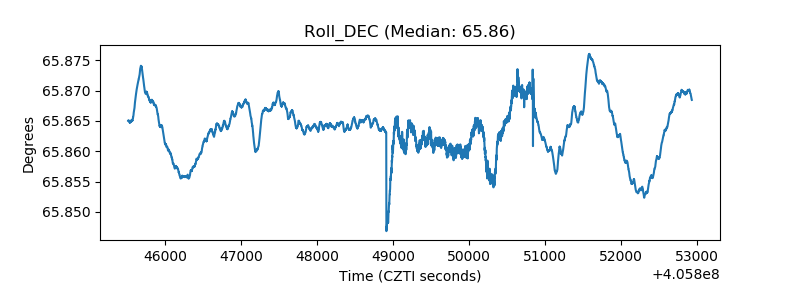 |
| _Roll_RA | 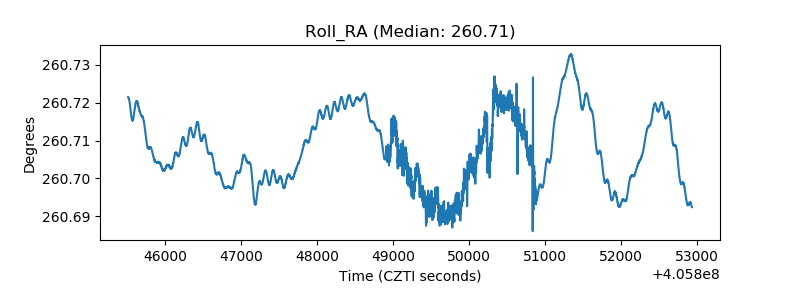 |
| Veto Counter | 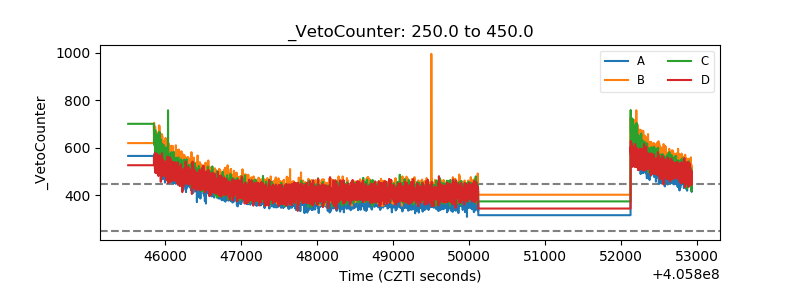 |