| Param | Original file | Final file |
|---|---|---|
| Filename | modeM0/AS1A12_018T01_9000005386_38506cztM0_level2.fits | modeM0/AS1A12_018T01_9000005386_38506cztM0_level2_quad_clean.evt |
| Size (bytes) | 336,882,240 | 91,126,080 |
| Size | 321.3 MB | 86.9 MB |
| Events in quadrant A | 2,733,919 | 641,648 |
| Events in quadrant B | 3,724,629 | 621,300 |
| Events in quadrant C | 2,483,299 | 600,978 |
| Events in quadrant D | 3,150,454 | 555,064 |
| Mode SS | |||
|---|---|---|---|
| Quadrant | BADHDUFLAG | Total packets | Discarded packets |
| A | 0 | 98 | 0 |
| B | 0 | 98 | 0 |
| C | 0 | 98 | 0 |
| D | 0 | 98 | 0 |
| Mode M9 | |||
|---|---|---|---|
| Quadrant | BADHDUFLAG | Total packets | Discarded packets |
| A | 0 | 29 | 0 |
| B | 0 | 29 | 0 |
| C | 0 | 29 | 0 |
| D | 0 | 30 | 0 |
| Mode M0 | |||
|---|---|---|---|
| Quadrant | BADHDUFLAG | Total packets | Discarded packets |
| A | 0 | 10963 | 3 |
| B | 0 | 14201 | 2 |
| C | 0 | 10100 | 2 |
| D | 0 | 12454 | 2 |
| Quadrant | Total seconds | Saturated seconds | Saturation percentage |
|---|---|---|---|
| A | 4854 | 20 | 0.412031% |
| B | 4854 | 306 | 6.304079% |
| C | 4854 | 11 | 0.226617% |
| D | 4854 | 146 | 3.007829% |
Noise dominated data is calculated using 1-second bins in cleaned event files. If a bin has >2000 counts, and if more than 50% of those come from <1% of pixels, then it is considered to be noise-dominated and hence unusable.
| Quadrant | # 1 sec bins | Bins with >0 counts | Bins with >2000 counts | High rate bins dominated by noise | Noise dominated (total time) | Noise dominated (detector-on time) | Marked lightcurve |
|---|---|---|---|---|---|---|---|
| A | 7006 | 4855 | 6 | 6 | 0.09% | 0.12% | 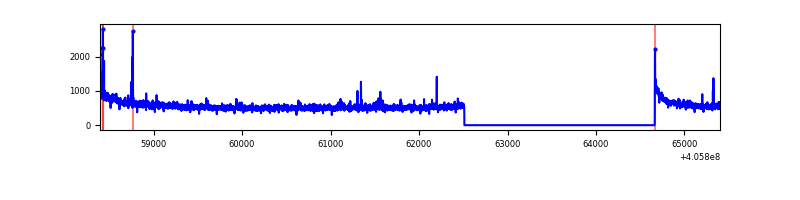 |
| B | 7006 | 4855 | 260 | 260 | 3.71% | 5.36% | 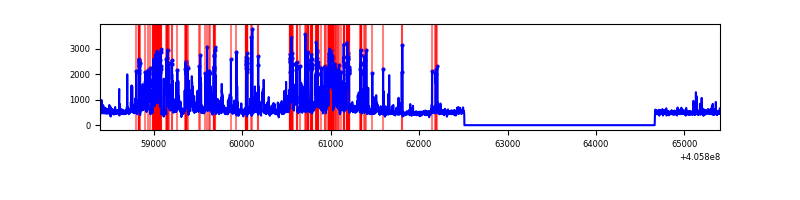 |
| C | 7006 | 4855 | 9 | 9 | 0.13% | 0.19% | 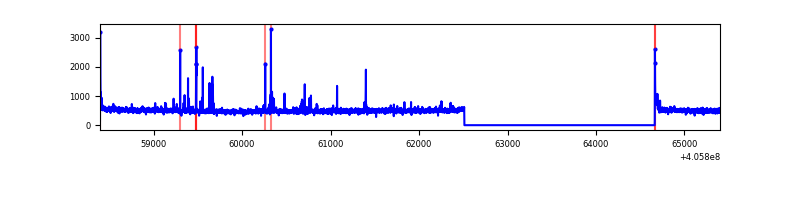 |
| D | 7006 | 4855 | 128 | 128 | 1.83% | 2.64% | 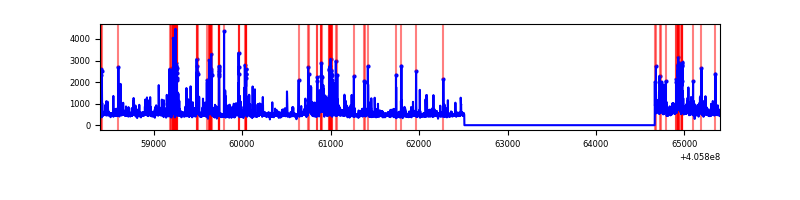 |
Top three noisy pixels from each quadrant. If the there are fewer than three noisy pixels in the level2.evt file, extra rows are filled as -1
| Pixel properties | Quadrant properties | ||||||
|---|---|---|---|---|---|---|---|
| Quadrant | DetID | PixID | Counts | Sigma | Mean | Median | Sigma |
| A | 10 | 83 | 380648 | 3285.42 | 581 | 571 | 115.7 |
| A | 12 | 189 | 40400 | 344.29 | 581 | 571 | 115.7 |
| A | 9 | 143 | 29953 | 253.98 | 581 | 571 | 115.7 |
| B | 8 | 3 | 1459920 | 13969.85 | 560 | 548 | 104.5 |
| B | 0 | 213 | 18641 | 173.2 | 560 | 548 | 104.5 |
| B | 12 | 111 | 12571 | 115.09 | 560 | 548 | 104.5 |
| C | 15 | 214 | 205218 | 1596.37 | 557 | 562 | 128.2 |
| C | 14 | 254 | 64913 | 501.96 | 557 | 562 | 128.2 |
| C | 0 | 10 | 28523 | 218.1 | 557 | 562 | 128.2 |
| D | 13 | 249 | 276658 | 2074.65 | 559 | 545 | 133.1 |
| D | 2 | 250 | 241477 | 1810.31 | 559 | 545 | 133.1 |
| D | 12 | 233 | 201108 | 1506.98 | 559 | 545 | 133.1 |
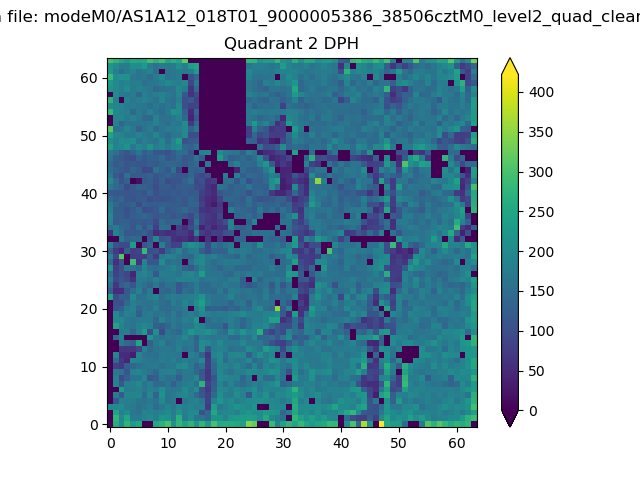
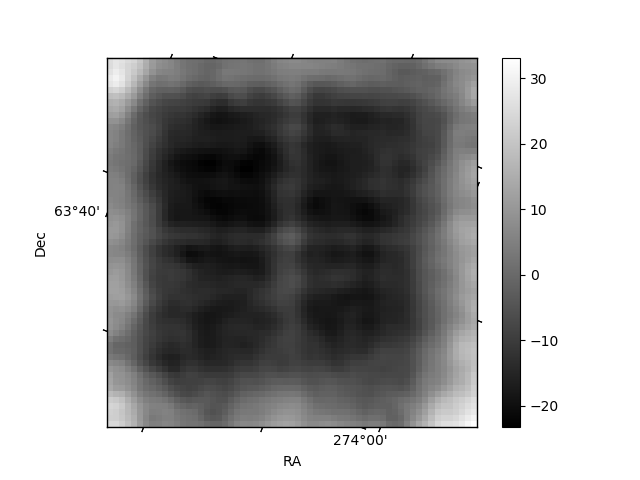
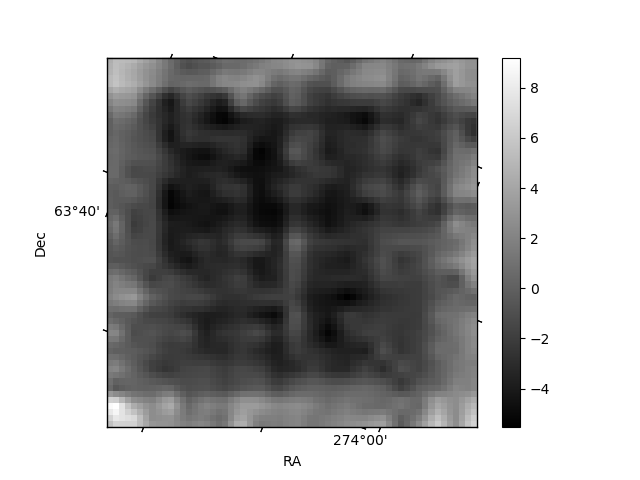
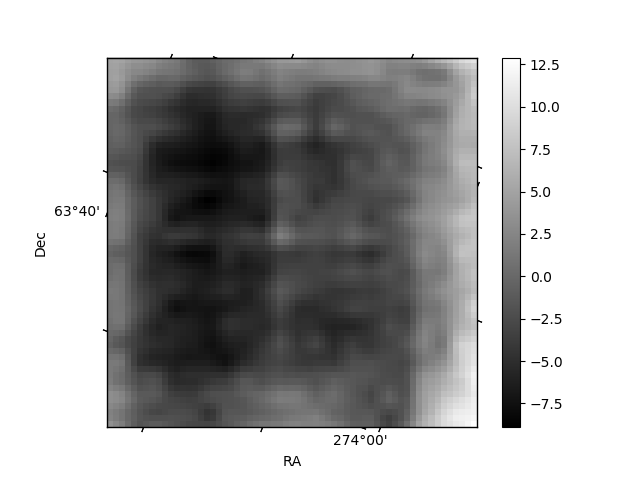
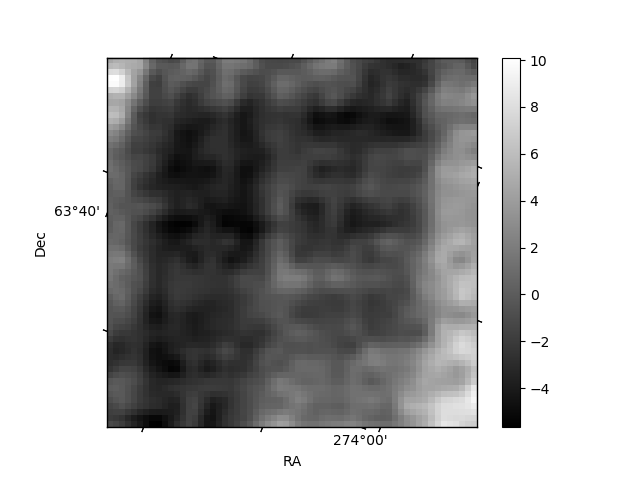
Histogram calculated using DETX and DETY for each event in the final _common_clean file
| Quadrant A | 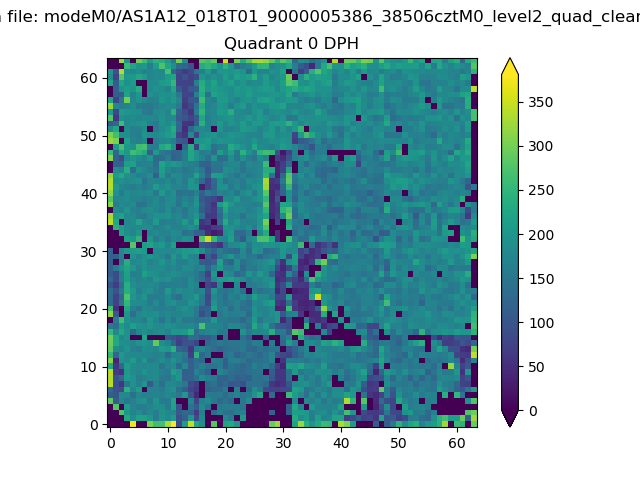 |
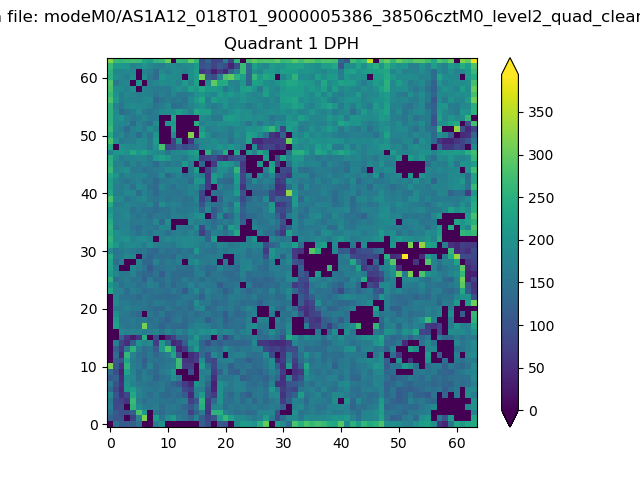 |
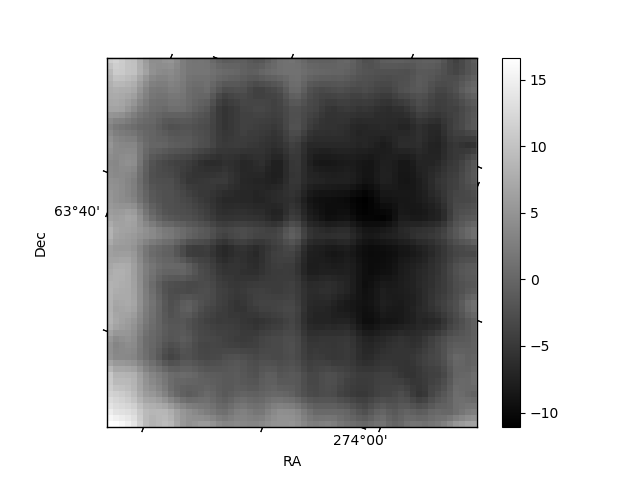
Quadrant B |
|---|---|---|---|
| Quadrant D | 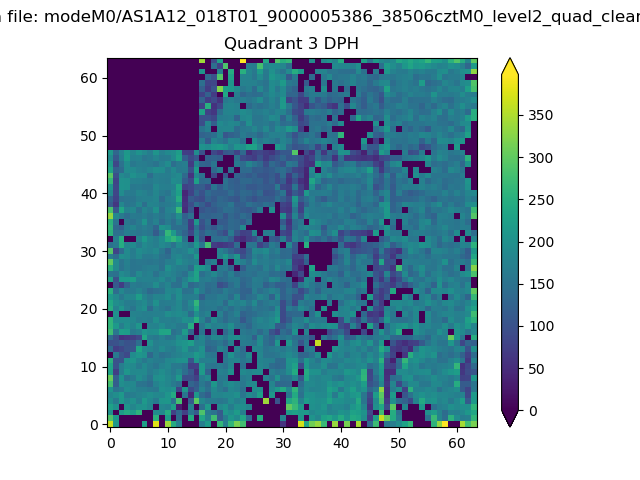 |
 |
Quadrant C |
| Plot type | Count rate plots | Images |
|---|---|---|
| Comparison with Poisson distribution Blue bars denote a histogram of data divided into 1 sec bins. Red curve is a Poisson curve with rate = median count rate of data. |
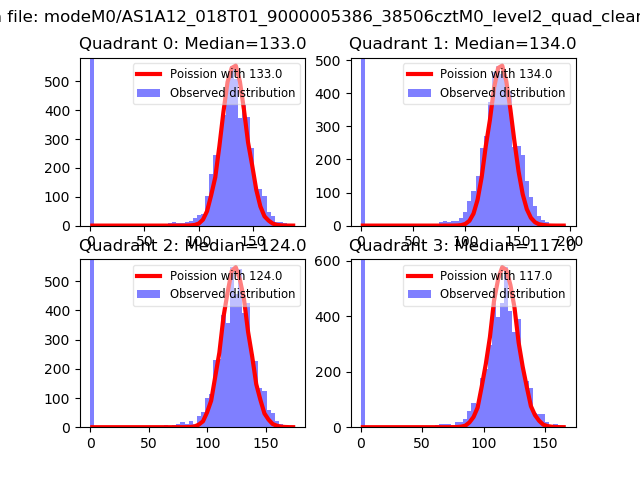 |
 |
| Quadrant-wise count rates Data is divided into 100 sec bins |
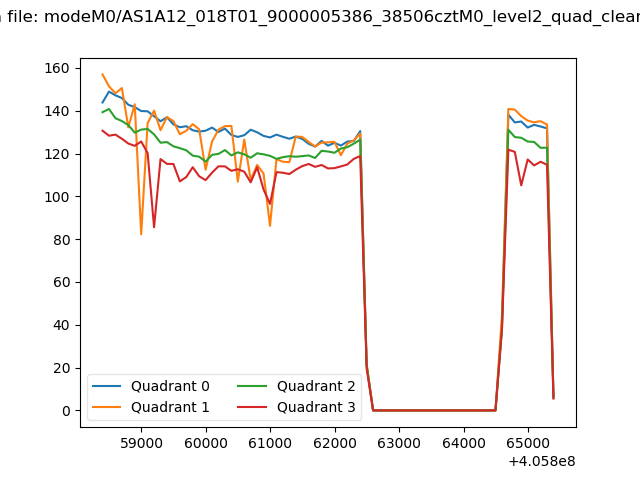 |
|
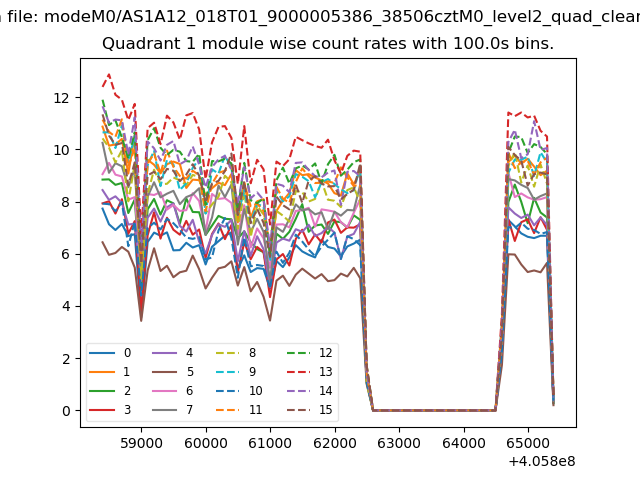
| Module-wise count rates for Quadrant A Data is divided into 100 sec bins |
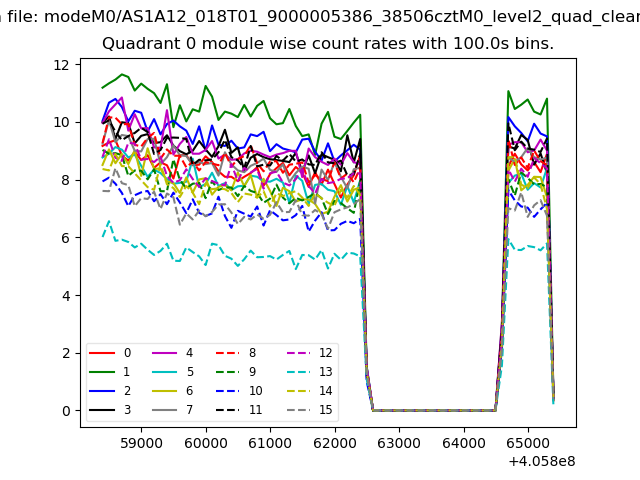 |
 |
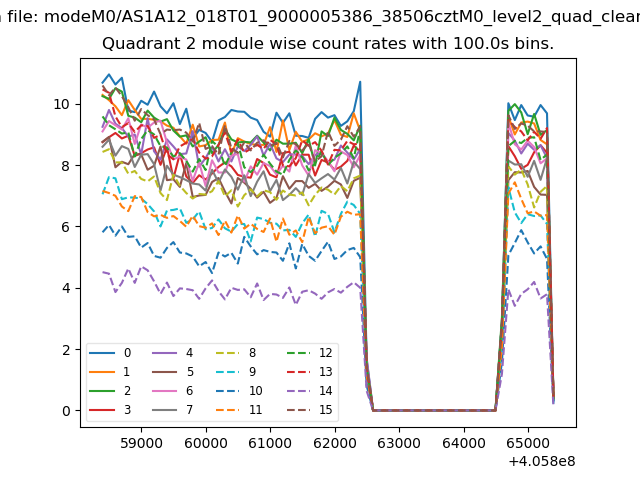
| Module-wise count rates for Quadrant B Data is divided into 100 sec bins |
 |
 |
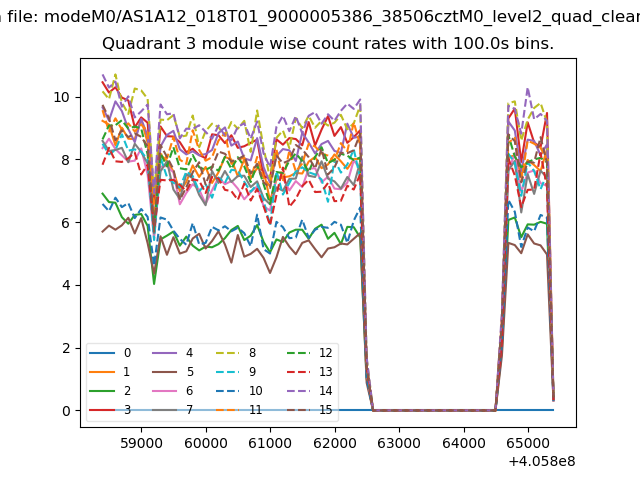
| Module-wise count rates for Quadrant C Data is divided into 100 sec bins |
 |
 |
| Module-wise count rates for Quadrant D Data is divided into 100 sec bins |
 |
 |
| Parameter | Plot |
|---|---|
| CZT HV Monitor | 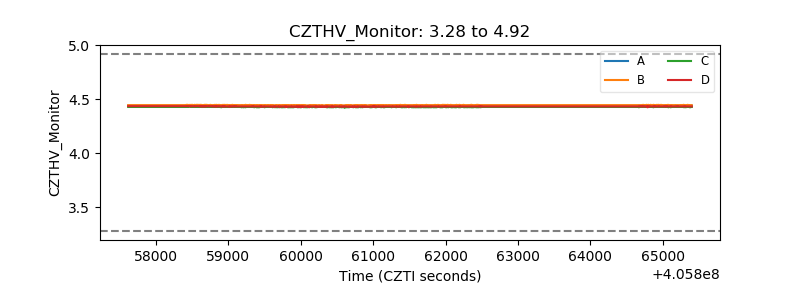 |
| D_VDD | 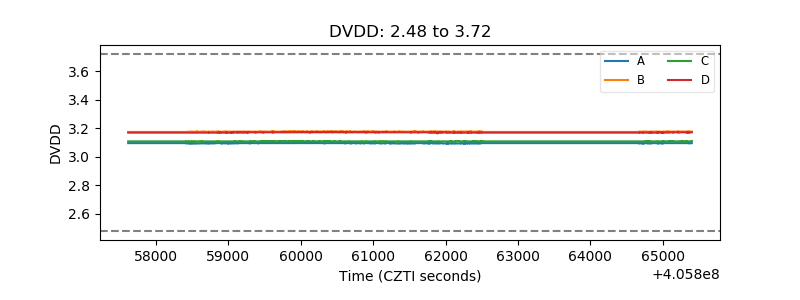 |
| Temperature 1 | 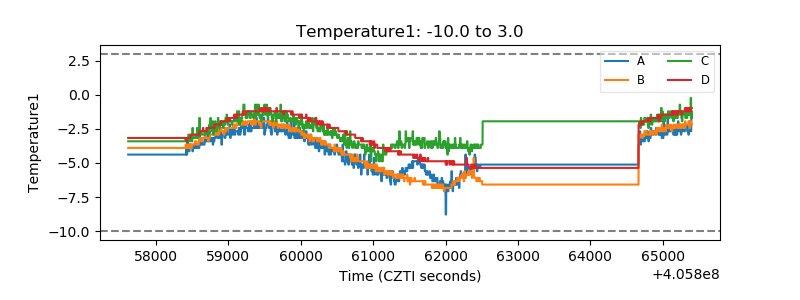 |
| Veto HV Monitor | 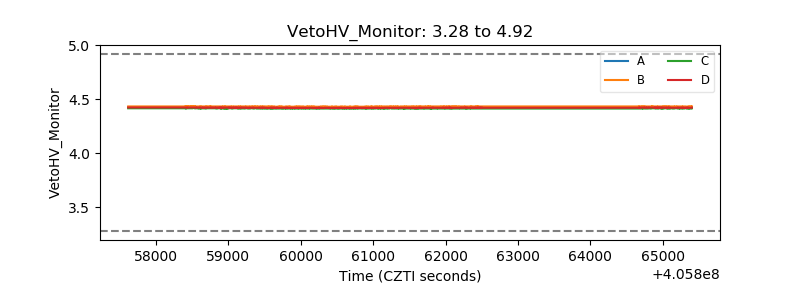 |
| Veto LLD | 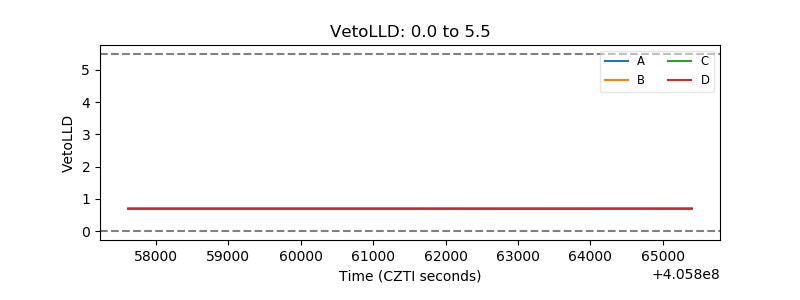 |
| Alpha Counter | 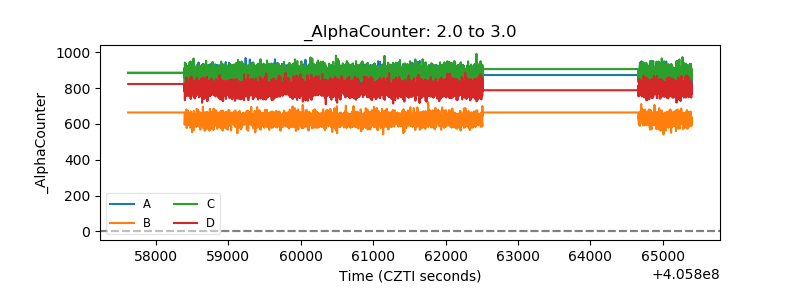 |
| _CPM_Rate | 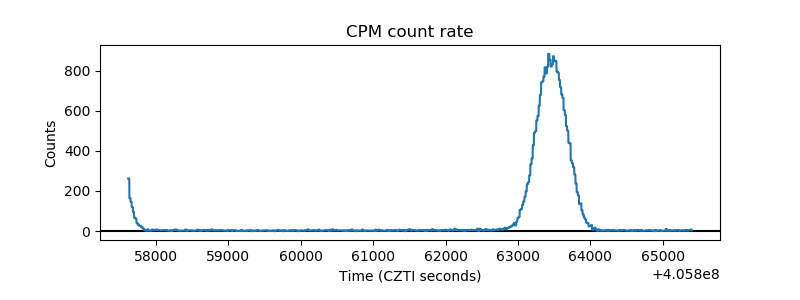 |
| CZT Counter | 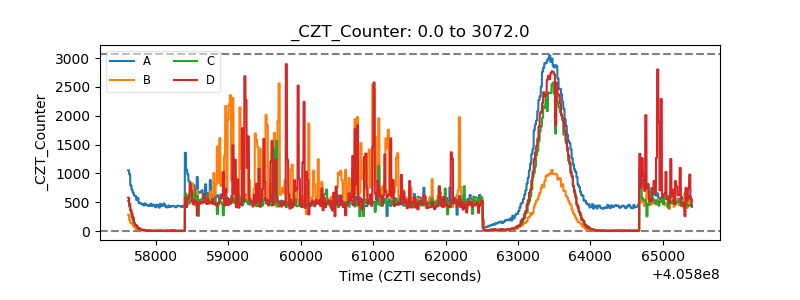 |
| +2.5 Volts monitor | 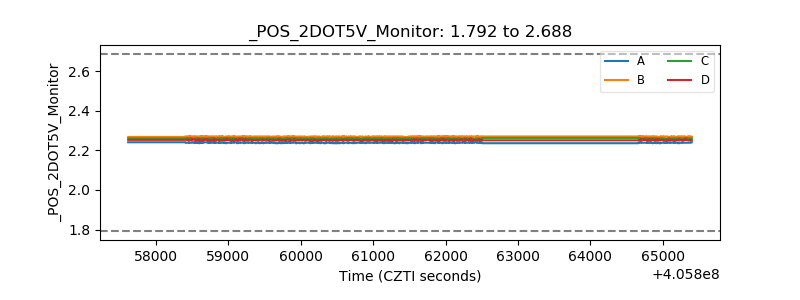 |
| +5 Volts monitor | 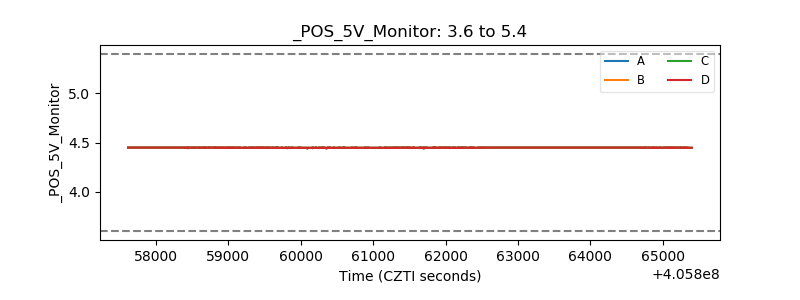 |
| _ROLL_ROT | 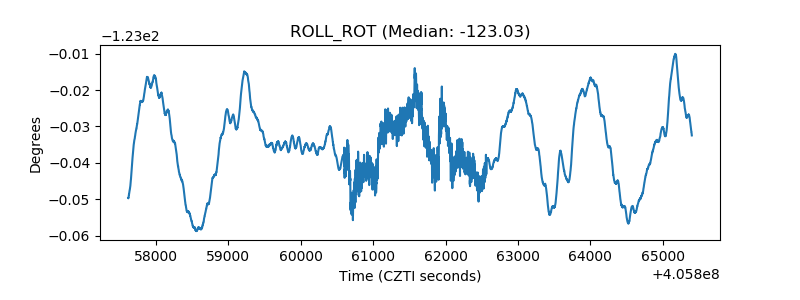 |
| _Roll_DEC | 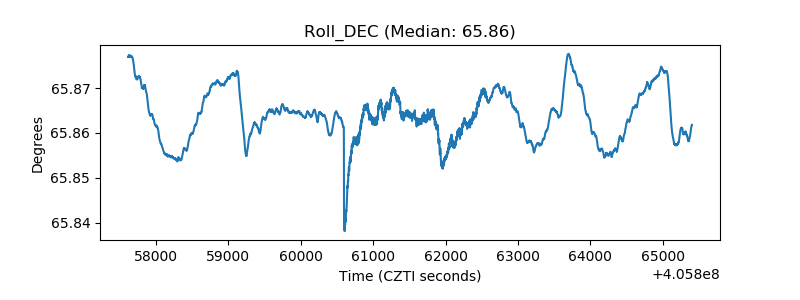 |
| _Roll_RA | 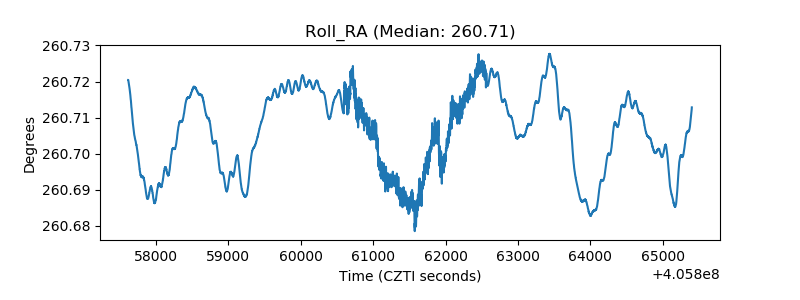 |
| Veto Counter | 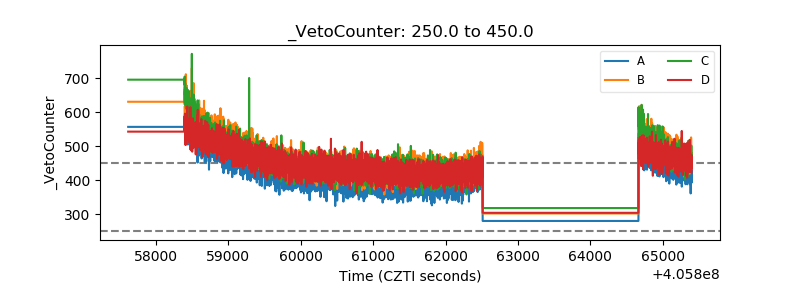 |