| Param | Original file | Final file |
|---|---|---|
| Filename | modeM0/AS1A12_018T01_9000005386_38507cztM0_level2.fits | modeM0/AS1A12_018T01_9000005386_38507cztM0_level2_quad_clean.evt |
| Size (bytes) | 305,478,720 | 89,141,760 |
| Size | 291.3 MB | 85.0 MB |
| Events in quadrant A | 2,653,922 | 616,050 |
| Events in quadrant B | 2,591,220 | 621,169 |
| Events in quadrant C | 2,440,584 | 580,559 |
| Events in quadrant D | 3,238,217 | 536,367 |
| Mode SS | |||
|---|---|---|---|
| Quadrant | BADHDUFLAG | Total packets | Discarded packets |
| A | 0 | 100 | 0 |
| B | 0 | 100 | 0 |
| C | 0 | 100 | 0 |
| D | 0 | 100 | 0 |
| Mode M9 | |||
|---|---|---|---|
| Quadrant | BADHDUFLAG | Total packets | Discarded packets |
| A | 0 | 24 | 0 |
| B | 0 | 24 | 0 |
| C | 0 | 24 | 0 |
| D | 0 | 25 | 0 |
| Mode M0 | |||
|---|---|---|---|
| Quadrant | BADHDUFLAG | Total packets | Discarded packets |
| A | 0 | 10814 | 3 |
| B | 0 | 10727 | 2 |
| C | 0 | 10116 | 2 |
| D | 0 | 12932 | 2 |
| Quadrant | Total seconds | Saturated seconds | Saturation percentage |
|---|---|---|---|
| A | 4924 | 13 | 0.264013% |
| B | 4924 | 30 | 0.609261% |
| C | 4924 | 11 | 0.223396% |
| D | 4924 | 156 | 3.168156% |
Noise dominated data is calculated using 1-second bins in cleaned event files. If a bin has >2000 counts, and if more than 50% of those come from <1% of pixels, then it is considered to be noise-dominated and hence unusable.
| Quadrant | # 1 sec bins | Bins with >0 counts | Bins with >2000 counts | High rate bins dominated by noise | Noise dominated (total time) | Noise dominated (detector-on time) | Marked lightcurve |
|---|---|---|---|---|---|---|---|
| A | 7018 | 4925 | 5 | 5 | 0.07% | 0.10% | 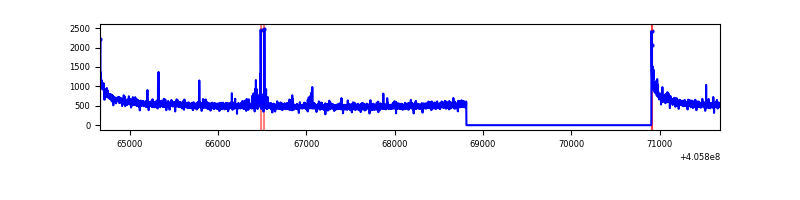 |
| B | 7018 | 4925 | 20 | 20 | 0.28% | 0.41% | 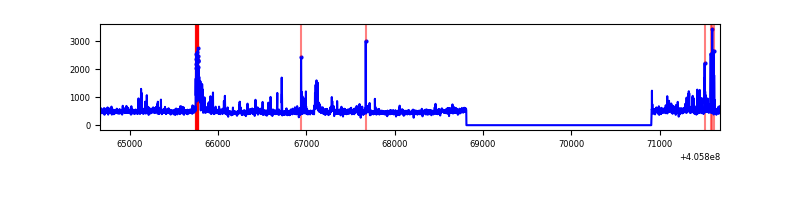 |
| C | 7018 | 4925 | 10 | 10 | 0.14% | 0.20% | 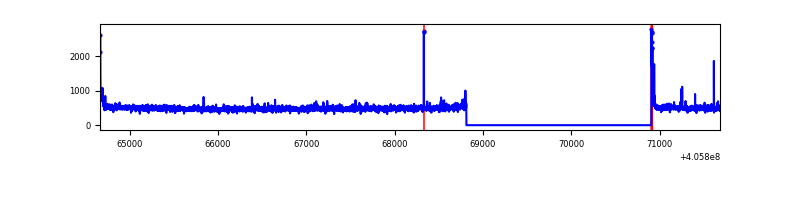 |
| D | 7018 | 4925 | 135 | 135 | 1.92% | 2.74% | 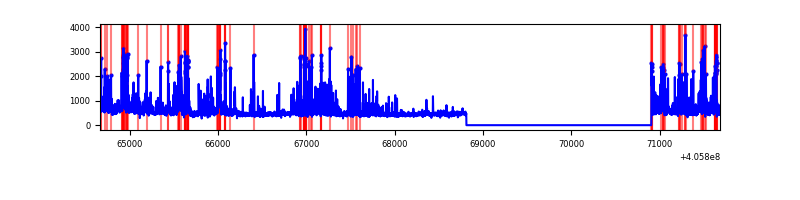 |
Top three noisy pixels from each quadrant. If the there are fewer than three noisy pixels in the level2.evt file, extra rows are filled as -1
| Pixel properties | Quadrant properties | ||||||
|---|---|---|---|---|---|---|---|
| Quadrant | DetID | PixID | Counts | Sigma | Mean | Median | Sigma |
| A | 10 | 83 | 386264 | 3380.37 | 567 | 555 | 114.1 |
| A | 13 | 248 | 45163 | 390.95 | 567 | 555 | 114.1 |
| A | 13 | 6 | 15994 | 135.31 | 567 | 555 | 114.1 |
| B | 8 | 3 | 104437 | 983.63 | 561 | 548 | 105.6 |
| B | 0 | 183 | 90608 | 852.7 | 561 | 548 | 105.6 |
| B | 0 | 186 | 79841 | 750.76 | 561 | 548 | 105.6 |
| C | 15 | 214 | 208896 | 1621.91 | 550 | 554 | 128.5 |
| C | 0 | 10 | 43662 | 335.59 | 550 | 554 | 128.5 |
| C | 14 | 254 | 15666 | 117.64 | 550 | 554 | 128.5 |
| D | 13 | 249 | 344217 | 2583.4 | 551 | 536 | 133.0 |
| D | 12 | 233 | 270197 | 2027.0 | 551 | 536 | 133.0 |
| D | 2 | 250 | 139575 | 1045.14 | 551 | 536 | 133.0 |
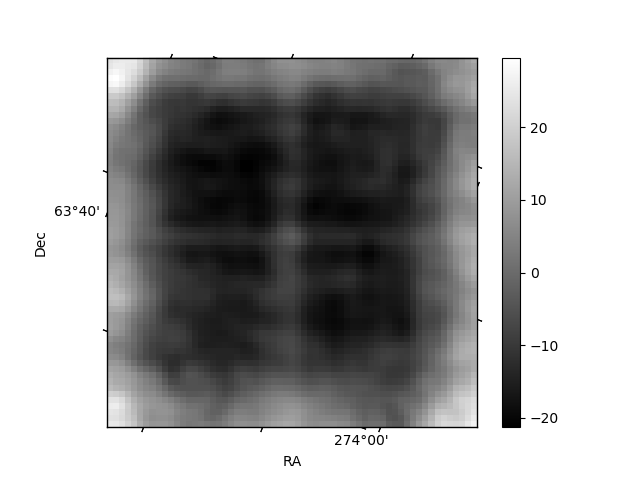
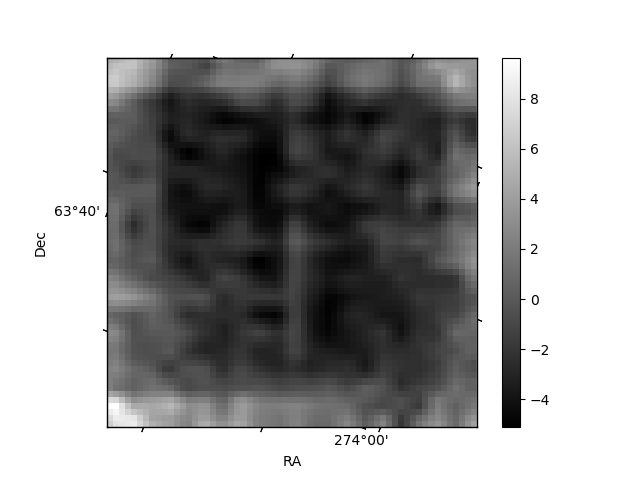
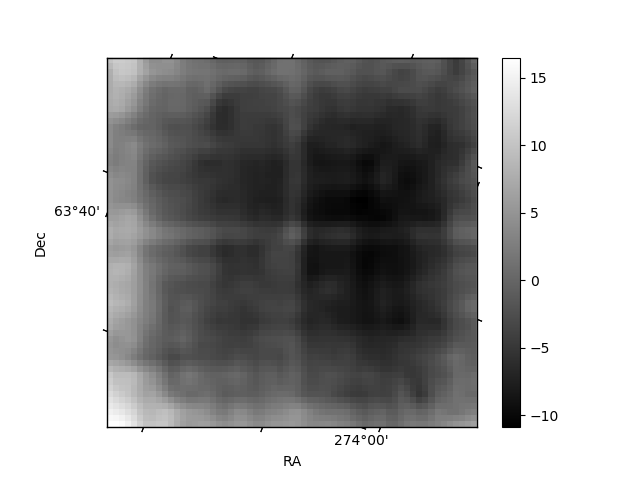
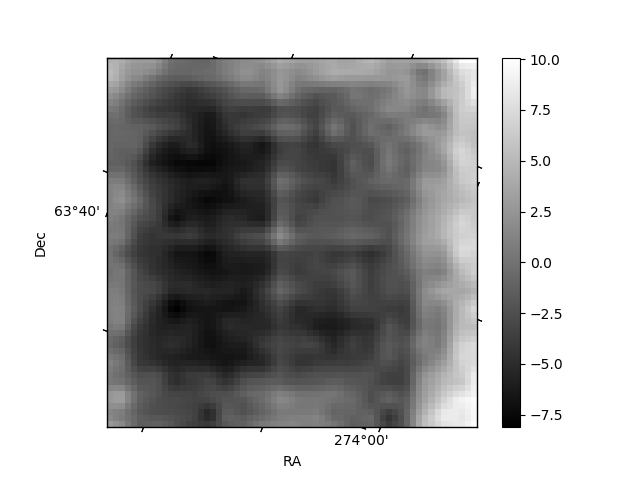
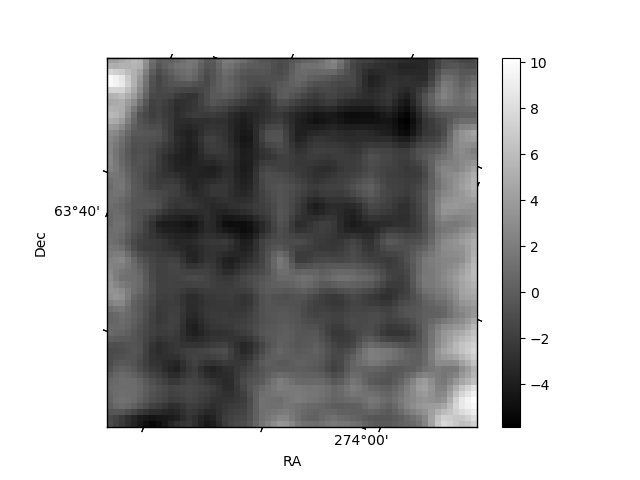
Histogram calculated using DETX and DETY for each event in the final _common_clean file
| Quadrant A | 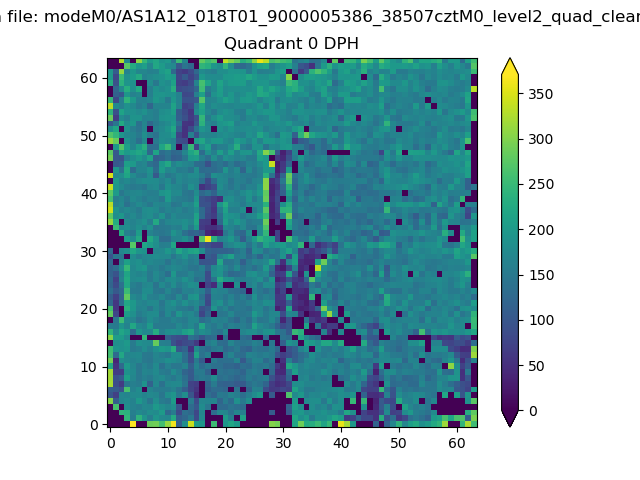 |
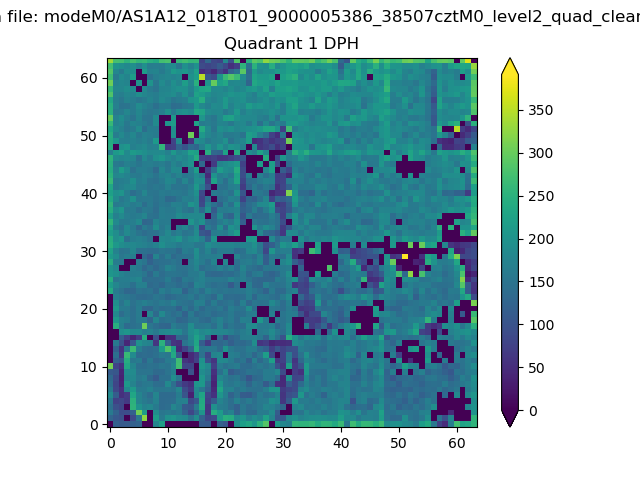 |
Quadrant B |
|---|---|---|---|
| Quadrant D | 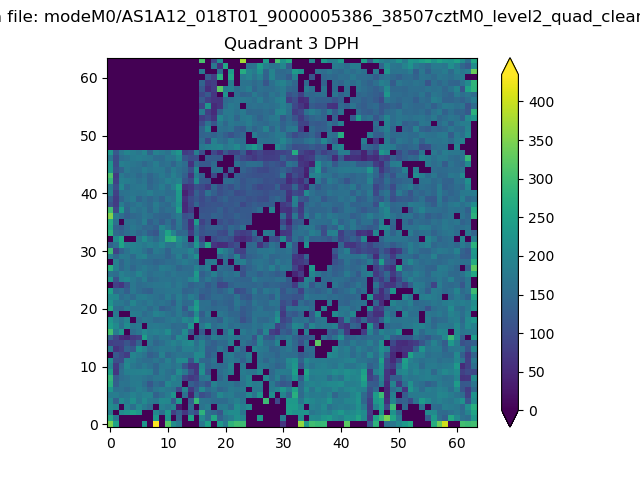 |
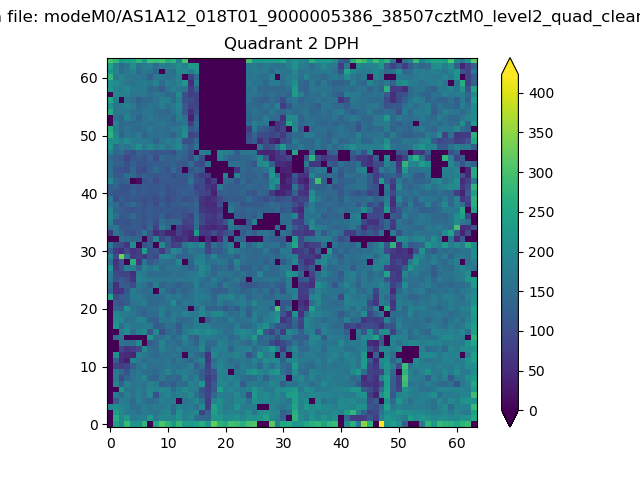 |
Quadrant C |
| Plot type | Count rate plots | Images |
|---|---|---|
| Comparison with Poisson distribution Blue bars denote a histogram of data divided into 1 sec bins. Red curve is a Poisson curve with rate = median count rate of data. |
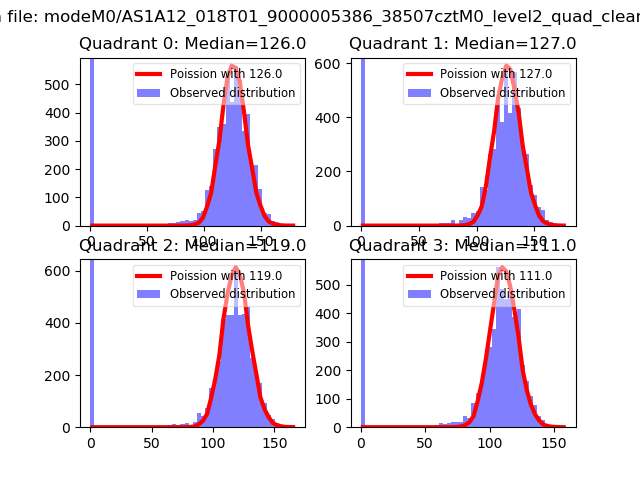 |
 |
| Quadrant-wise count rates Data is divided into 100 sec bins |
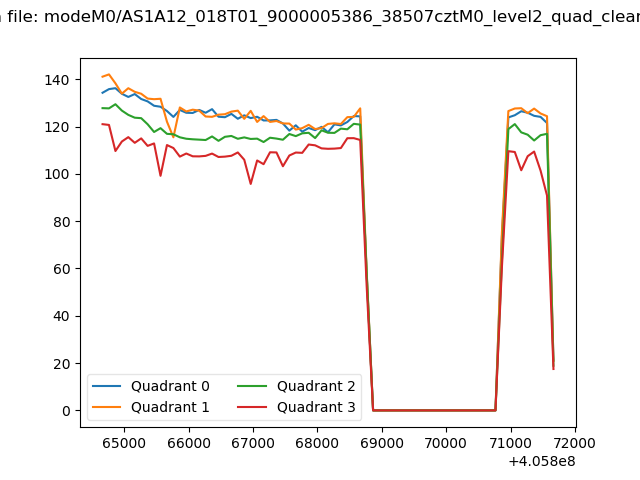 |
|
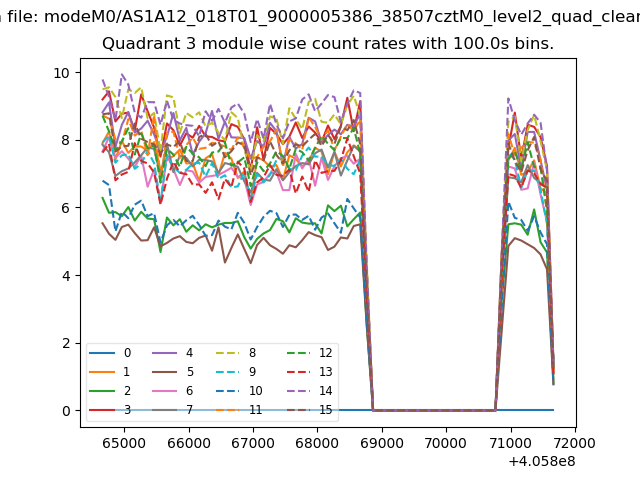
| Module-wise count rates for Quadrant A Data is divided into 100 sec bins |
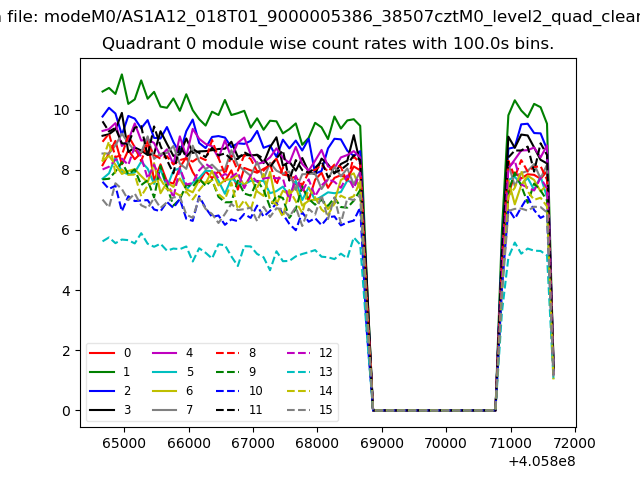 |
 |
| Module-wise count rates for Quadrant B Data is divided into 100 sec bins |
 |
 |
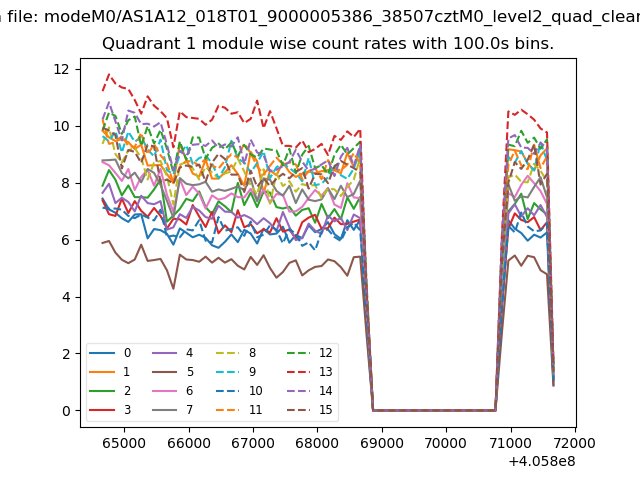
| Module-wise count rates for Quadrant C Data is divided into 100 sec bins |
 |
 |
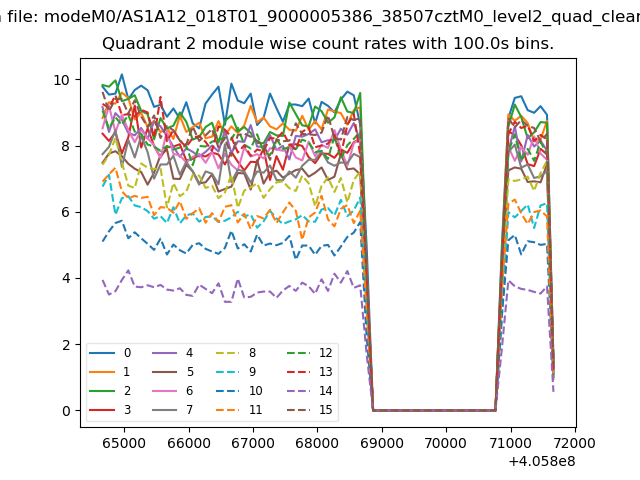
| Module-wise count rates for Quadrant D Data is divided into 100 sec bins |
 |
 |
| Parameter | Plot |
|---|---|
| CZT HV Monitor | 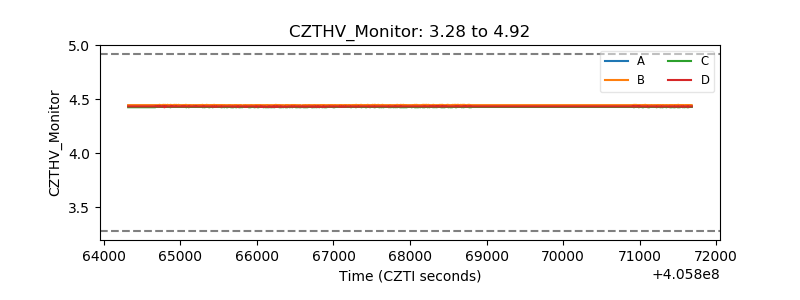 |
| D_VDD |  |
| Temperature 1 | 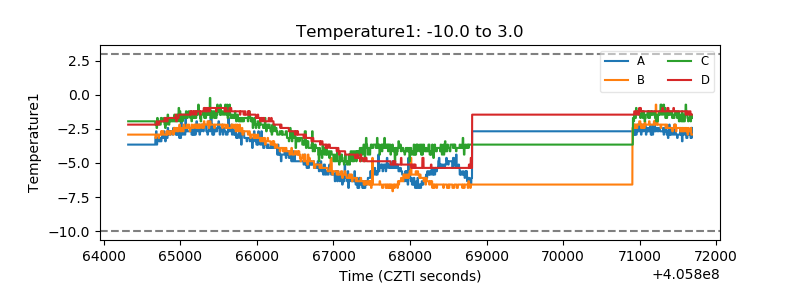 |
| Veto HV Monitor | 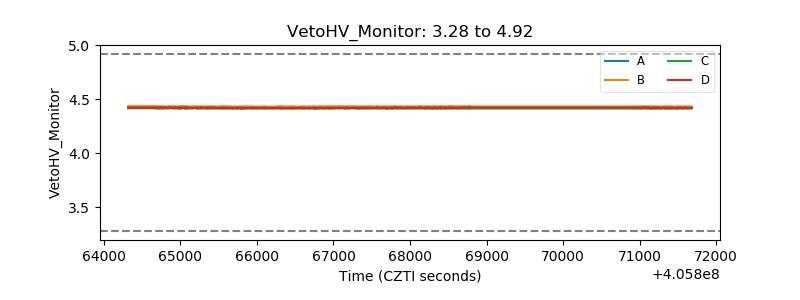 |
| Veto LLD | 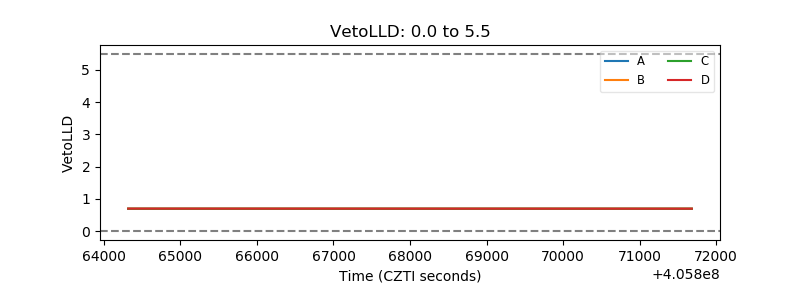 |
| Alpha Counter | 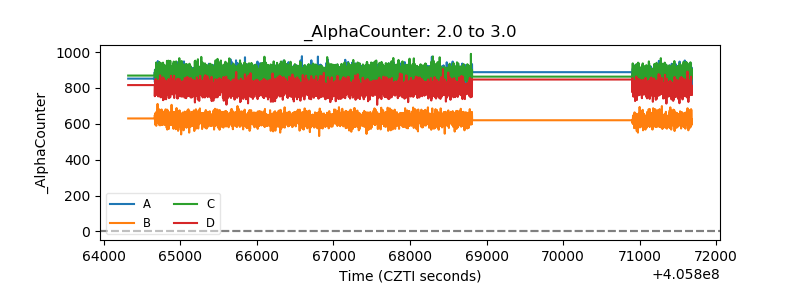 |
| _CPM_Rate | 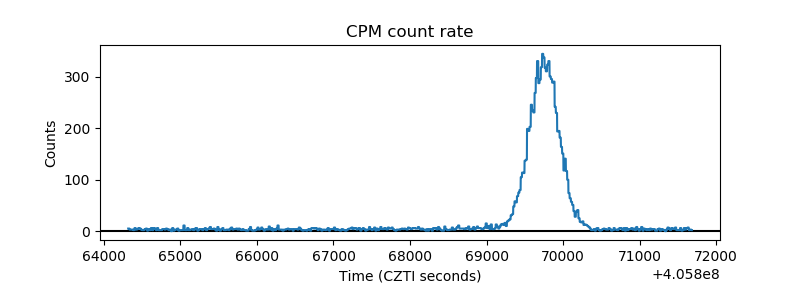 |
| CZT Counter | 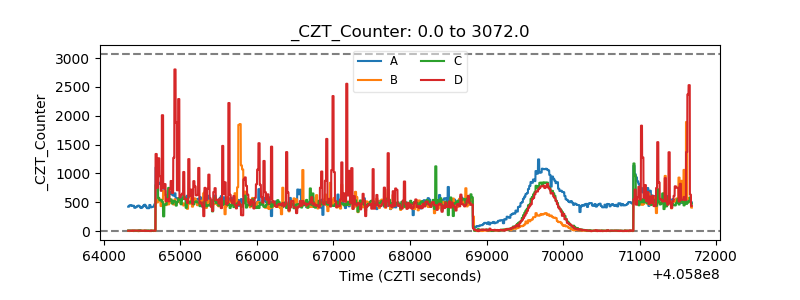 |
| +2.5 Volts monitor | 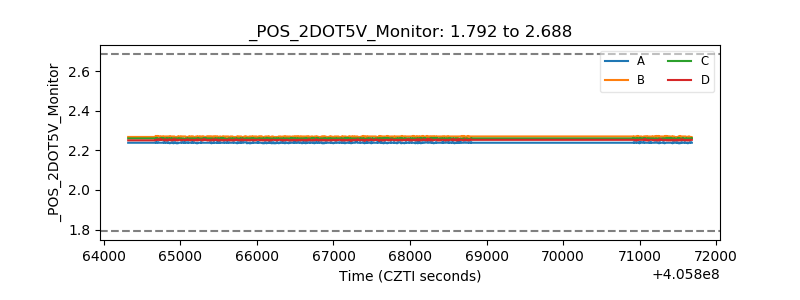 |
| +5 Volts monitor | 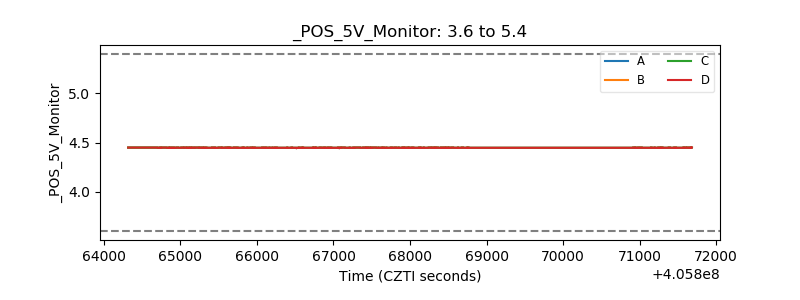 |
| _ROLL_ROT | 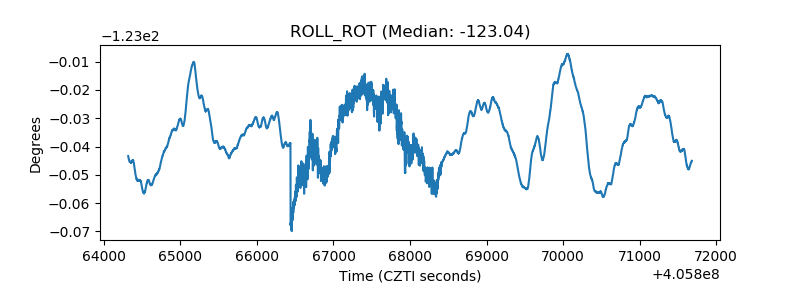 |
| _Roll_DEC | 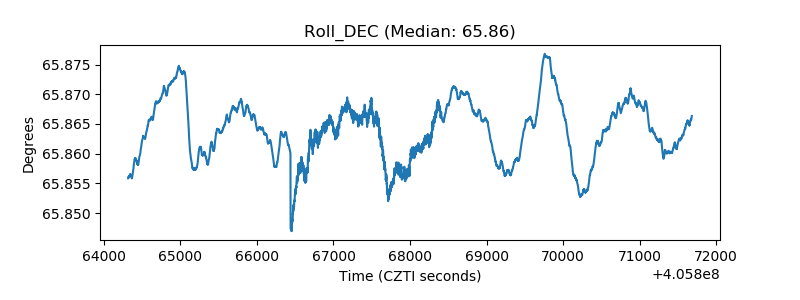 |
| _Roll_RA | 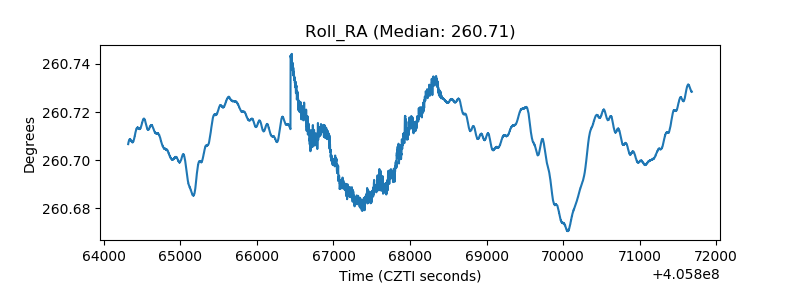 |
| Veto Counter | 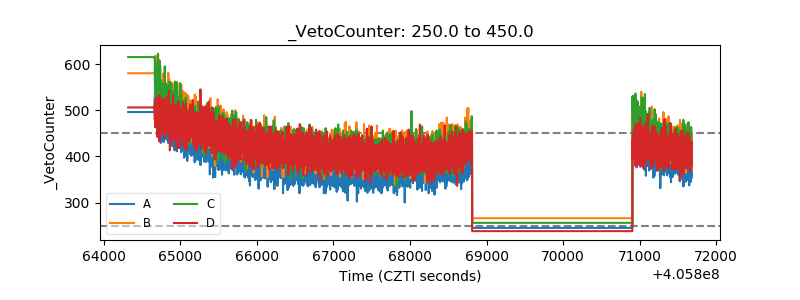 |