| Param | Original file | Final file |
|---|---|---|
| Filename | modeM0/AS1A12_018T01_9000005386_38508cztM0_level2.fits | modeM0/AS1A12_018T01_9000005386_38508cztM0_level2_quad_clean.evt |
| Size (bytes) | 367,528,320 | 90,385,920 |
| Size | 350.5 MB | 86.2 MB |
| Events in quadrant A | 2,816,251 | 630,782 |
| Events in quadrant B | 2,687,794 | 638,814 |
| Events in quadrant C | 2,648,463 | 599,824 |
| Events in quadrant D | 5,036,394 | 493,438 |
| Mode SS | |||
|---|---|---|---|
| Quadrant | BADHDUFLAG | Total packets | Discarded packets |
| A | 0 | 110 | 0 |
| B | 0 | 110 | 0 |
| C | 0 | 110 | 0 |
| D | 0 | 110 | 0 |
| Mode M9 | |||
|---|---|---|---|
| Quadrant | BADHDUFLAG | Total packets | Discarded packets |
| A | 0 | 26 | 0 |
| B | 0 | 26 | 0 |
| C | 0 | 26 | 0 |
| D | 0 | 27 | 0 |
| Mode M0 | |||
|---|---|---|---|
| Quadrant | BADHDUFLAG | Total packets | Discarded packets |
| A | 0 | 11584 | 3 |
| B | 0 | 11511 | 2 |
| C | 0 | 11136 | 2 |
| D | 0 | 18540 | 2 |
| Quadrant | Total seconds | Saturated seconds | Saturation percentage |
|---|---|---|---|
| A | 5338 | 11 | 0.206070% |
| B | 5338 | 35 | 0.655676% |
| C | 5338 | 14 | 0.262271% |
| D | 5338 | 761 | 14.256276% |
Noise dominated data is calculated using 1-second bins in cleaned event files. If a bin has >2000 counts, and if more than 50% of those come from <1% of pixels, then it is considered to be noise-dominated and hence unusable.
| Quadrant | # 1 sec bins | Bins with >0 counts | Bins with >2000 counts | High rate bins dominated by noise | Noise dominated (total time) | Noise dominated (detector-on time) | Marked lightcurve |
|---|---|---|---|---|---|---|---|
| A | 7251 | 5339 | 5 | 5 | 0.07% | 0.09% | 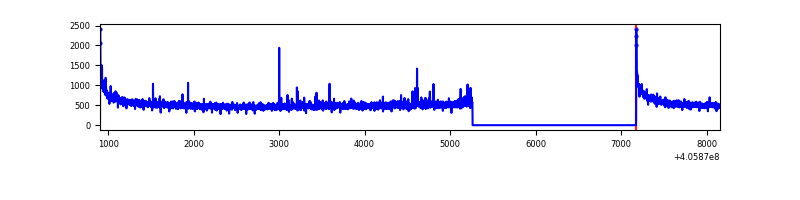 |
| B | 7251 | 5339 | 19 | 19 | 0.26% | 0.36% | 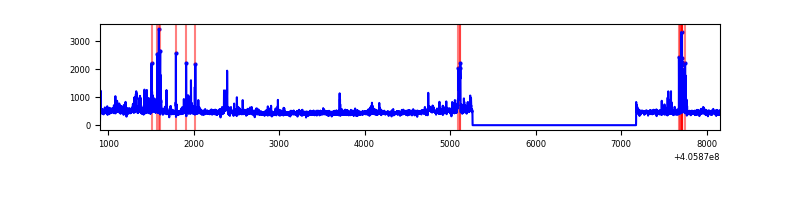 |
| C | 7251 | 5339 | 16 | 16 | 0.22% | 0.30% | 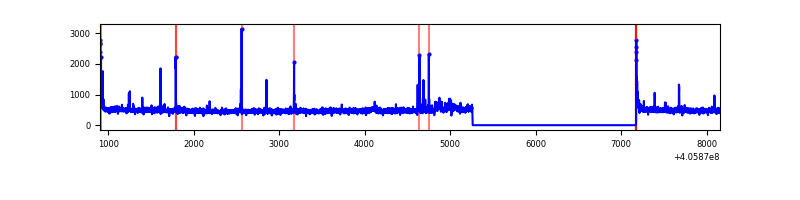 |
| D | 7251 | 5339 | 716 | 716 | 9.87% | 13.41% | 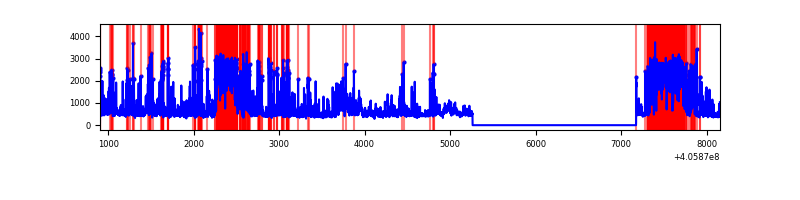 |
Top three noisy pixels from each quadrant. If the there are fewer than three noisy pixels in the level2.evt file, extra rows are filled as -1
| Pixel properties | Quadrant properties | ||||||
|---|---|---|---|---|---|---|---|
| Quadrant | DetID | PixID | Counts | Sigma | Mean | Median | Sigma |
| A | 10 | 83 | 410433 | 3413.1 | 597 | 586 | 120.1 |
| A | 12 | 189 | 37894 | 310.69 | 597 | 586 | 120.1 |
| A | 13 | 248 | 23812 | 193.42 | 597 | 586 | 120.1 |
| B | 8 | 3 | 126695 | 1130.11 | 592 | 577 | 111.6 |
| B | 0 | 183 | 97379 | 867.42 | 592 | 577 | 111.6 |
| B | 0 | 213 | 46130 | 408.19 | 592 | 577 | 111.6 |
| C | 15 | 214 | 225685 | 1666.97 | 582 | 586 | 135.0 |
| C | 0 | 10 | 49576 | 362.79 | 582 | 586 | 135.0 |
| C | 14 | 254 | 47690 | 348.83 | 582 | 586 | 135.0 |
| D | 12 | 233 | 1718493 | 12649.28 | 555 | 538 | 135.8 |
| D | 13 | 249 | 453271 | 3333.47 | 555 | 538 | 135.8 |
| D | 12 | 235 | 351600 | 2584.87 | 555 | 538 | 135.8 |
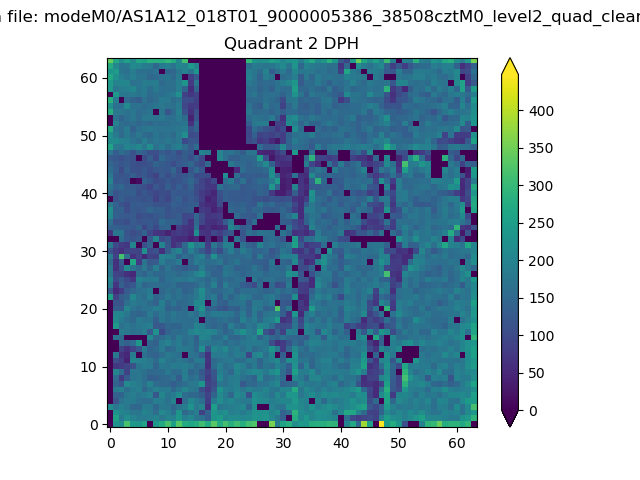
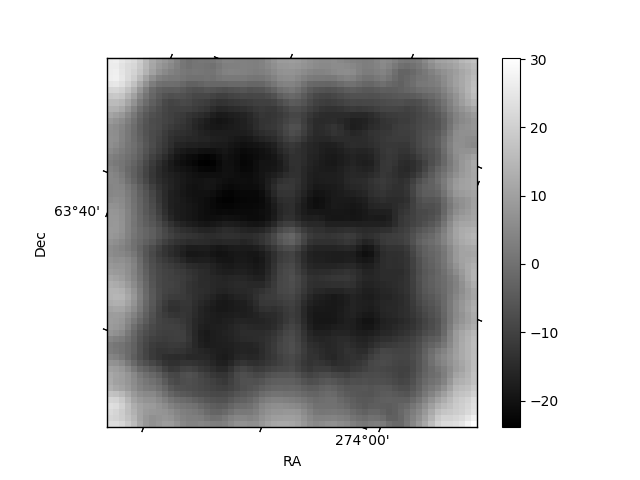
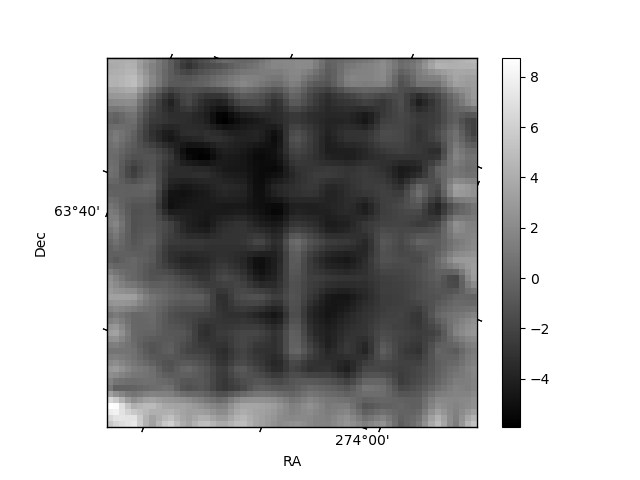
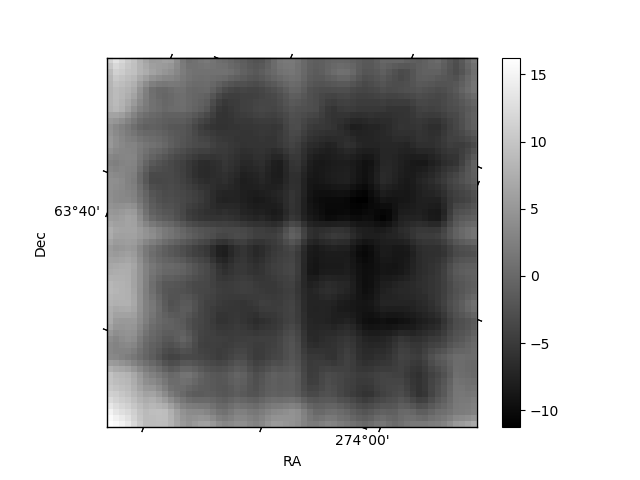
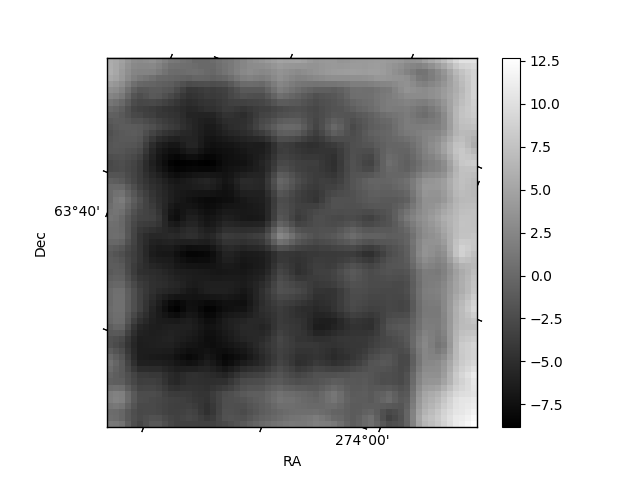
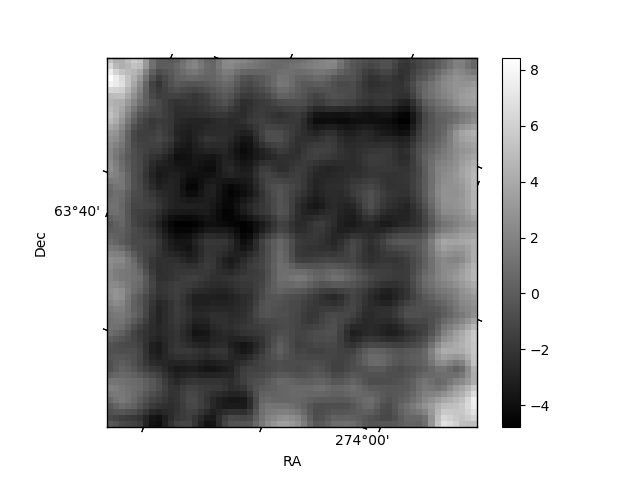
Histogram calculated using DETX and DETY for each event in the final _common_clean file
| Quadrant A | 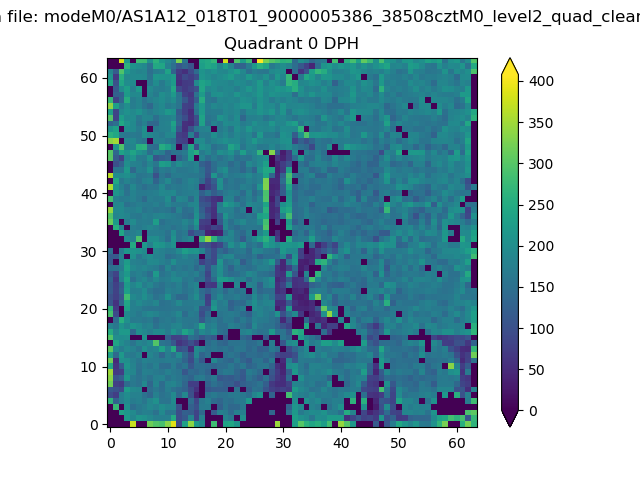 |
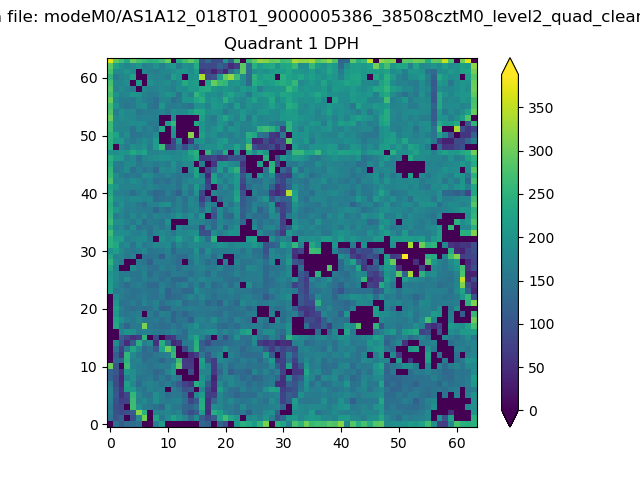 |
Quadrant B |
|---|---|---|---|
| Quadrant D | 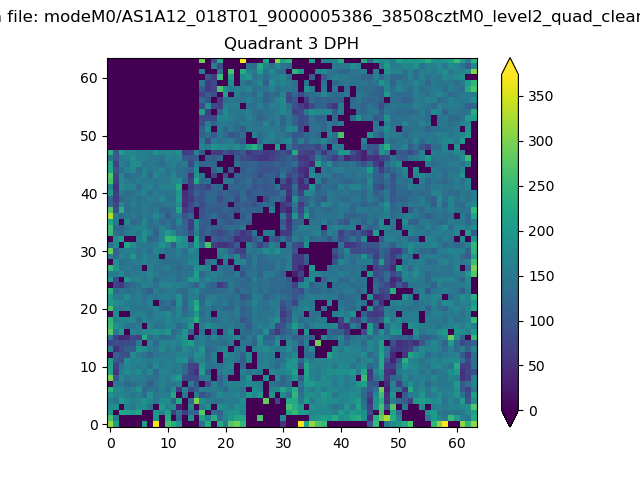 |
 |
Quadrant C |
| Plot type | Count rate plots | Images |
|---|---|---|
| Comparison with Poisson distribution Blue bars denote a histogram of data divided into 1 sec bins. Red curve is a Poisson curve with rate = median count rate of data. |
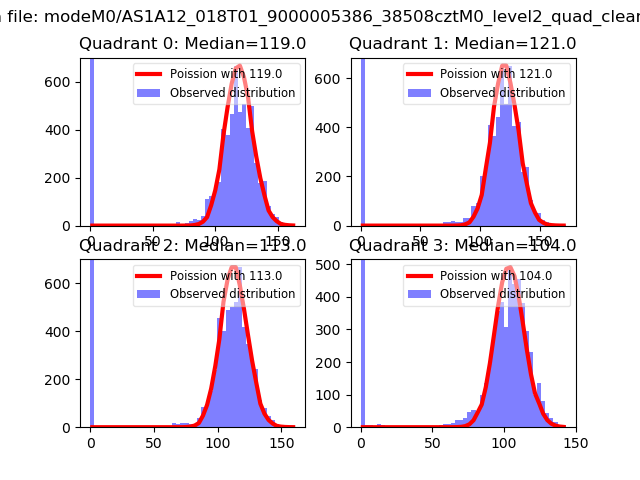 |
 |
| Quadrant-wise count rates Data is divided into 100 sec bins |
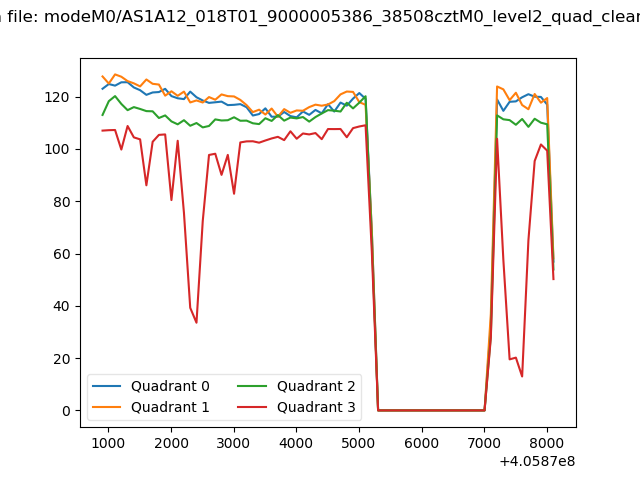 |
|
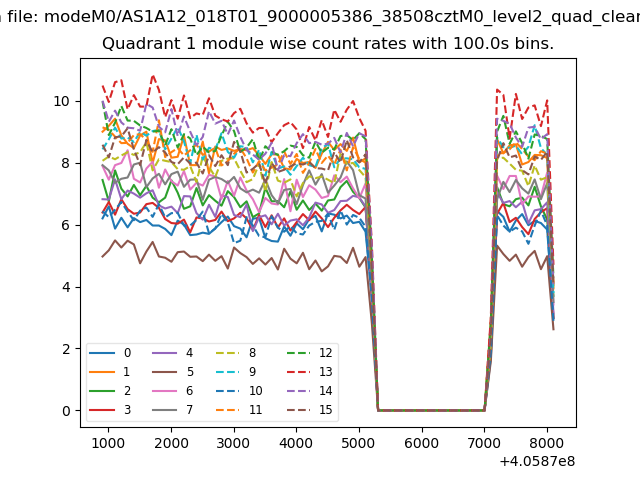
| Module-wise count rates for Quadrant A Data is divided into 100 sec bins |
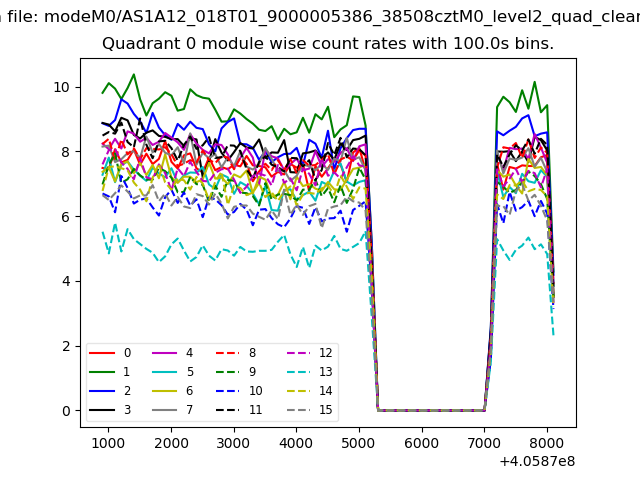 |
 |
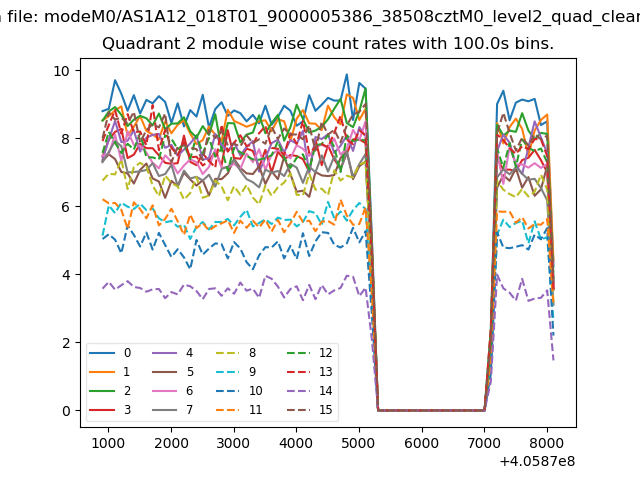
| Module-wise count rates for Quadrant B Data is divided into 100 sec bins |
 |
 |
| Module-wise count rates for Quadrant C Data is divided into 100 sec bins |
 |
 |
| Module-wise count rates for Quadrant D Data is divided into 100 sec bins |
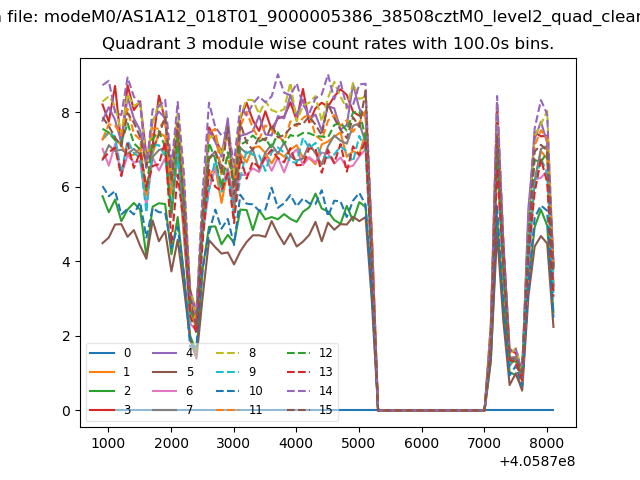 |
 |
| Parameter | Plot |
|---|---|
| CZT HV Monitor | 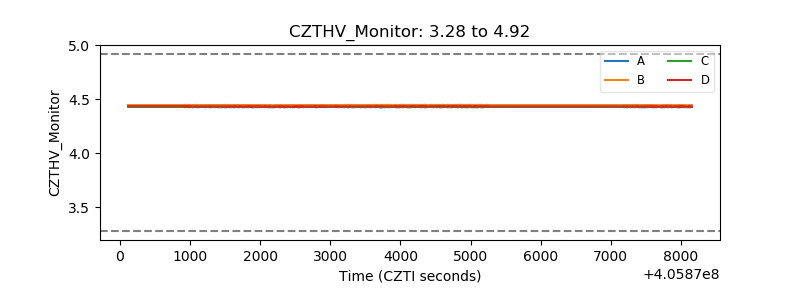 |
| D_VDD | 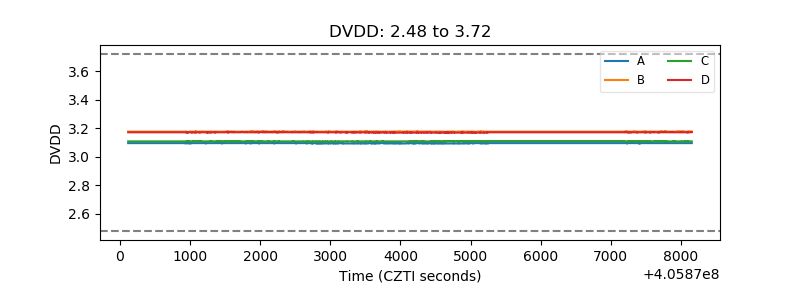 |
| Temperature 1 | 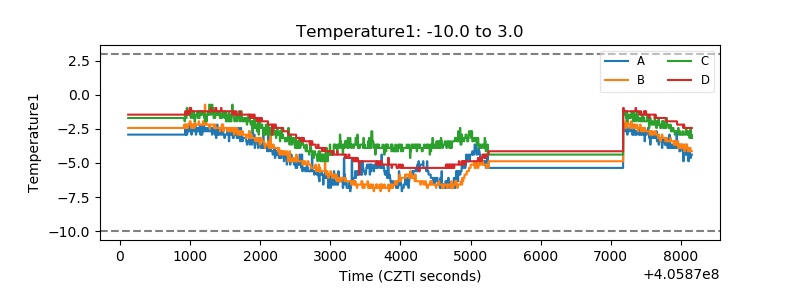 |
| Veto HV Monitor | 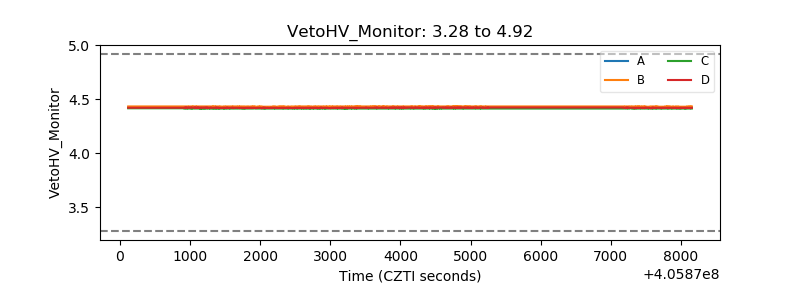 |
| Veto LLD | 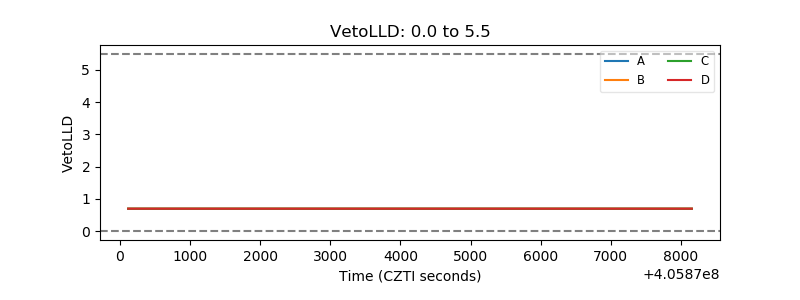 |
| Alpha Counter | 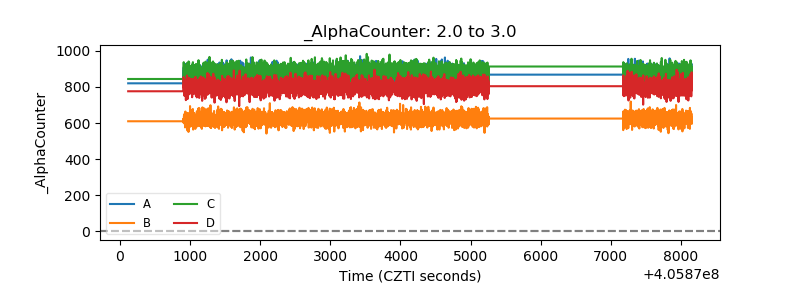 |
| _CPM_Rate | 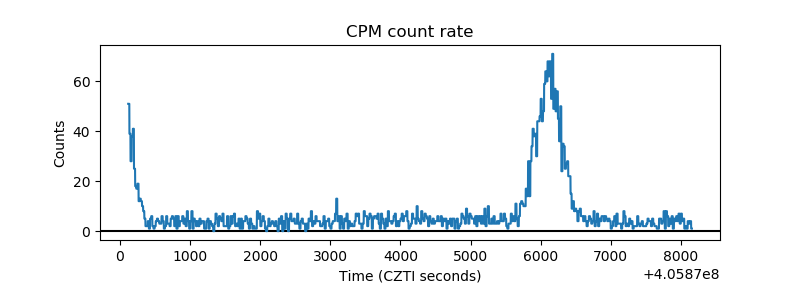 |
| CZT Counter | 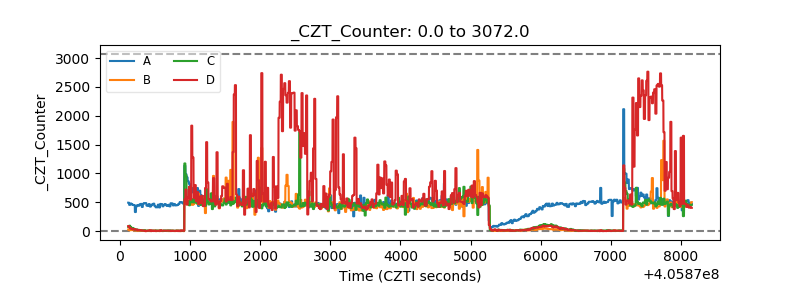 |
| +2.5 Volts monitor | 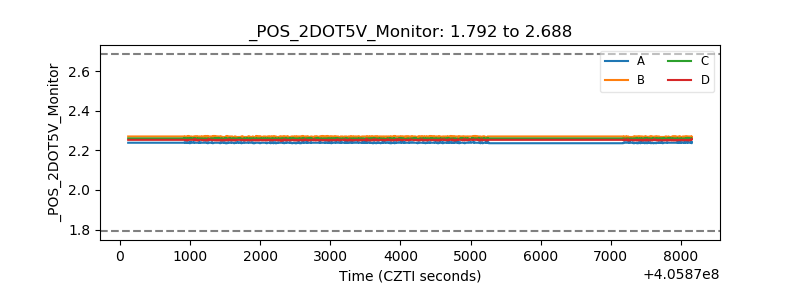 |
| +5 Volts monitor | 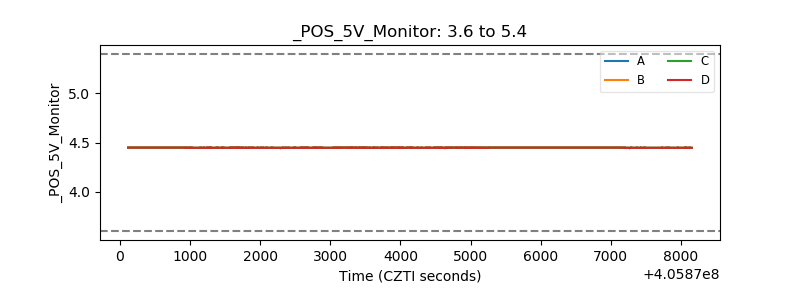 |
| _ROLL_ROT | 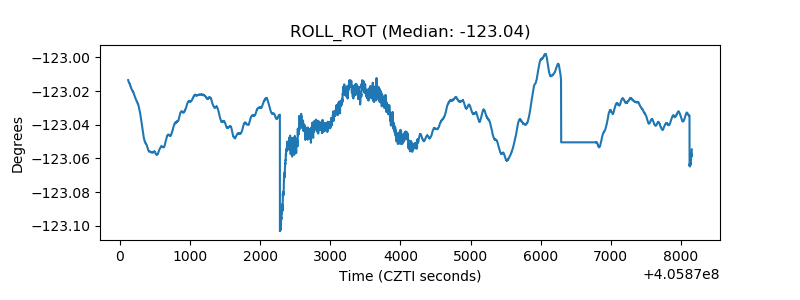 |
| _Roll_DEC | 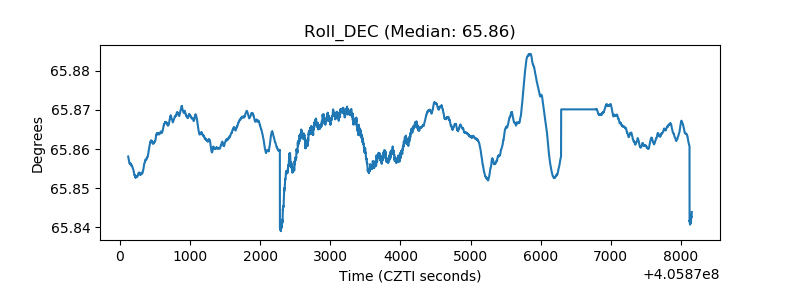 |
| _Roll_RA | 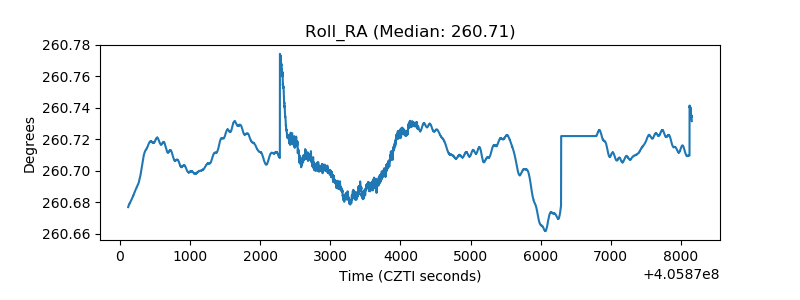 |
| Veto Counter | 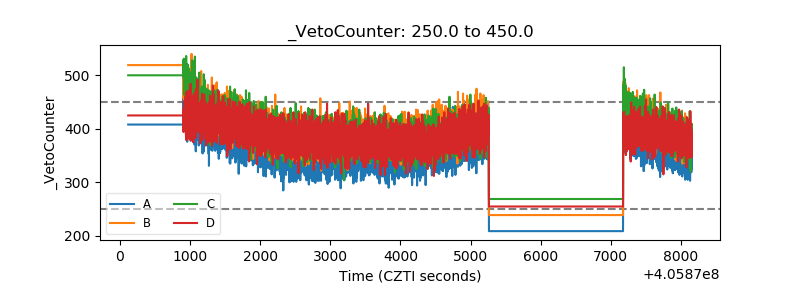 |