| Param | Original file | Final file |
|---|---|---|
| Filename | modeM0/AS1A12_018T01_9000005386_38509cztM0_level2.fits | modeM0/AS1A12_018T01_9000005386_38509cztM0_level2_quad_clean.evt |
| Size (bytes) | 347,604,480 | 94,953,600 |
| Size | 331.5 MB | 90.6 MB |
| Events in quadrant A | 2,924,883 | 654,598 |
| Events in quadrant B | 2,715,712 | 662,239 |
| Events in quadrant C | 2,743,636 | 624,855 |
| Events in quadrant D | 4,040,041 | 535,861 |
| Mode SS | |||
|---|---|---|---|
| Quadrant | BADHDUFLAG | Total packets | Discarded packets |
| A | 0 | 116 | 0 |
| B | 0 | 116 | 0 |
| C | 0 | 116 | 0 |
| D | 0 | 116 | 0 |
| Mode M9 | |||
|---|---|---|---|
| Quadrant | BADHDUFLAG | Total packets | Discarded packets |
| A | 0 | 19 | 0 |
| B | 0 | 19 | 0 |
| C | 0 | 19 | 0 |
| D | 0 | 20 | 0 |
| Mode M0 | |||
|---|---|---|---|
| Quadrant | BADHDUFLAG | Total packets | Discarded packets |
| A | 0 | 12144 | 3 |
| B | 0 | 11948 | 2 |
| C | 0 | 11647 | 2 |
| D | 0 | 15928 | 2 |
| Quadrant | Total seconds | Saturated seconds | Saturation percentage |
|---|---|---|---|
| A | 5685 | 13 | 0.228672% |
| B | 5685 | 25 | 0.439754% |
| C | 5685 | 14 | 0.246262% |
| D | 5685 | 472 | 8.302551% |
Noise dominated data is calculated using 1-second bins in cleaned event files. If a bin has >2000 counts, and if more than 50% of those come from <1% of pixels, then it is considered to be noise-dominated and hence unusable.
| Quadrant | # 1 sec bins | Bins with >0 counts | Bins with >2000 counts | High rate bins dominated by noise | Noise dominated (total time) | Noise dominated (detector-on time) | Marked lightcurve |
|---|---|---|---|---|---|---|---|
| A | 7268 | 5686 | 7 | 7 | 0.10% | 0.12% | 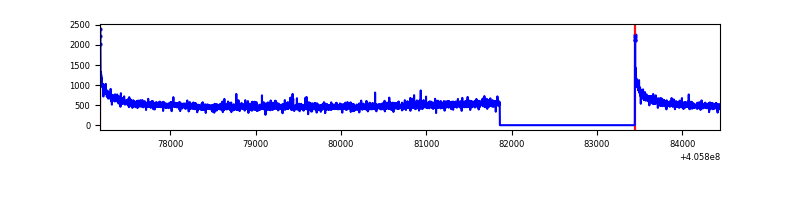 |
| B | 7268 | 5686 | 14 | 14 | 0.19% | 0.25% | 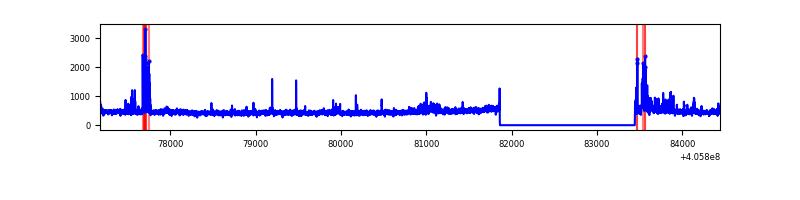 |
| C | 7268 | 5686 | 10 | 10 | 0.14% | 0.18% | 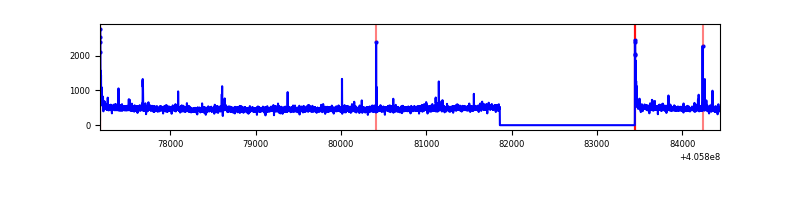 |
| D | 7268 | 5686 | 433 | 433 | 5.96% | 7.62% | 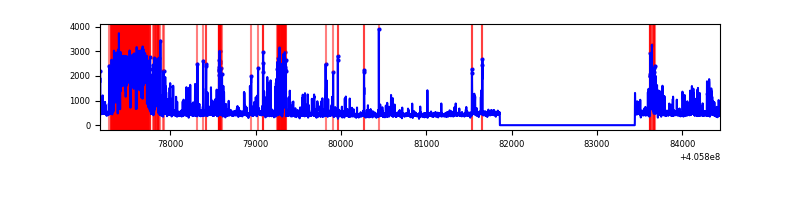 |
Top three noisy pixels from each quadrant. If the there are fewer than three noisy pixels in the level2.evt file, extra rows are filled as -1
| Pixel properties | Quadrant properties | ||||||
|---|---|---|---|---|---|---|---|
| Quadrant | DetID | PixID | Counts | Sigma | Mean | Median | Sigma |
| A | 10 | 83 | 429926 | 3356.51 | 631 | 618 | 127.9 |
| A | 12 | 189 | 29849 | 228.54 | 631 | 618 | 127.9 |
| A | 13 | 6 | 17689 | 133.47 | 631 | 618 | 127.9 |
| B | 8 | 3 | 65935 | 541.53 | 628 | 611 | 120.6 |
| B | 0 | 183 | 62060 | 509.41 | 628 | 611 | 120.6 |
| B | 0 | 213 | 47234 | 386.5 | 628 | 611 | 120.6 |
| C | 15 | 214 | 239211 | 1673.0 | 614 | 617 | 142.6 |
| C | 0 | 10 | 46969 | 325.02 | 614 | 617 | 142.6 |
| C | 14 | 254 | 34552 | 237.95 | 614 | 617 | 142.6 |
| D | 12 | 233 | 962897 | 6553.03 | 597 | 580 | 146.9 |
| D | 13 | 249 | 321166 | 2183.07 | 597 | 580 | 146.9 |
| D | 12 | 235 | 306859 | 2085.65 | 597 | 580 | 146.9 |
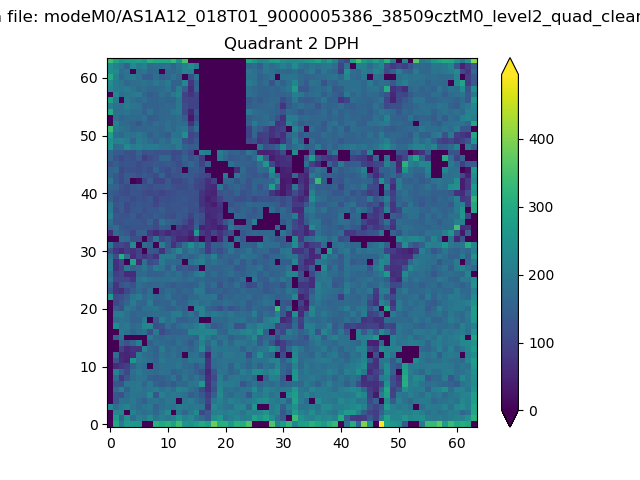
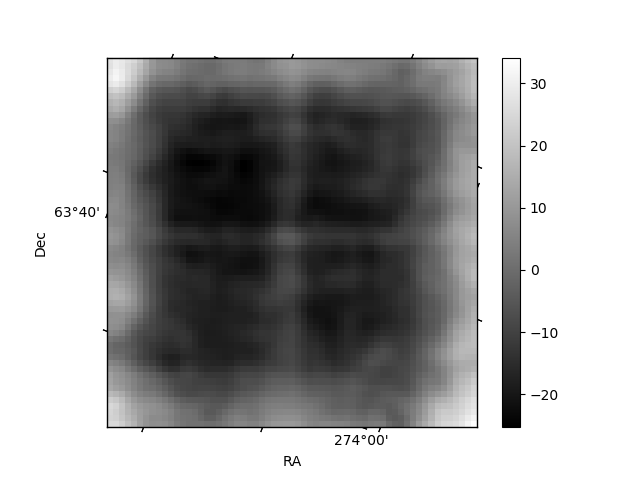
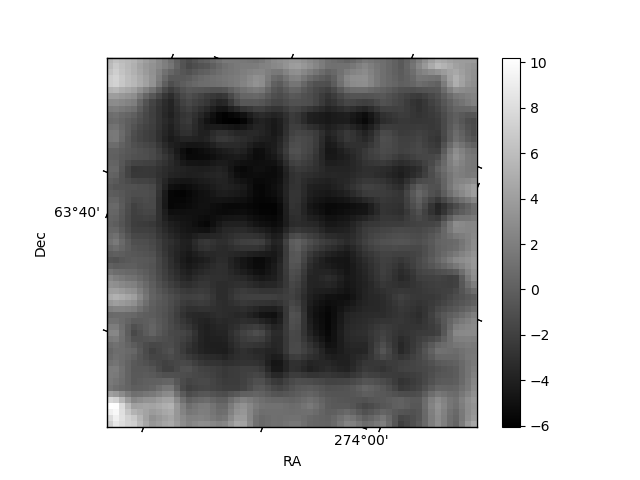
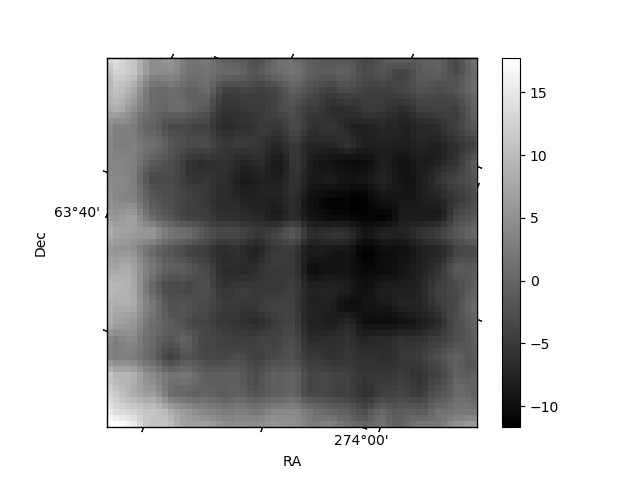
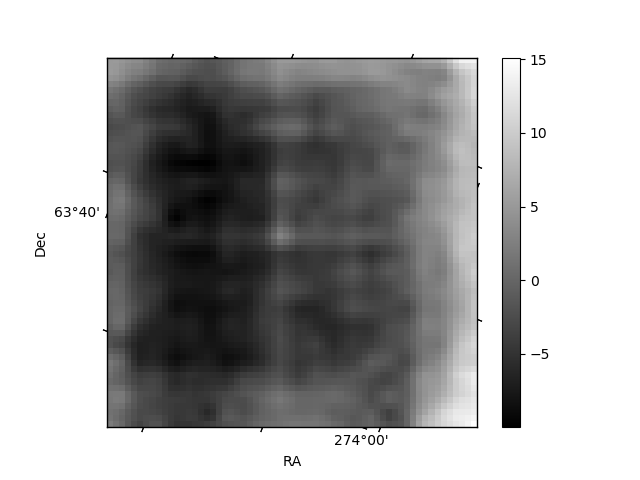
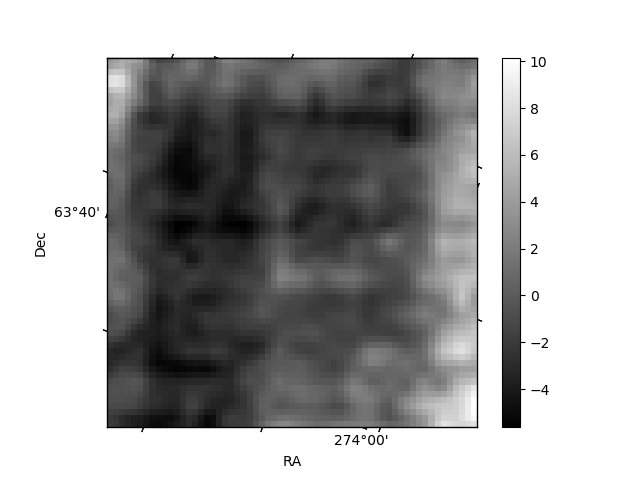
Histogram calculated using DETX and DETY for each event in the final _common_clean file
| Quadrant A | 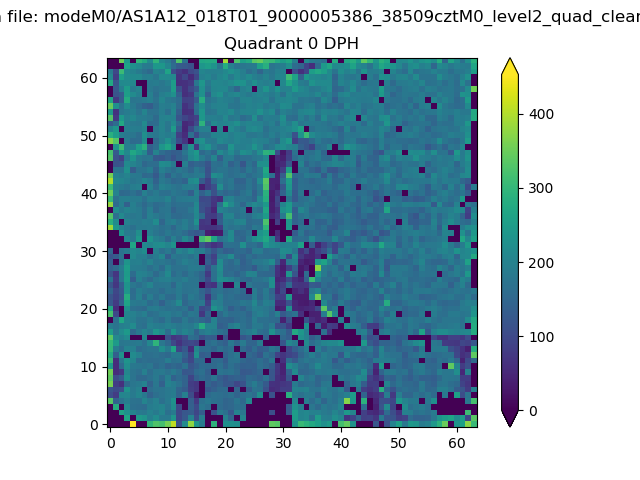 |
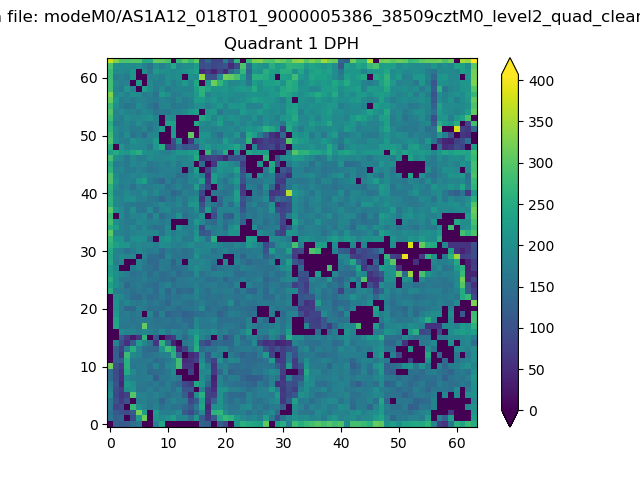 |
Quadrant B |
|---|---|---|---|
| Quadrant D | 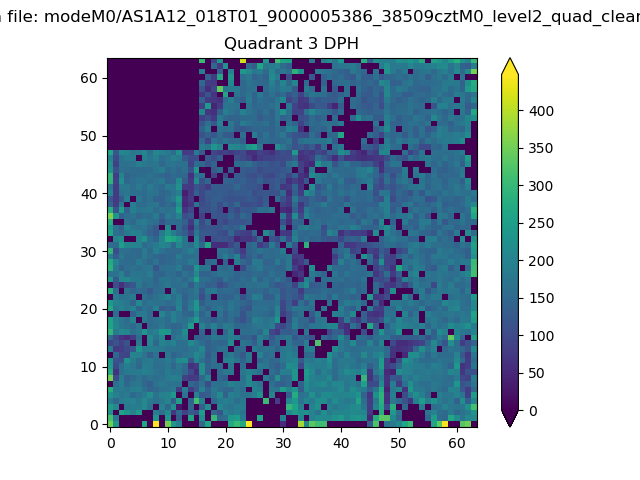 |
 |
Quadrant C |
| Plot type | Count rate plots | Images |
|---|---|---|
| Comparison with Poisson distribution Blue bars denote a histogram of data divided into 1 sec bins. Red curve is a Poisson curve with rate = median count rate of data. |
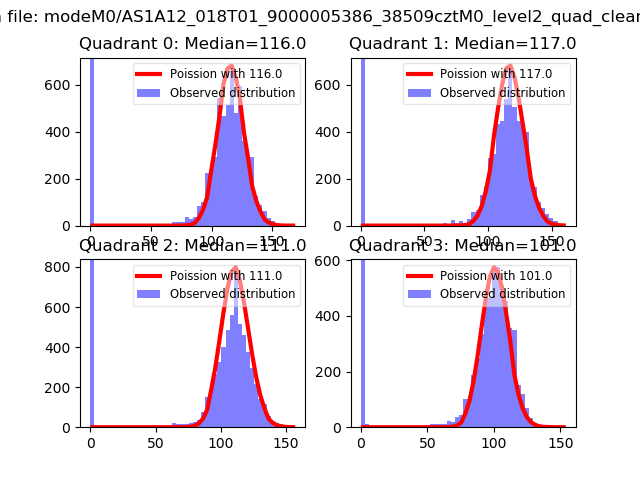 |
 |
| Quadrant-wise count rates Data is divided into 100 sec bins |
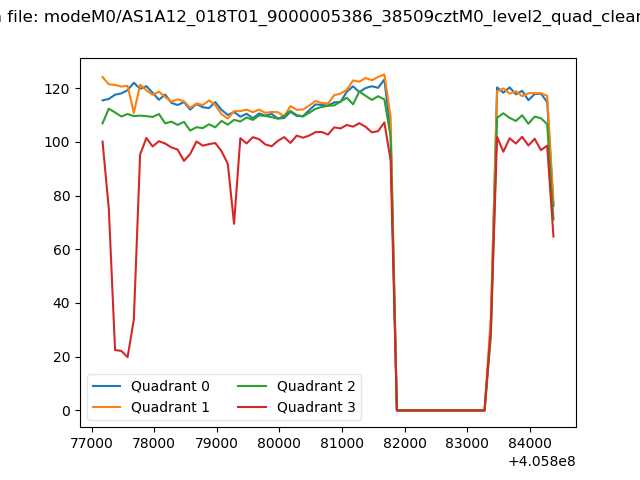 |
|
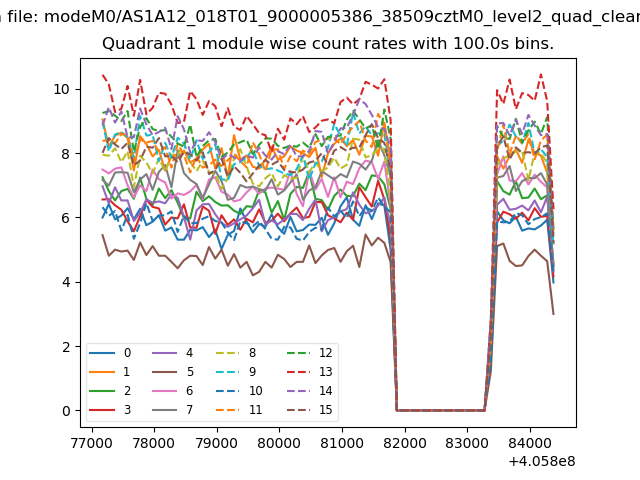
| Module-wise count rates for Quadrant A Data is divided into 100 sec bins |
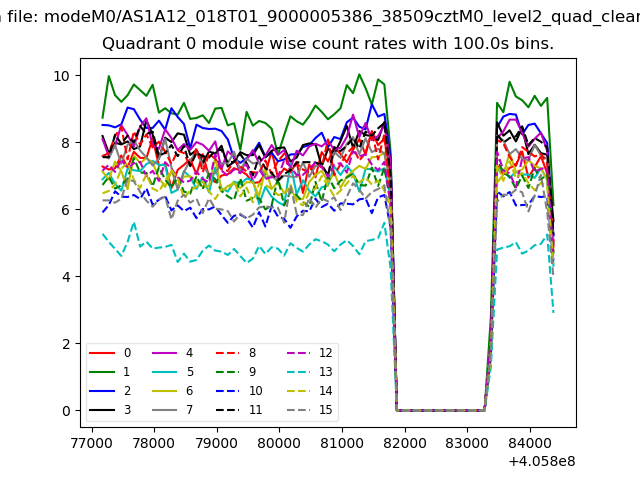 |
 |
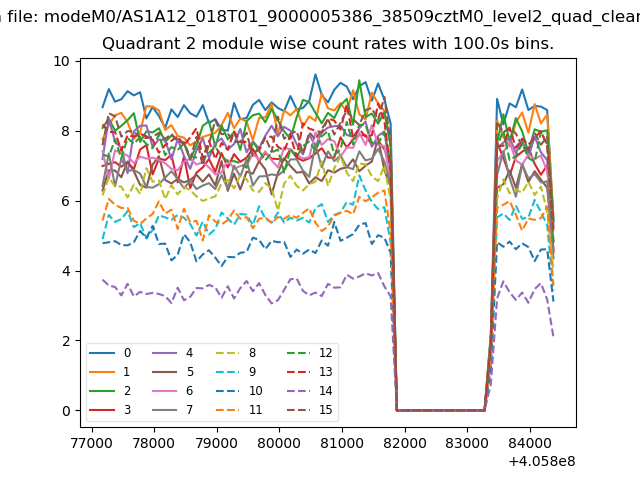
| Module-wise count rates for Quadrant B Data is divided into 100 sec bins |
 |
 |
| Module-wise count rates for Quadrant C Data is divided into 100 sec bins |
 |
 |
| Module-wise count rates for Quadrant D Data is divided into 100 sec bins |
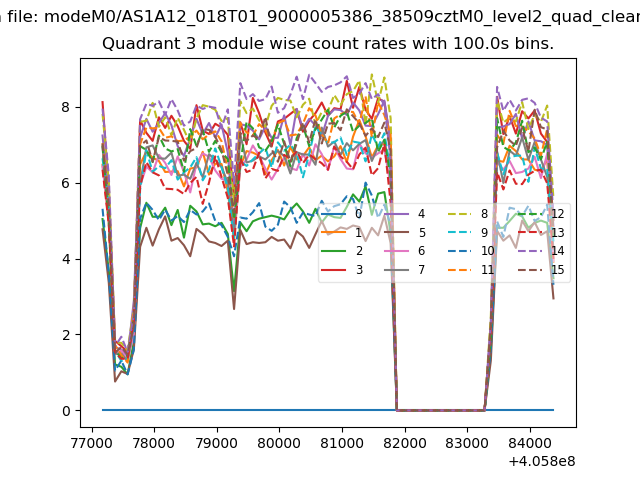 |
 |
| Parameter | Plot |
|---|---|
| CZT HV Monitor | 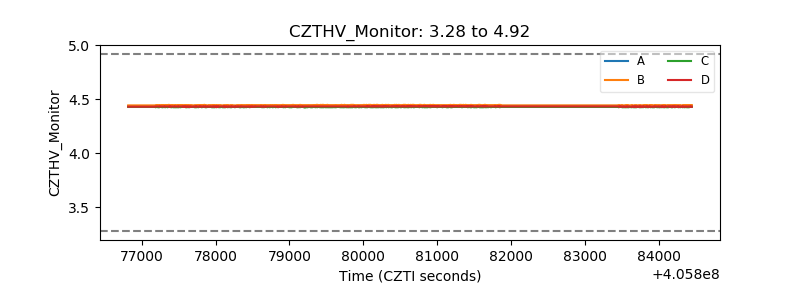 |
| D_VDD | 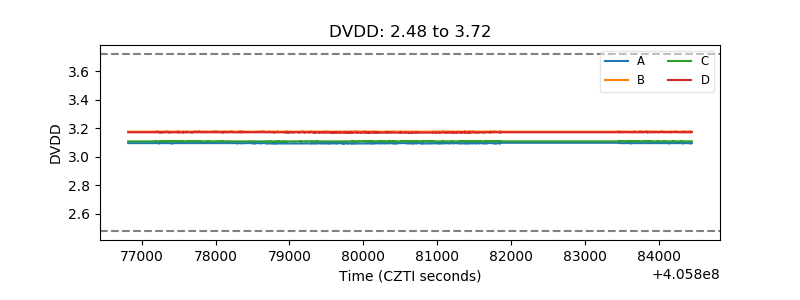 |
| Temperature 1 | 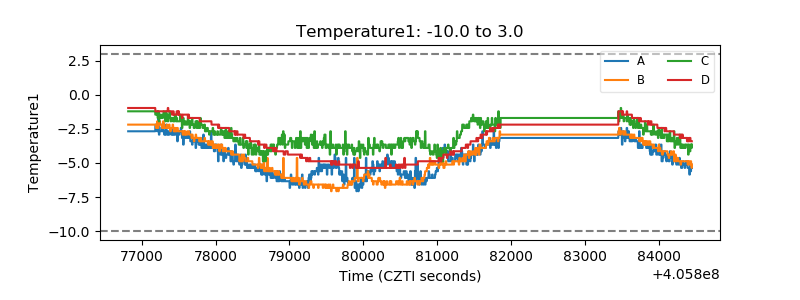 |
| Veto HV Monitor | 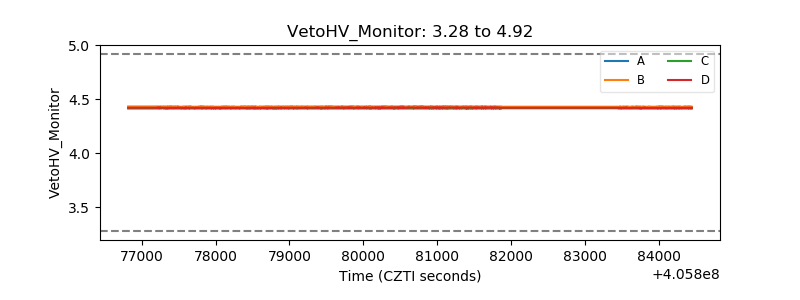 |
| Veto LLD | 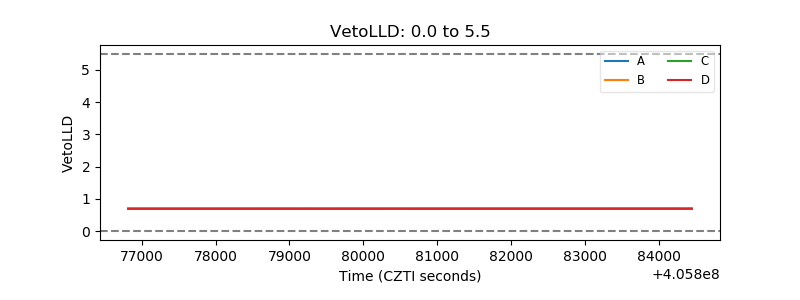 |
| Alpha Counter | 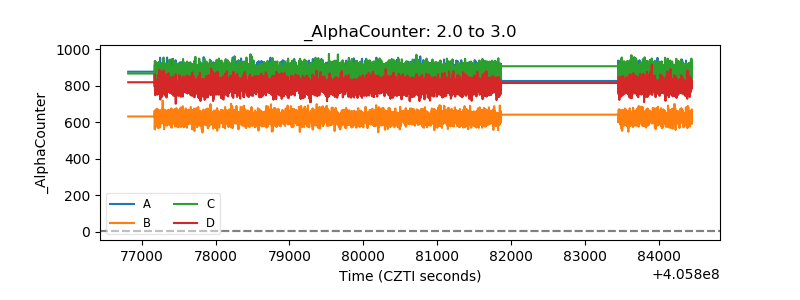 |
| _CPM_Rate | 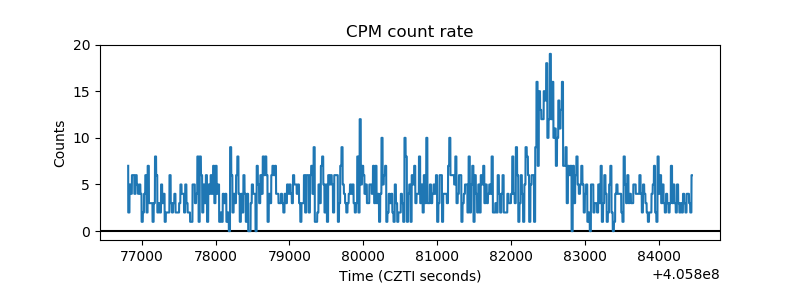 |
| CZT Counter | 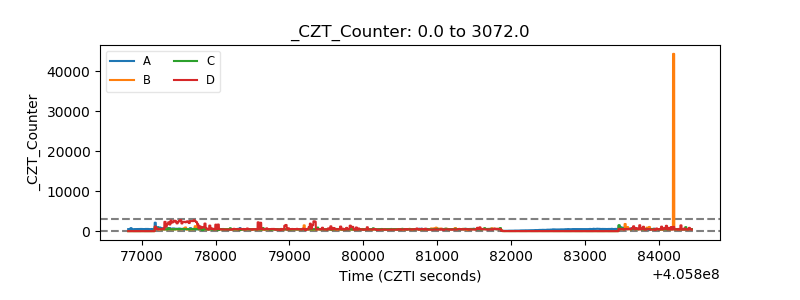 |
| +2.5 Volts monitor | 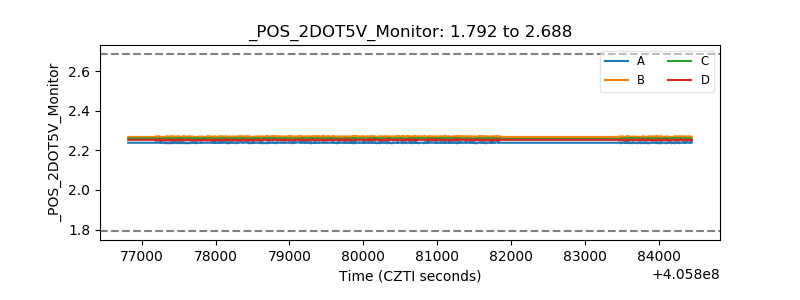 |
| +5 Volts monitor | 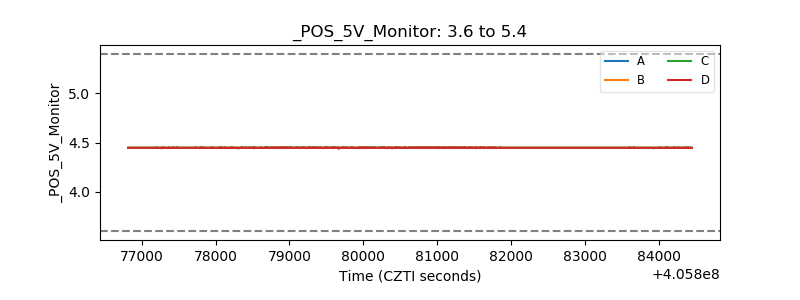 |
| _ROLL_ROT | 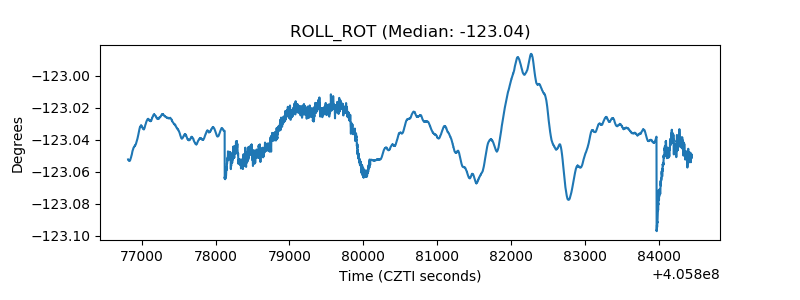 |
| _Roll_DEC | 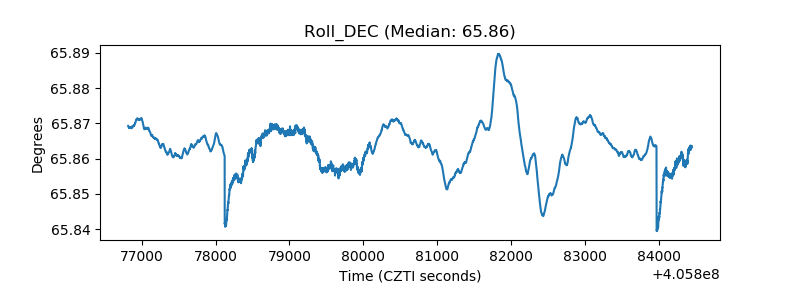 |
| _Roll_RA | 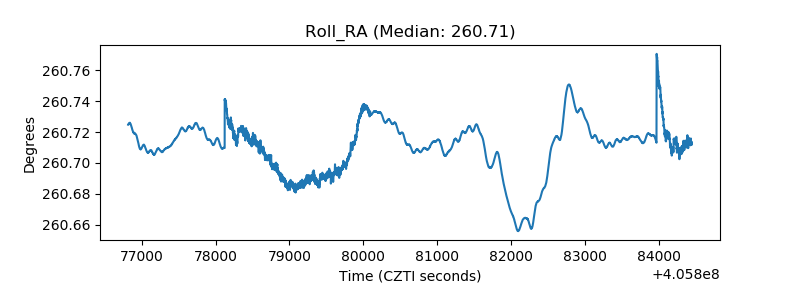 |
| Veto Counter | 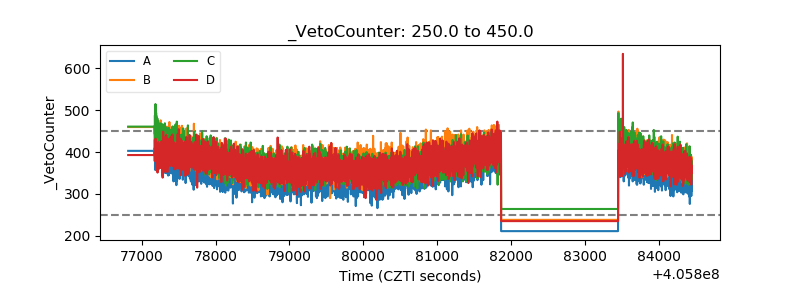 |