| Param | Original file | Final file |
|---|---|---|
| Filename | modeM0/AS1A12_018T01_9000005386_38511cztM0_level2.fits | modeM0/AS1A12_018T01_9000005386_38511cztM0_level2_quad_clean.evt |
| Size (bytes) | 459,046,080 | 96,255,360 |
| Size | 437.8 MB | 91.8 MB |
| Events in quadrant A | 3,287,584 | 670,434 |
| Events in quadrant B | 6,346,222 | 591,112 |
| Events in quadrant C | 2,854,963 | 653,906 |
| Events in quadrant D | 4,034,718 | 577,155 |
| Mode SS | |||
|---|---|---|---|
| Quadrant | BADHDUFLAG | Total packets | Discarded packets |
| A | 0 | 124 | 0 |
| B | 0 | 124 | 0 |
| C | 0 | 124 | 0 |
| D | 0 | 124 | 0 |
| Mode M9 | |||
|---|---|---|---|
| Quadrant | BADHDUFLAG | Total packets | Discarded packets |
| A | 0 | 18 | 0 |
| B | 0 | 18 | 0 |
| C | 0 | 18 | 0 |
| D | 0 | 19 | 0 |
| Mode M0 | |||
|---|---|---|---|
| Quadrant | BADHDUFLAG | Total packets | Discarded packets |
| A | 0 | 13479 | 3 |
| B | 0 | 23014 | 2 |
| C | 0 | 12254 | 2 |
| D | 0 | 16147 | 2 |
| Quadrant | Total seconds | Saturated seconds | Saturation percentage |
|---|---|---|---|
| A | 6031 | 53 | 0.878793% |
| B | 6031 | 1010 | 16.746808% |
| C | 6031 | 10 | 0.165810% |
| D | 6031 | 359 | 5.952578% |
Noise dominated data is calculated using 1-second bins in cleaned event files. If a bin has >2000 counts, and if more than 50% of those come from <1% of pixels, then it is considered to be noise-dominated and hence unusable.
| Quadrant | # 1 sec bins | Bins with >0 counts | Bins with >2000 counts | High rate bins dominated by noise | Noise dominated (total time) | Noise dominated (detector-on time) | Marked lightcurve |
|---|---|---|---|---|---|---|---|
| A | 7314 | 6032 | 47 | 47 | 0.64% | 0.78% | 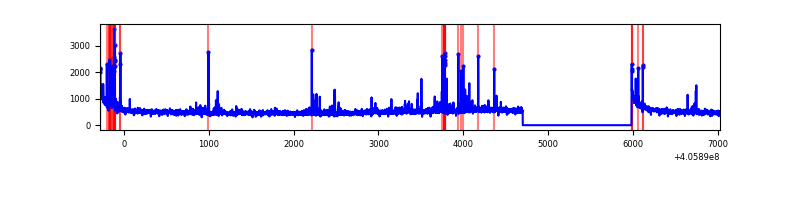 |
| B | 7314 | 6032 | 796 | 796 | 10.88% | 13.20% | 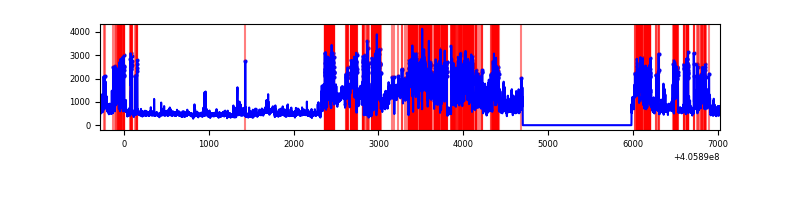 |
| C | 7314 | 6032 | 2 | 2 | 0.03% | 0.03% | 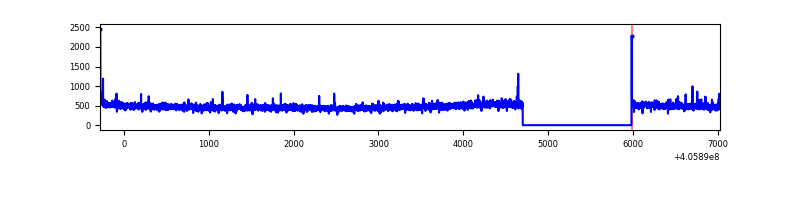 |
| D | 7314 | 6032 | 288 | 288 | 3.94% | 4.77% | 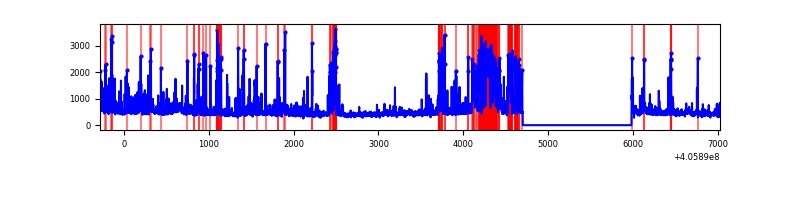 |
Top three noisy pixels from each quadrant. If the there are fewer than three noisy pixels in the level2.evt file, extra rows are filled as -1
| Pixel properties | Quadrant properties | ||||||
|---|---|---|---|---|---|---|---|
| Quadrant | DetID | PixID | Counts | Sigma | Mean | Median | Sigma |
| A | 10 | 83 | 433410 | 3185.45 | 668 | 654 | 135.9 |
| A | 9 | 143 | 177777 | 1303.78 | 668 | 654 | 135.9 |
| A | 13 | 248 | 67748 | 493.87 | 668 | 654 | 135.9 |
| B | 8 | 3 | 3480984 | 29214.96 | 626 | 609 | 119.1 |
| B | 0 | 183 | 138971 | 1161.44 | 626 | 609 | 119.1 |
| B | 5 | 200 | 99023 | 826.11 | 626 | 609 | 119.1 |
| C | 15 | 214 | 254074 | 1664.84 | 652 | 655 | 152.2 |
| C | 14 | 254 | 19883 | 126.32 | 652 | 655 | 152.2 |
| C | 0 | 10 | 19619 | 124.58 | 652 | 655 | 152.2 |
| D | 12 | 233 | 461493 | 2935.68 | 639 | 621 | 157.0 |
| D | 12 | 235 | 307172 | 1952.68 | 639 | 621 | 157.0 |
| D | 13 | 249 | 282553 | 1795.86 | 639 | 621 | 157.0 |
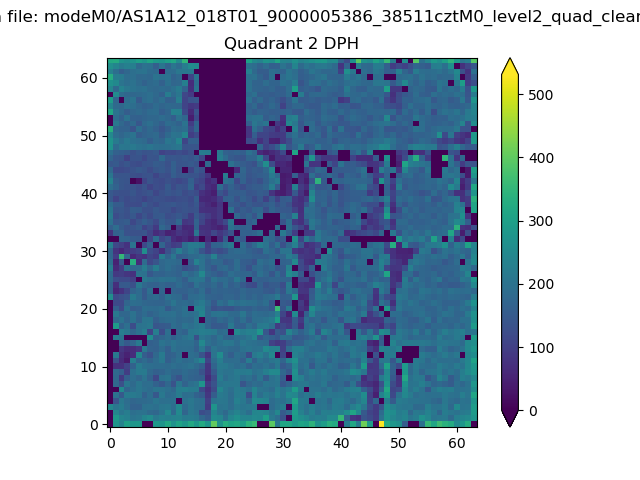
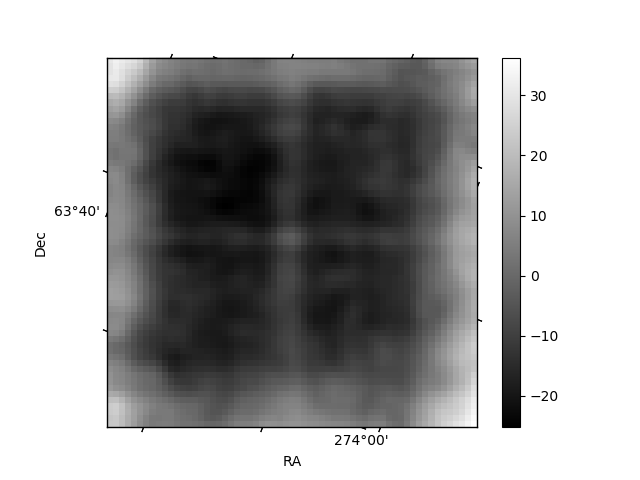
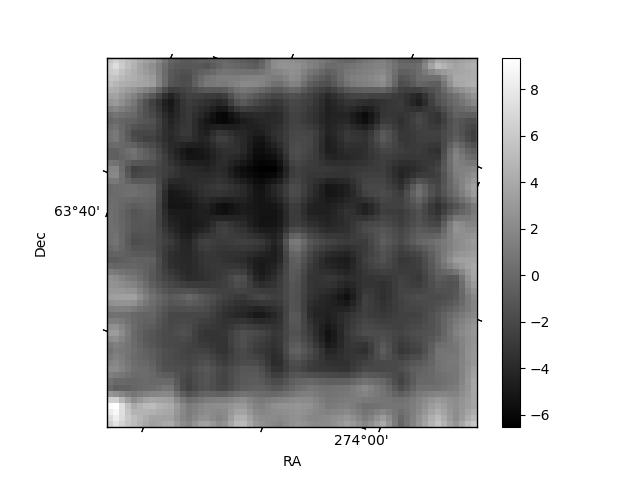
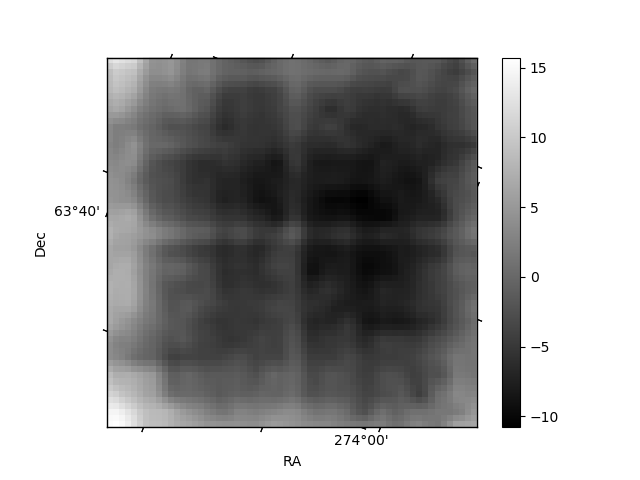
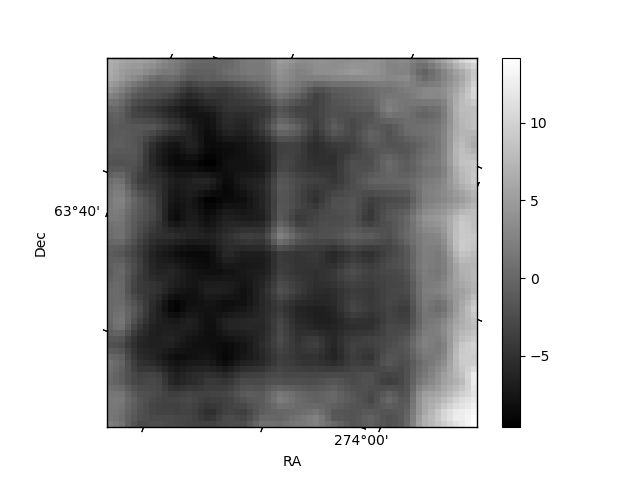
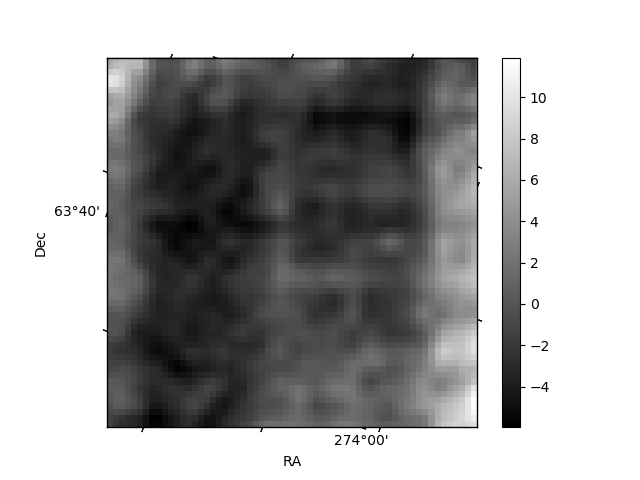
Histogram calculated using DETX and DETY for each event in the final _common_clean file
| Quadrant A | 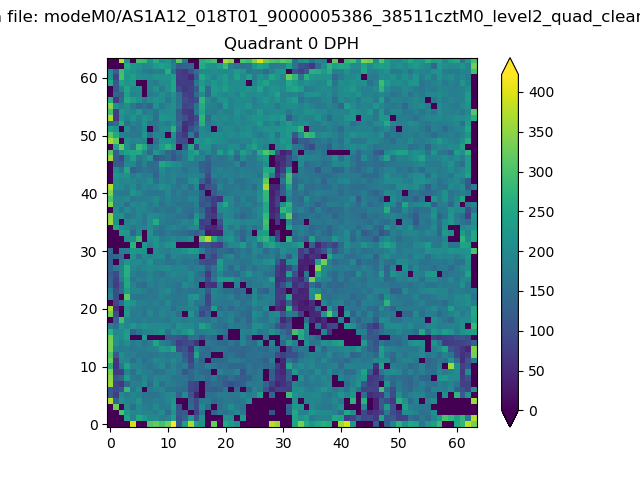 |
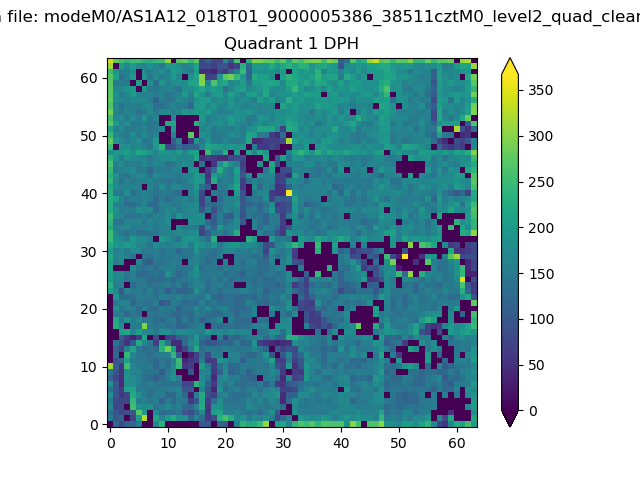 |
Quadrant B |
|---|---|---|---|
| Quadrant D | 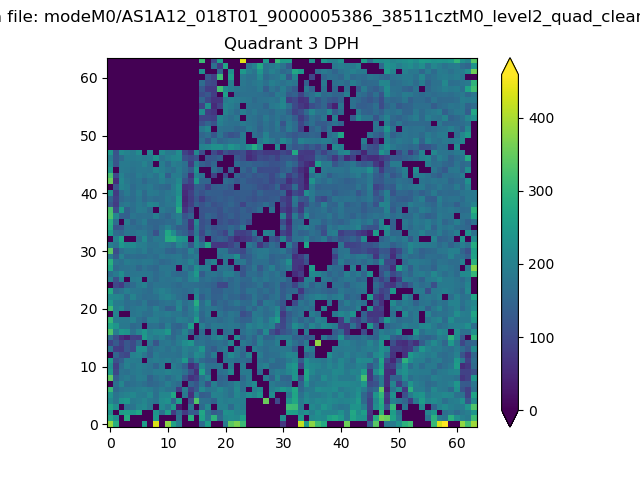 |
 |
Quadrant C |
| Plot type | Count rate plots | Images |
|---|---|---|
| Comparison with Poisson distribution Blue bars denote a histogram of data divided into 1 sec bins. Red curve is a Poisson curve with rate = median count rate of data. |
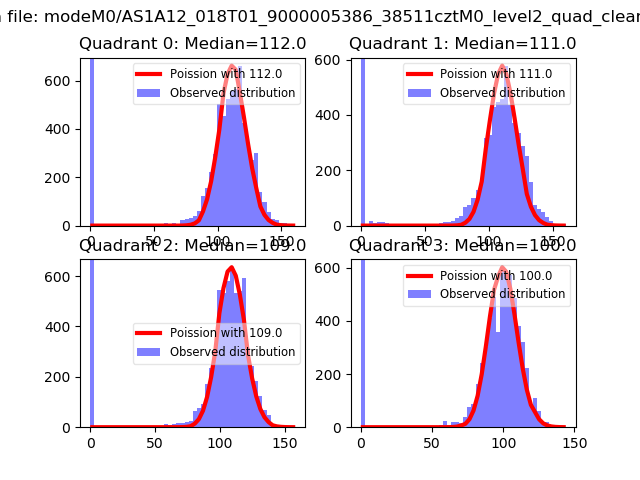 |
 |
| Quadrant-wise count rates Data is divided into 100 sec bins |
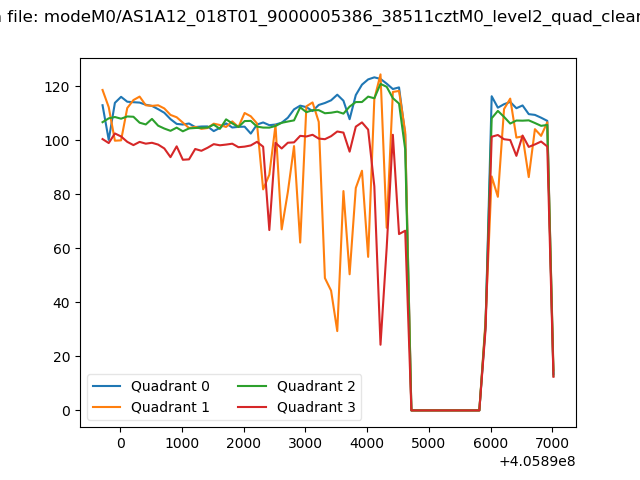 |
|
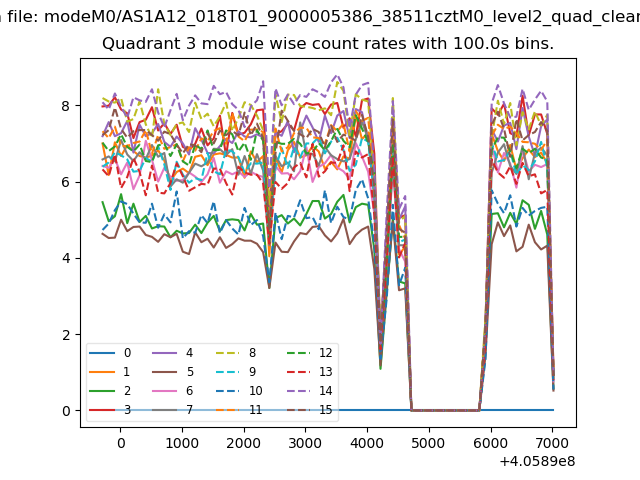
| Module-wise count rates for Quadrant A Data is divided into 100 sec bins |
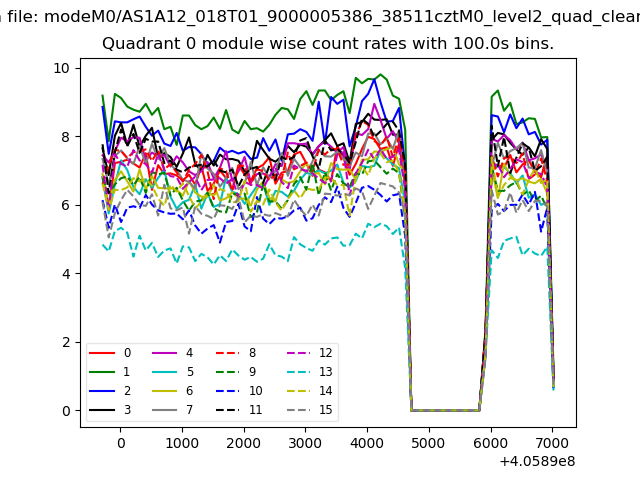 |
 |
| Module-wise count rates for Quadrant B Data is divided into 100 sec bins |
 |
 |
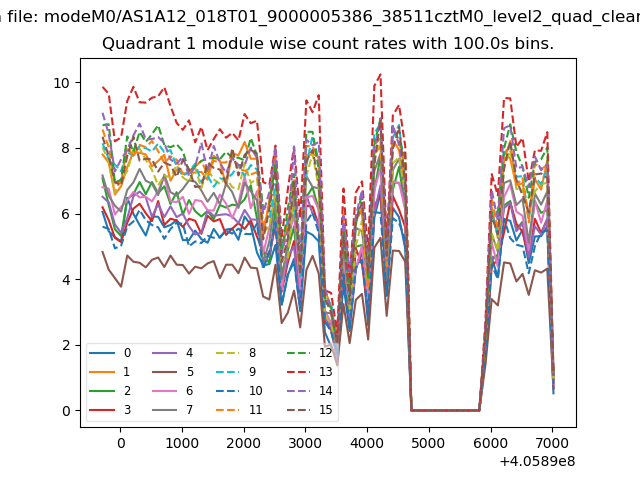
| Module-wise count rates for Quadrant C Data is divided into 100 sec bins |
 |
 |
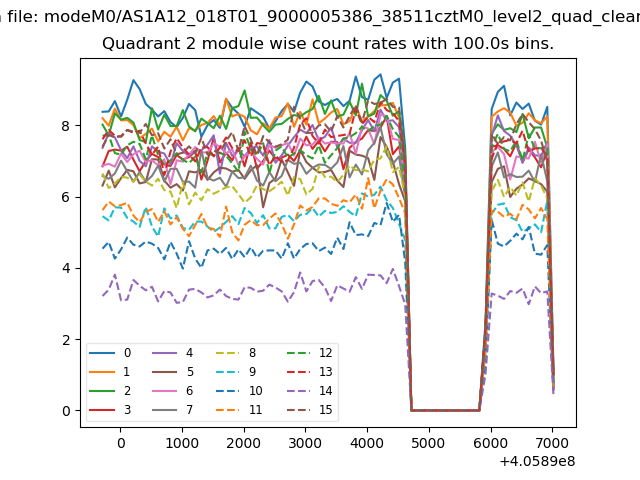
| Module-wise count rates for Quadrant D Data is divided into 100 sec bins |
 |
 |
| Parameter | Plot |
|---|---|
| CZT HV Monitor | 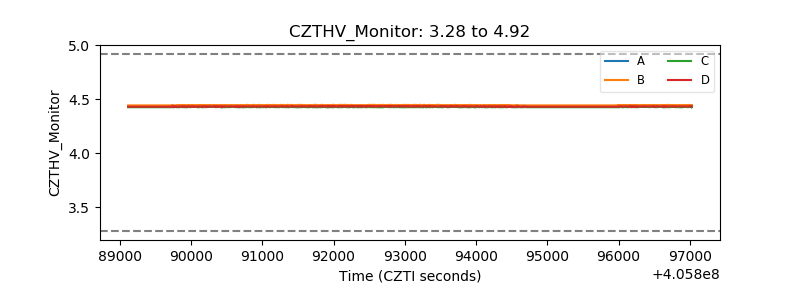 |
| D_VDD | 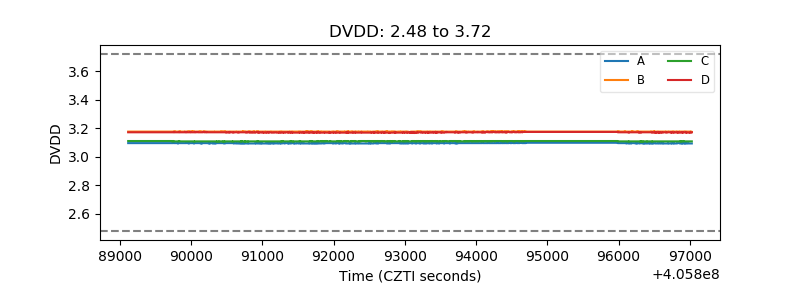 |
| Temperature 1 | 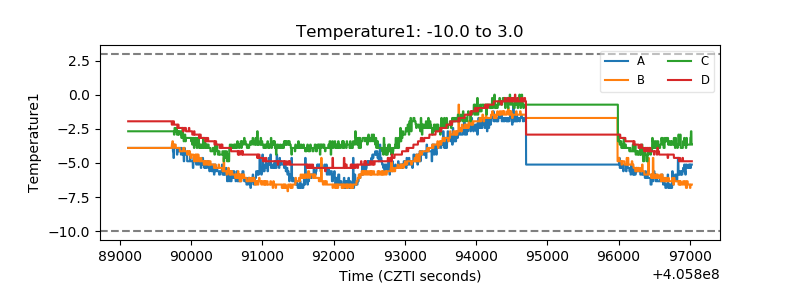 |
| Veto HV Monitor | 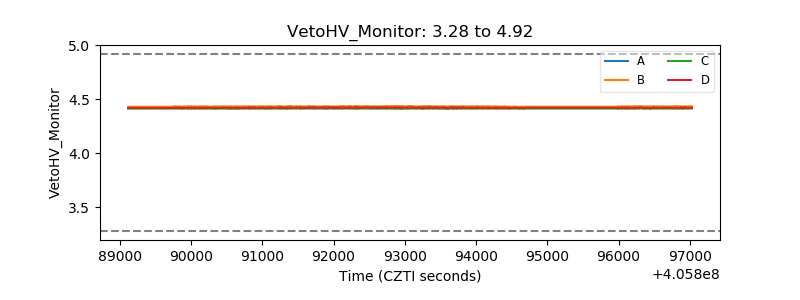 |
| Veto LLD | 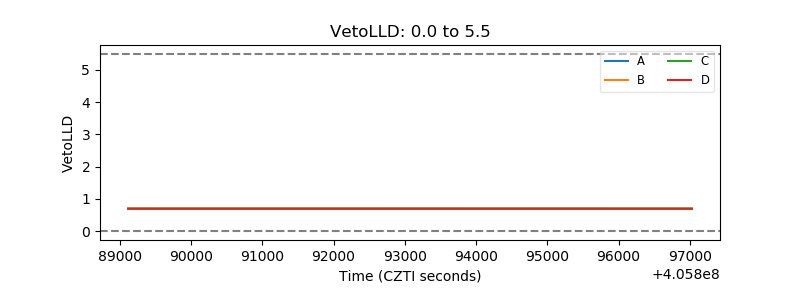 |
| Alpha Counter | 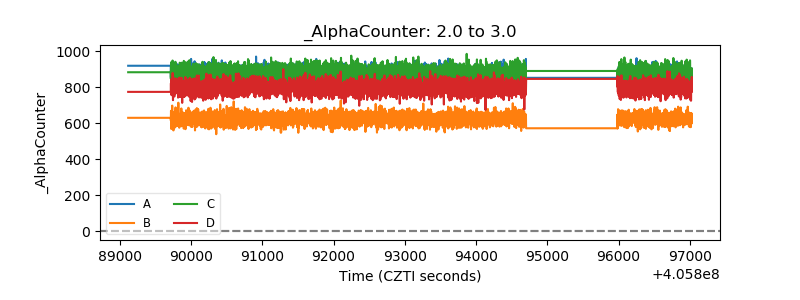 |
| _CPM_Rate | 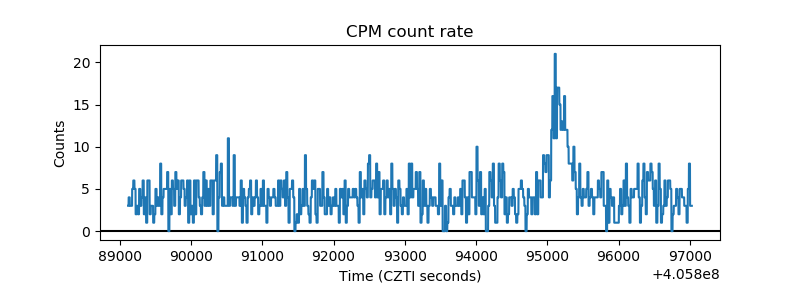 |
| CZT Counter | 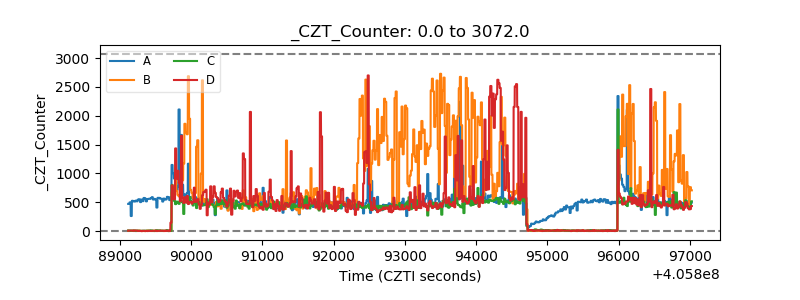 |
| +2.5 Volts monitor | 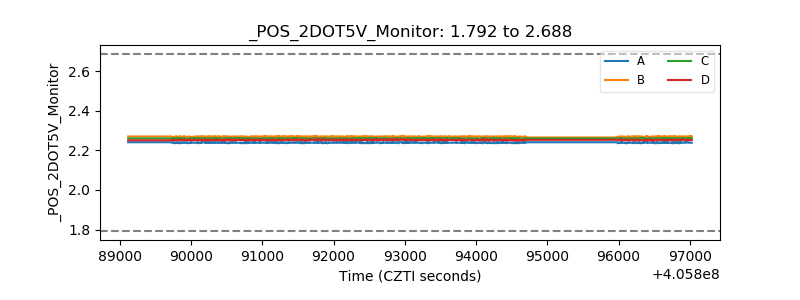 |
| +5 Volts monitor | 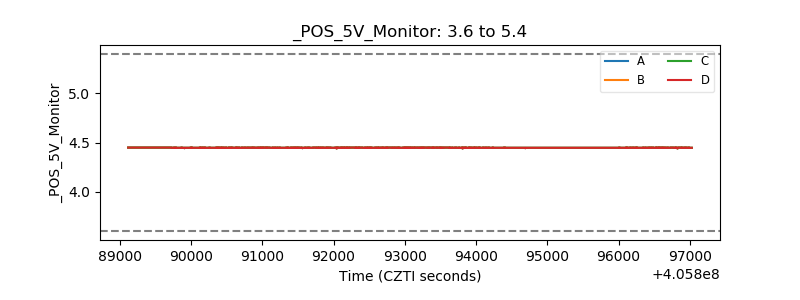 |
| _ROLL_ROT | 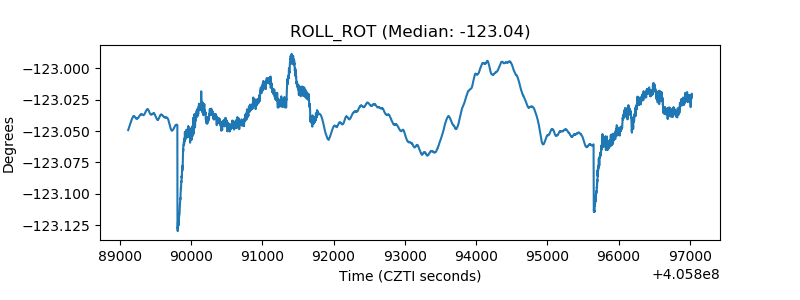 |
| _Roll_DEC | 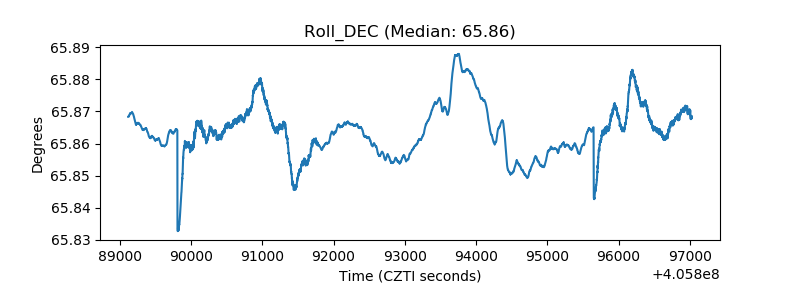 |
| _Roll_RA | 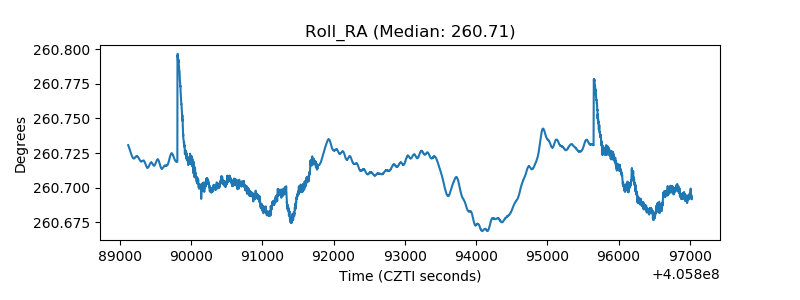 |
| Veto Counter | 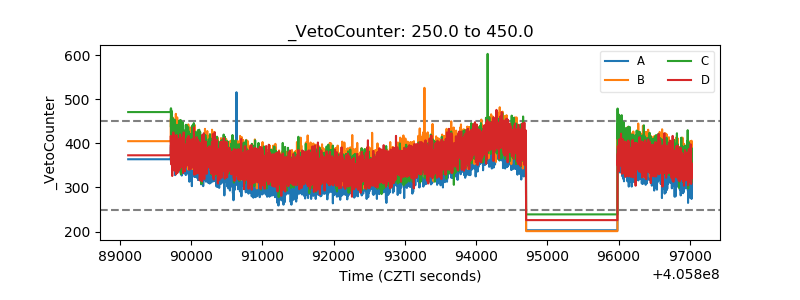 |