| Param | Original file | Final file |
|---|---|---|
| Filename | modeM0/AS1A12_018T01_9000005386_38582cztM0_level2.fits | modeM0/AS1A12_018T01_9000005386_38582cztM0_level2_quad_clean.evt |
| Size (bytes) | 393,370,560 | 91,189,440 |
| Size | 375.1 MB | 87.0 MB |
| Events in quadrant A | 2,889,757 | 635,642 |
| Events in quadrant B | 3,039,249 | 642,943 |
| Events in quadrant C | 2,738,977 | 603,448 |
| Events in quadrant D | 5,459,565 | 489,022 |
| Mode SS | |||
|---|---|---|---|
| Quadrant | BADHDUFLAG | Total packets | Discarded packets |
| A | 0 | 114 | 0 |
| B | 0 | 114 | 0 |
| C | 0 | 114 | 0 |
| D | 0 | 114 | 0 |
| Mode M9 | |||
|---|---|---|---|
| Quadrant | BADHDUFLAG | Total packets | Discarded packets |
| A | 0 | 14 | 0 |
| B | 0 | 14 | 0 |
| C | 0 | 14 | 0 |
| D | 0 | 14 | 0 |
| Mode M0 | |||
|---|---|---|---|
| Quadrant | BADHDUFLAG | Total packets | Discarded packets |
| A | 0 | 11996 | 2 |
| B | 0 | 12684 | 1 |
| C | 0 | 11575 | 1 |
| D | 0 | 20071 | 1 |
| Quadrant | Total seconds | Saturated seconds | Saturation percentage |
|---|---|---|---|
| A | 5573 | 12 | 0.215324% |
| B | 5573 | 59 | 1.058676% |
| C | 5573 | 14 | 0.251211% |
| D | 5573 | 872 | 15.646869% |
Noise dominated data is calculated using 1-second bins in cleaned event files. If a bin has >2000 counts, and if more than 50% of those come from <1% of pixels, then it is considered to be noise-dominated and hence unusable.
| Quadrant | # 1 sec bins | Bins with >0 counts | Bins with >2000 counts | High rate bins dominated by noise | Noise dominated (total time) | Noise dominated (detector-on time) | Marked lightcurve |
|---|---|---|---|---|---|---|---|
| A | 6976 | 5574 | 8 | 8 | 0.11% | 0.14% | 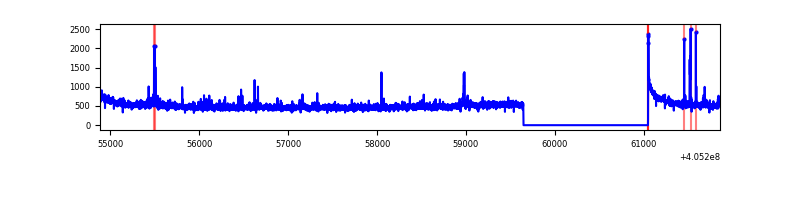 |
| B | 6976 | 5574 | 44 | 44 | 0.63% | 0.79% | 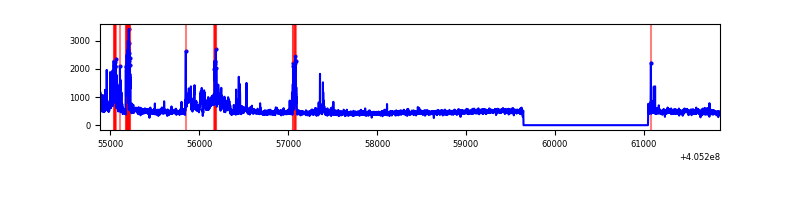 |
| C | 6976 | 5574 | 8 | 8 | 0.11% | 0.14% | 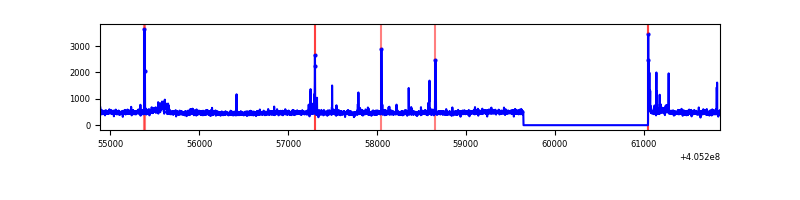 |
| D | 6976 | 5574 | 751 | 751 | 10.77% | 13.47% | 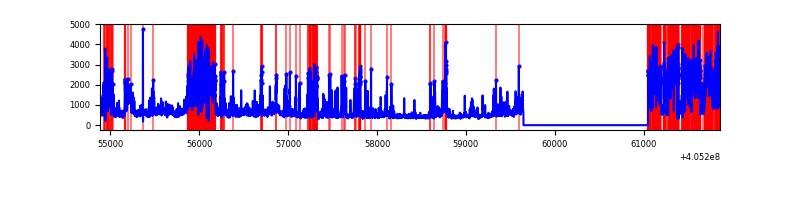 |
Top three noisy pixels from each quadrant. If the there are fewer than three noisy pixels in the level2.evt file, extra rows are filled as -1
| Pixel properties | Quadrant properties | ||||||
|---|---|---|---|---|---|---|---|
| Quadrant | DetID | PixID | Counts | Sigma | Mean | Median | Sigma |
| A | 10 | 83 | 386074 | 3080.4 | 619 | 607 | 125.1 |
| A | 9 | 143 | 58888 | 465.74 | 619 | 607 | 125.1 |
| A | 6 | 10 | 24718 | 192.68 | 619 | 607 | 125.1 |
| B | 5 | 184 | 435871 | 3683.61 | 613 | 597 | 118.2 |
| B | 0 | 189 | 71227 | 597.72 | 613 | 597 | 118.2 |
| B | 0 | 183 | 70337 | 590.19 | 613 | 597 | 118.2 |
| C | 15 | 214 | 227881 | 1605.12 | 601 | 605 | 141.6 |
| C | 14 | 254 | 105658 | 741.93 | 601 | 605 | 141.6 |
| C | 3 | 233 | 33326 | 231.09 | 601 | 605 | 141.6 |
| D | 12 | 227 | 1140241 | 8310.83 | 560 | 543 | 137.1 |
| D | 10 | 118 | 638495 | 4652.03 | 560 | 543 | 137.1 |
| D | 12 | 235 | 594419 | 4330.62 | 560 | 543 | 137.1 |
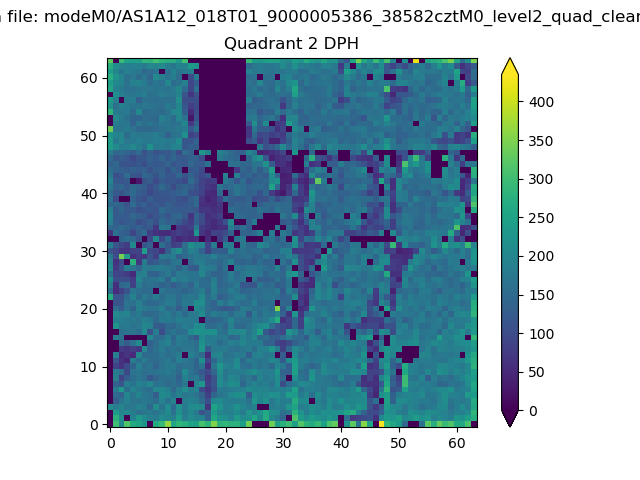
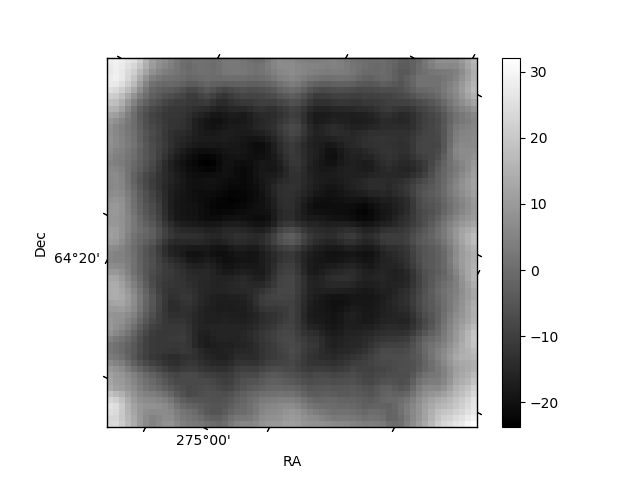
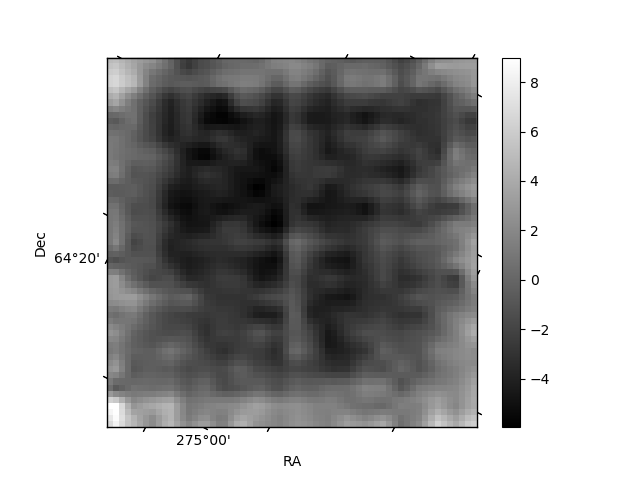
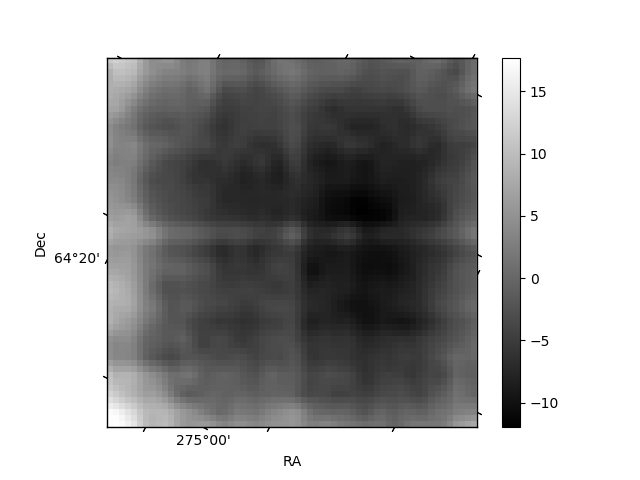
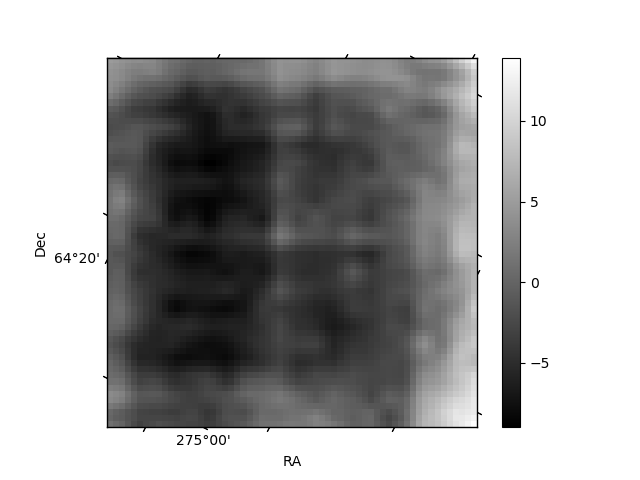
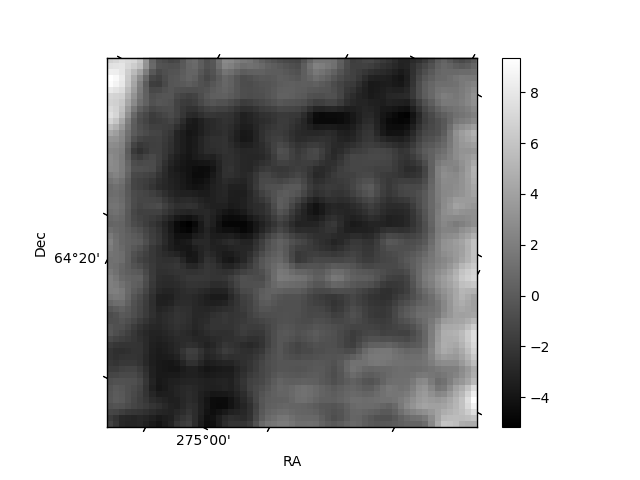
Histogram calculated using DETX and DETY for each event in the final _common_clean file
| Quadrant A | 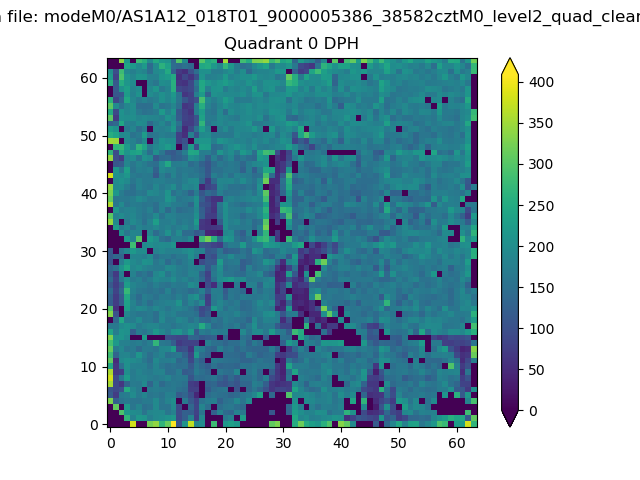 |
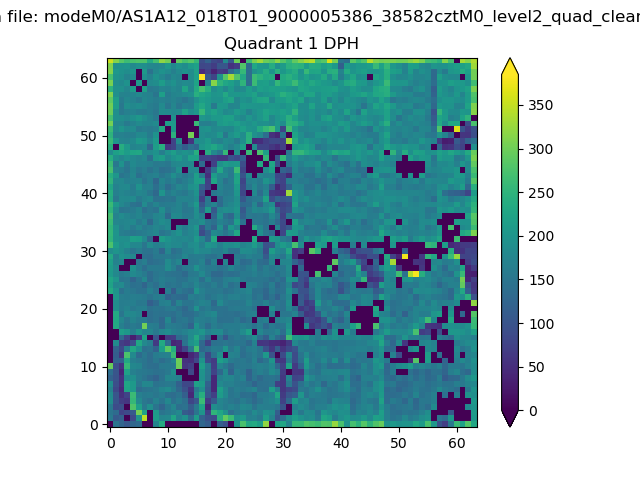 |
Quadrant B |
|---|---|---|---|
| Quadrant D | 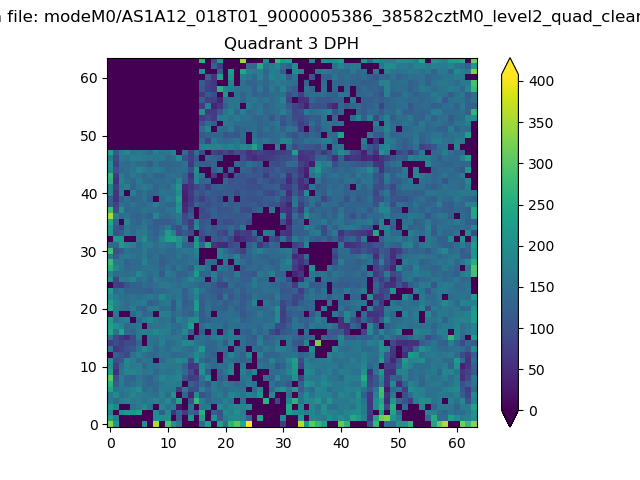 |
 |
Quadrant C |
| Plot type | Count rate plots | Images |
|---|---|---|
| Comparison with Poisson distribution Blue bars denote a histogram of data divided into 1 sec bins. Red curve is a Poisson curve with rate = median count rate of data. |
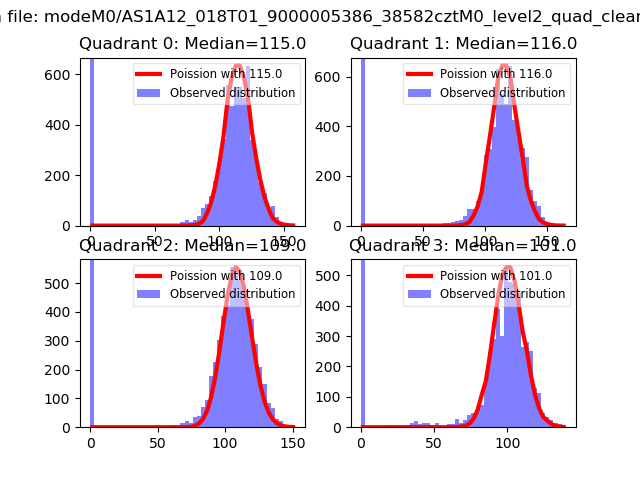 |
 |
| Quadrant-wise count rates Data is divided into 100 sec bins |
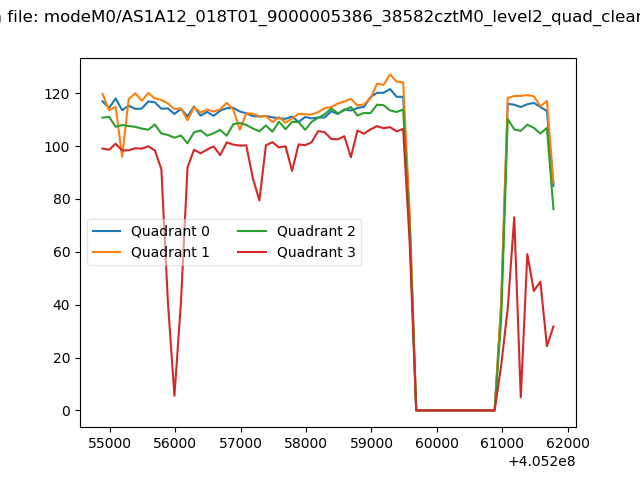 |
|
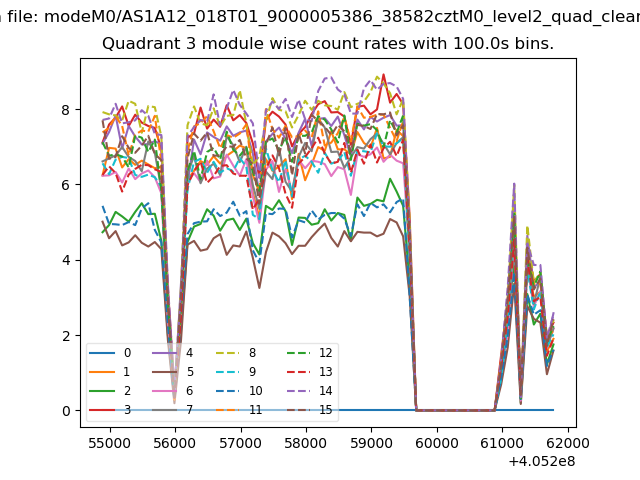
| Module-wise count rates for Quadrant A Data is divided into 100 sec bins |
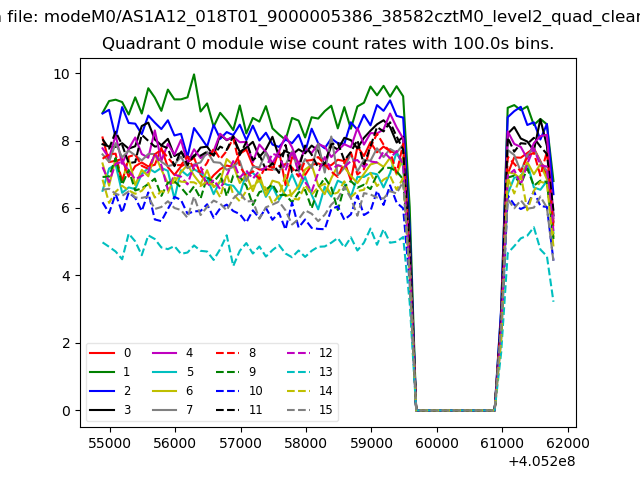 |
 |
| Module-wise count rates for Quadrant B Data is divided into 100 sec bins |
 |
 |
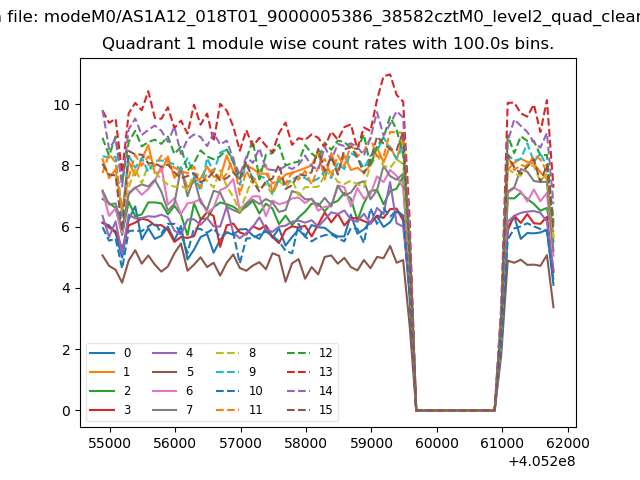
| Module-wise count rates for Quadrant C Data is divided into 100 sec bins |
 |
 |
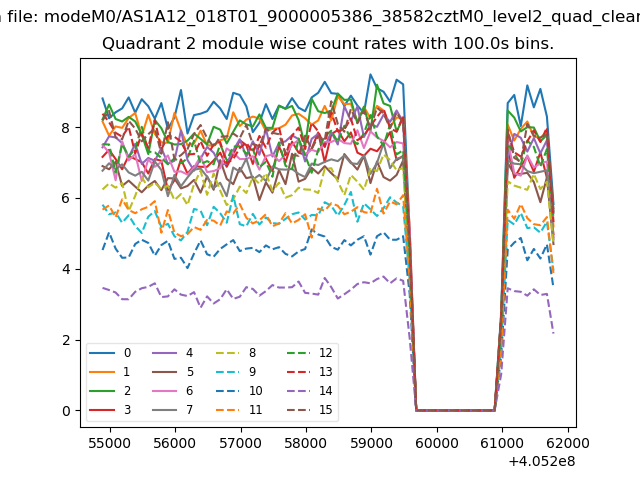
| Module-wise count rates for Quadrant D Data is divided into 100 sec bins |
 |
 |
| Parameter | Plot |
|---|---|
| CZT HV Monitor | 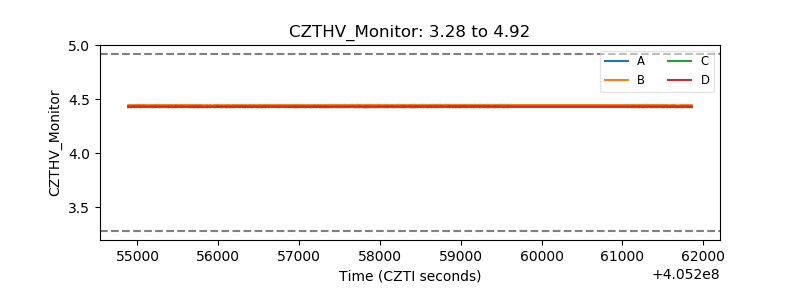 |
| D_VDD | 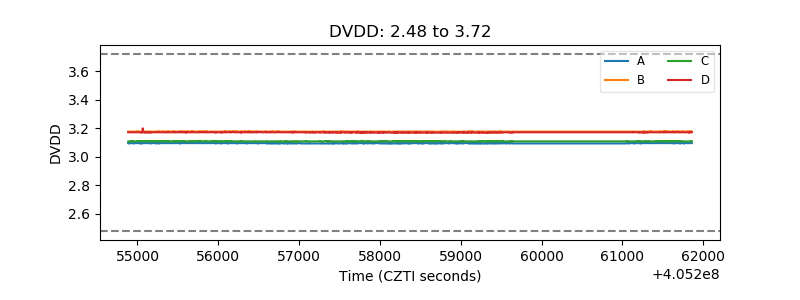 |
| Temperature 1 | 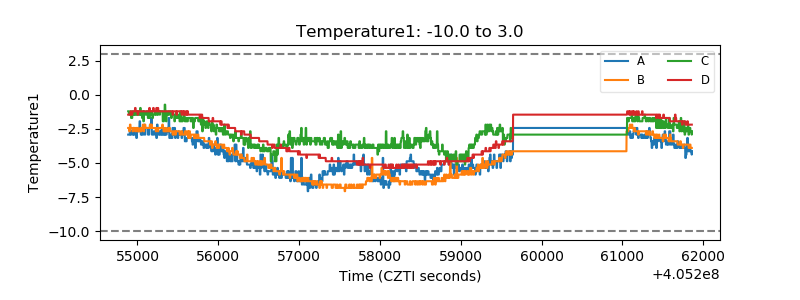 |
| Veto HV Monitor | 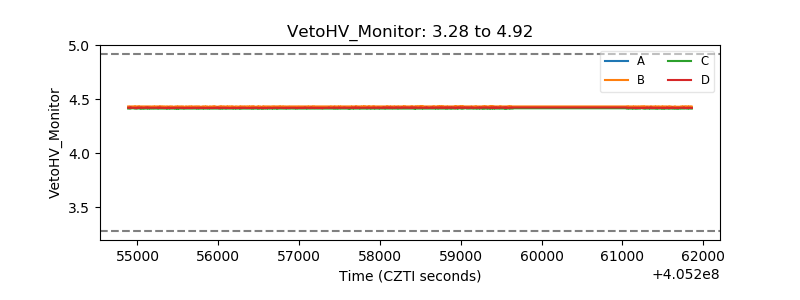 |
| Veto LLD | 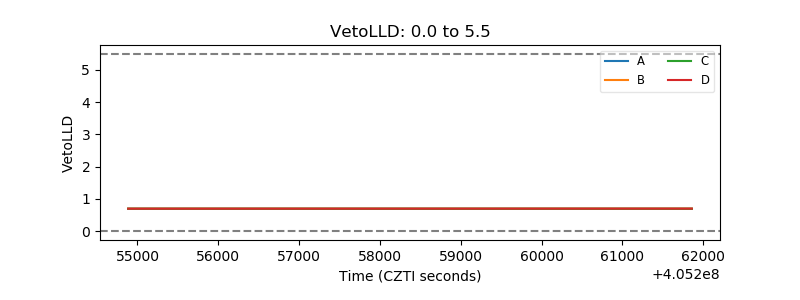 |
| Alpha Counter | 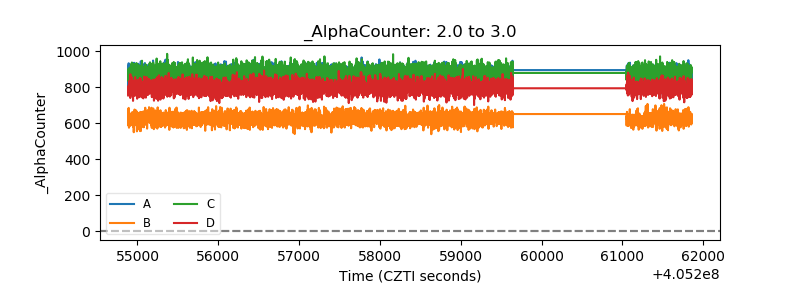 |
| _CPM_Rate | 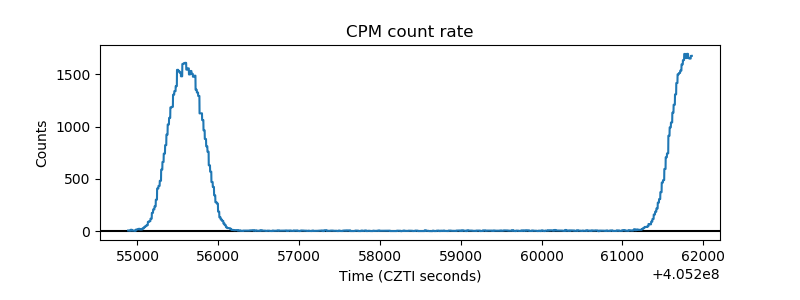 |
| CZT Counter | 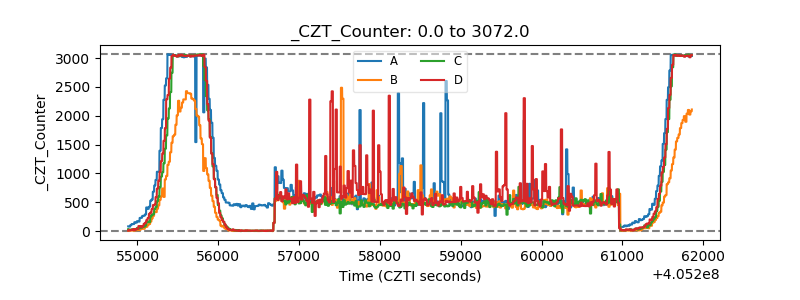 |
| +2.5 Volts monitor | 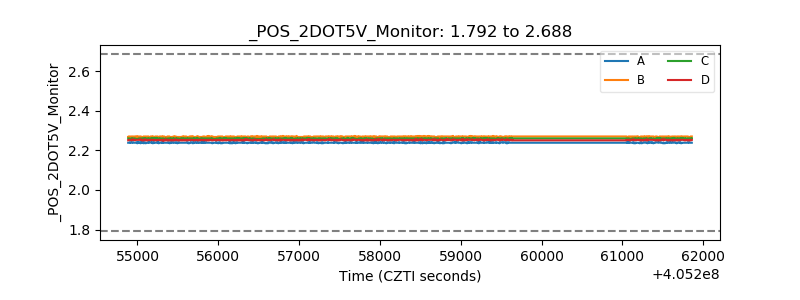 |
| +5 Volts monitor | 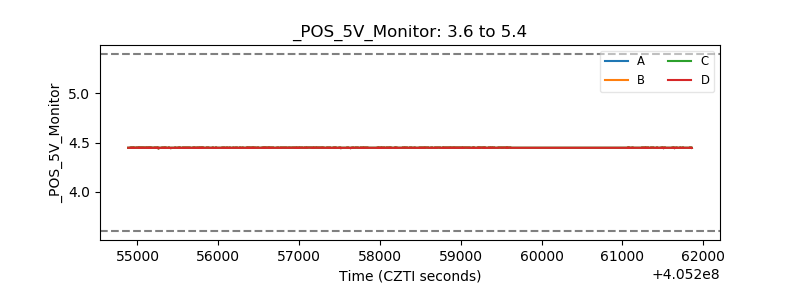 |
| _ROLL_ROT |  |
| _Roll_DEC | 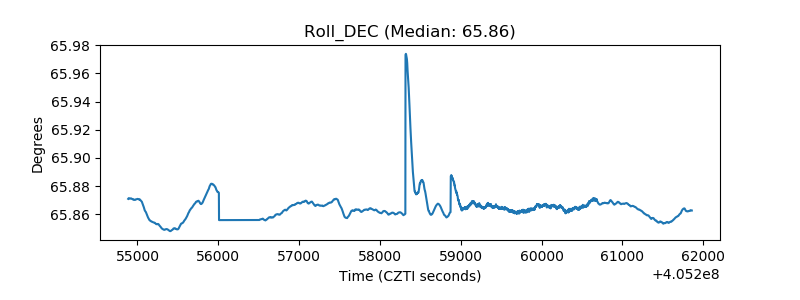 |
| _Roll_RA | 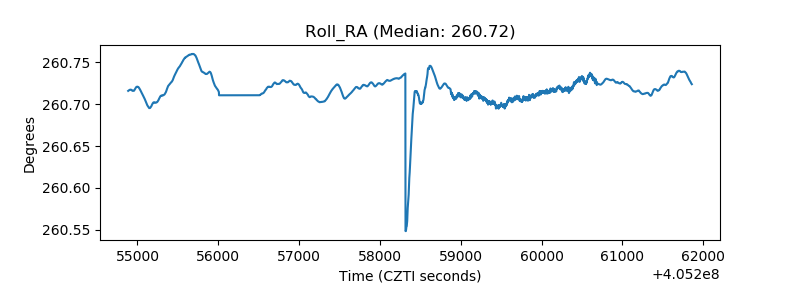 |
| Veto Counter | 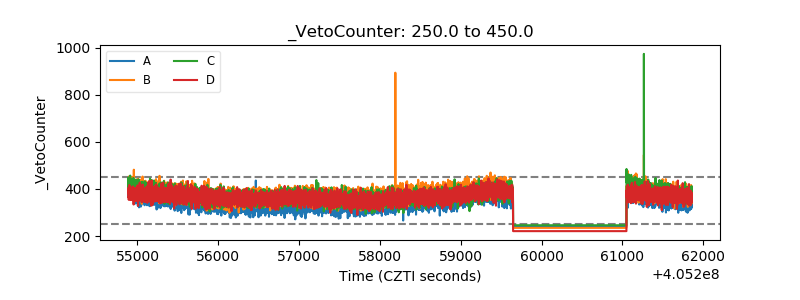 |