| Param | Original file | Final file |
|---|---|---|
| Filename | modeM0/AS1A12_018T01_9000005386_38583cztM0_level2.fits | modeM0/AS1A12_018T01_9000005386_38583cztM0_level2_quad_clean.evt |
| Size (bytes) | 463,772,160 | 95,633,280 |
| Size | 442.3 MB | 91.2 MB |
| Events in quadrant A | 3,106,970 | 671,267 |
| Events in quadrant B | 3,004,727 | 677,058 |
| Events in quadrant C | 4,494,194 | 615,584 |
| Events in quadrant D | 6,097,322 | 514,767 |
| Mode SS | |||
|---|---|---|---|
| Quadrant | BADHDUFLAG | Total packets | Discarded packets |
| A | 0 | 120 | 0 |
| B | 0 | 120 | 0 |
| C | 0 | 120 | 0 |
| D | 0 | 120 | 0 |
| Mode M9 | |||
|---|---|---|---|
| Quadrant | BADHDUFLAG | Total packets | Discarded packets |
| A | 0 | 16 | 0 |
| B | 0 | 16 | 0 |
| C | 0 | 16 | 0 |
| D | 0 | 17 | 0 |
| Mode M0 | |||
|---|---|---|---|
| Quadrant | BADHDUFLAG | Total packets | Discarded packets |
| A | 0 | 12896 | 3 |
| B | 0 | 12946 | 2 |
| C | 0 | 17188 | 2 |
| D | 0 | 22160 | 2 |
| Quadrant | Total seconds | Saturated seconds | Saturation percentage |
|---|---|---|---|
| A | 5970 | 20 | 0.335008% |
| B | 5970 | 93 | 1.557789% |
| C | 5970 | 339 | 5.678392% |
| D | 5970 | 1025 | 17.169179% |
Noise dominated data is calculated using 1-second bins in cleaned event files. If a bin has >2000 counts, and if more than 50% of those come from <1% of pixels, then it is considered to be noise-dominated and hence unusable.
| Quadrant | # 1 sec bins | Bins with >0 counts | Bins with >2000 counts | High rate bins dominated by noise | Noise dominated (total time) | Noise dominated (detector-on time) | Marked lightcurve |
|---|---|---|---|---|---|---|---|
| A | 7253 | 5971 | 14 | 14 | 0.19% | 0.23% | 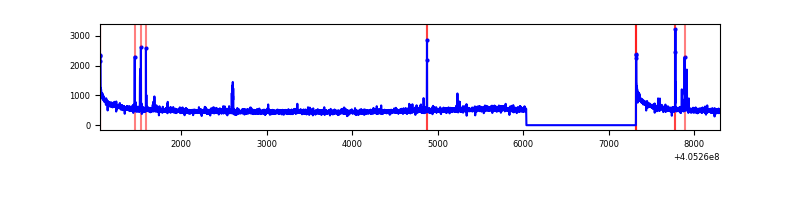 |
| B | 7253 | 5971 | 71 | 71 | 0.98% | 1.19% | 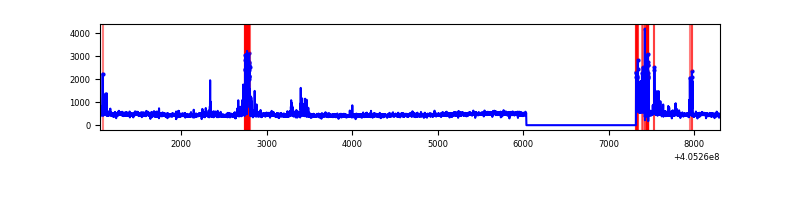 |
| C | 7253 | 5971 | 289 | 289 | 3.98% | 4.84% | 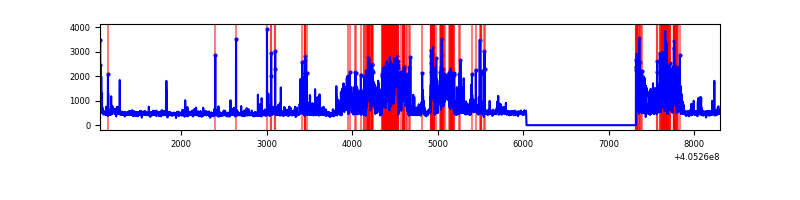 |
| D | 7253 | 5971 | 944 | 944 | 13.02% | 15.81% | 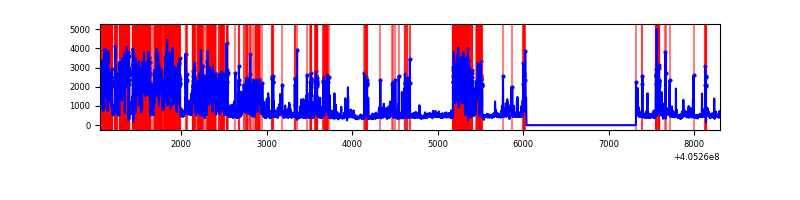 |
Top three noisy pixels from each quadrant. If the there are fewer than three noisy pixels in the level2.evt file, extra rows are filled as -1
| Pixel properties | Quadrant properties | ||||||
|---|---|---|---|---|---|---|---|
| Quadrant | DetID | PixID | Counts | Sigma | Mean | Median | Sigma |
| A | 10 | 83 | 436114 | 3219.76 | 665 | 651 | 135.2 |
| A | 13 | 248 | 38303 | 278.39 | 665 | 651 | 135.2 |
| A | 9 | 143 | 25212 | 181.6 | 665 | 651 | 135.2 |
| B | 5 | 184 | 200227 | 1587.21 | 656 | 637 | 125.7 |
| B | 0 | 183 | 91912 | 725.85 | 656 | 637 | 125.7 |
| B | 5 | 172 | 75571 | 595.9 | 656 | 637 | 125.7 |
| C | 14 | 254 | 1672565 | 11351.71 | 635 | 639 | 147.3 |
| C | 15 | 214 | 240877 | 1631.12 | 635 | 639 | 147.3 |
| C | 0 | 10 | 32985 | 219.62 | 635 | 639 | 147.3 |
| D | 12 | 227 | 1239279 | 8315.27 | 607 | 589 | 149.0 |
| D | 5 | 222 | 732545 | 4913.59 | 607 | 589 | 149.0 |
| D | 1 | 47 | 422243 | 2830.54 | 607 | 589 | 149.0 |
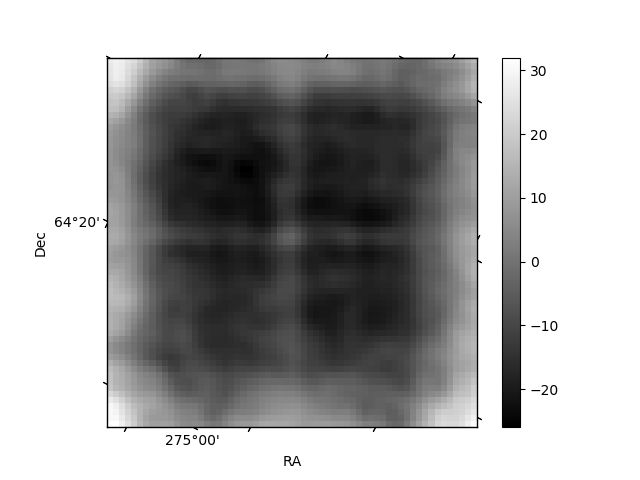
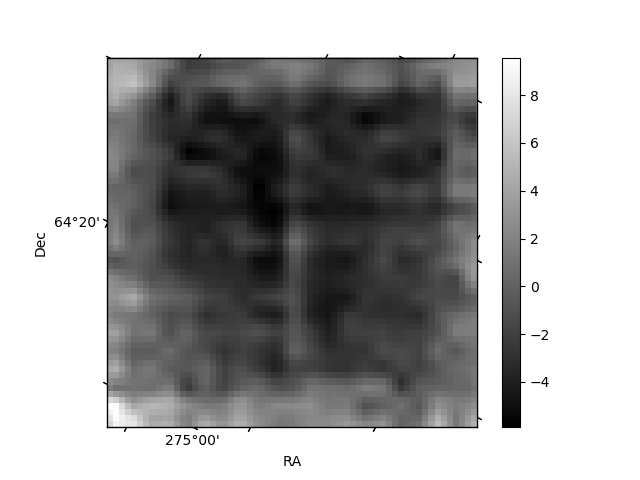
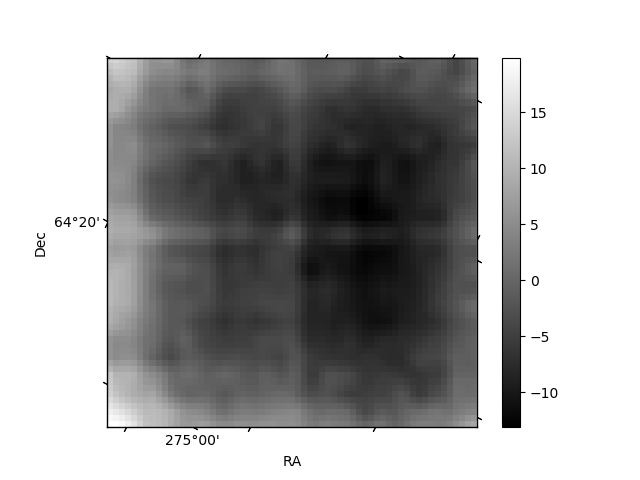
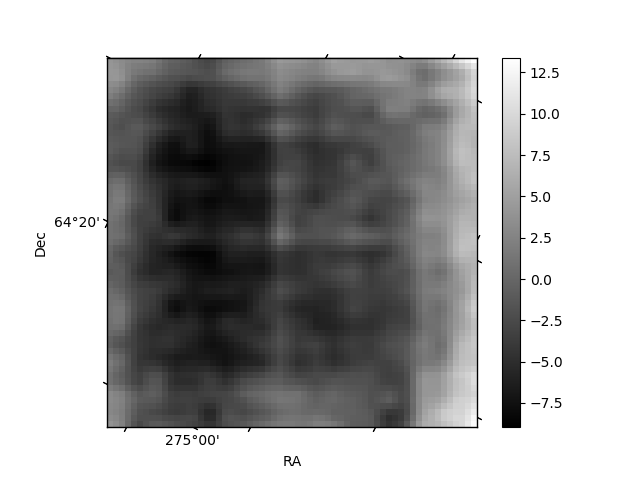
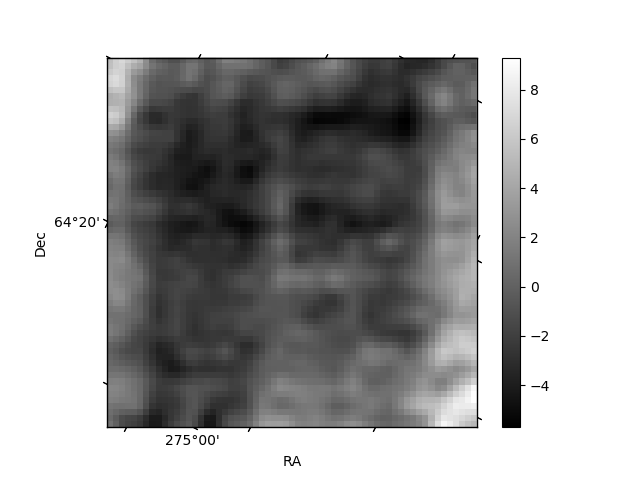
Histogram calculated using DETX and DETY for each event in the final _common_clean file
| Quadrant A | 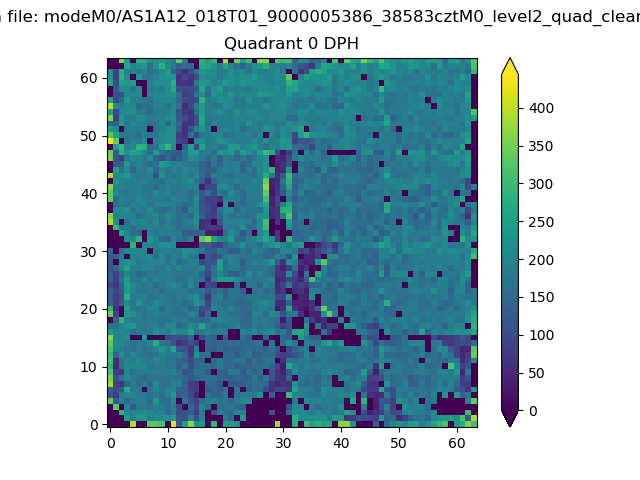 |
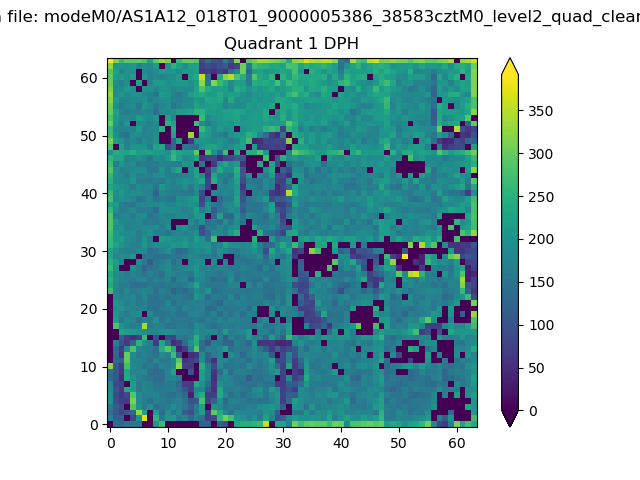 |
Quadrant B |
|---|---|---|---|
| Quadrant D | 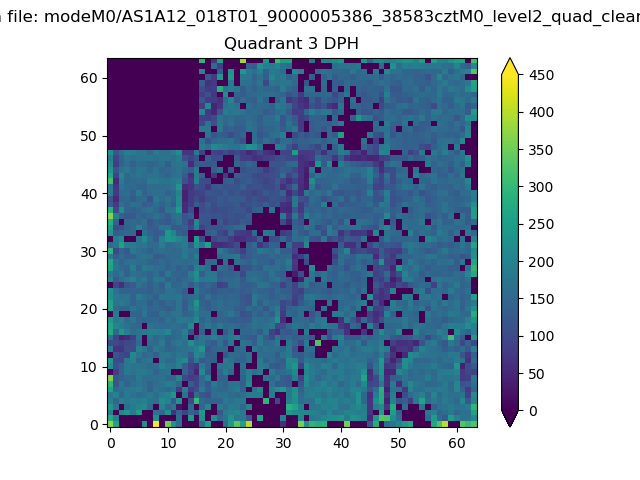 |
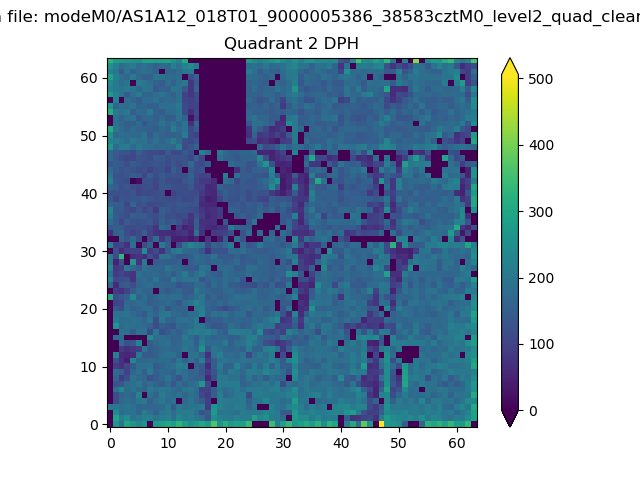 |
Quadrant C |
| Plot type | Count rate plots | Images |
|---|---|---|
| Comparison with Poisson distribution Blue bars denote a histogram of data divided into 1 sec bins. Red curve is a Poisson curve with rate = median count rate of data. |
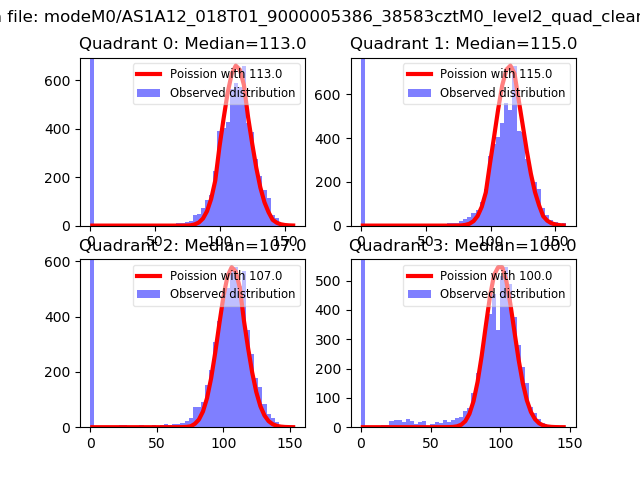 |
 |
| Quadrant-wise count rates Data is divided into 100 sec bins |
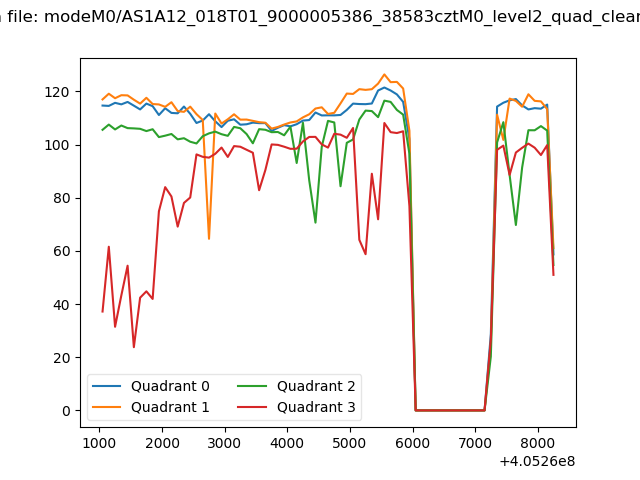 |
|
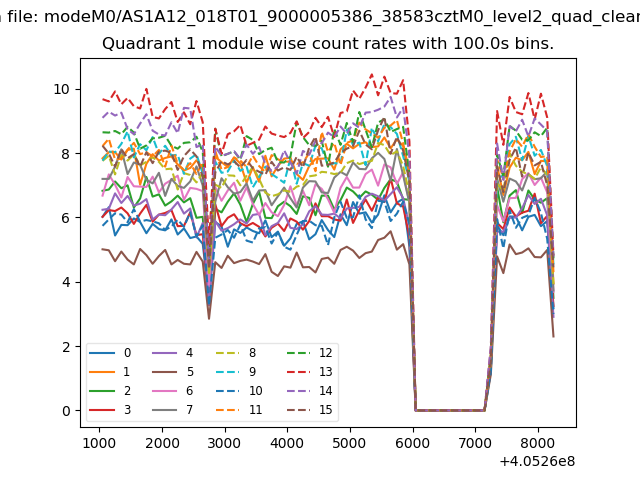
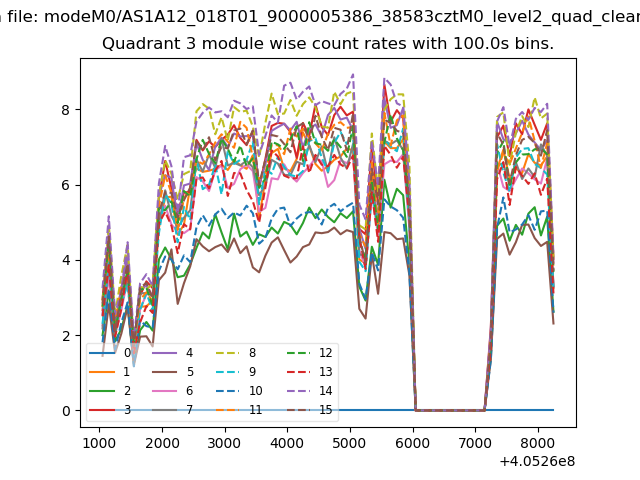
| Module-wise count rates for Quadrant A Data is divided into 100 sec bins |
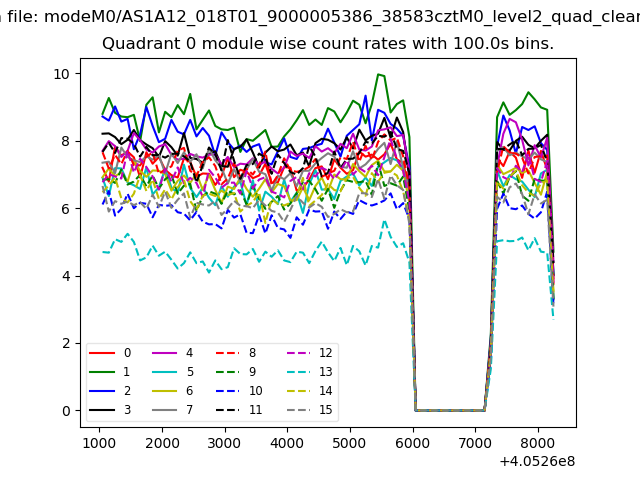 |
 |
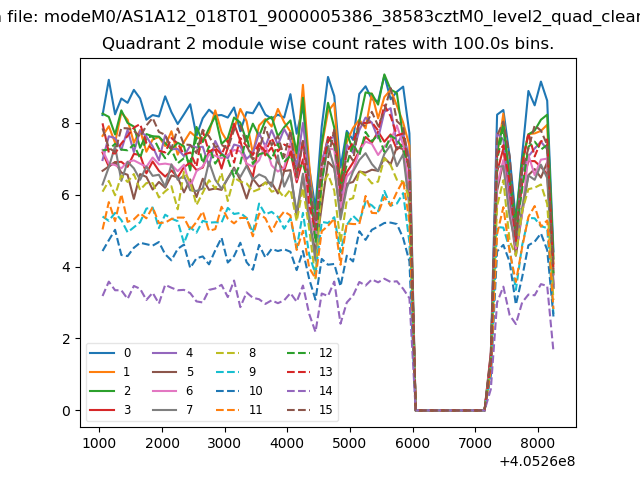
| Module-wise count rates for Quadrant B Data is divided into 100 sec bins |
 |
 |
| Module-wise count rates for Quadrant C Data is divided into 100 sec bins |
 |
 |
| Module-wise count rates for Quadrant D Data is divided into 100 sec bins |
 |
 |
| Parameter | Plot |
|---|---|
| CZT HV Monitor | 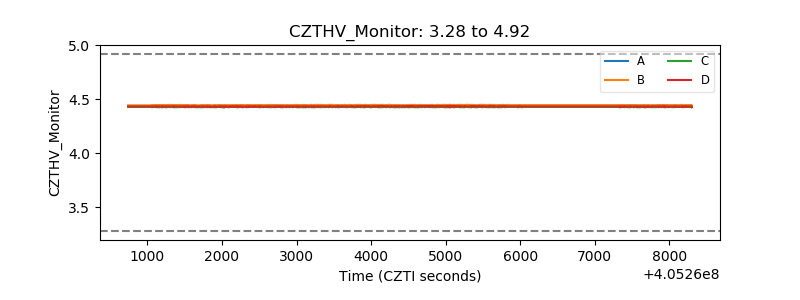 |
| D_VDD | 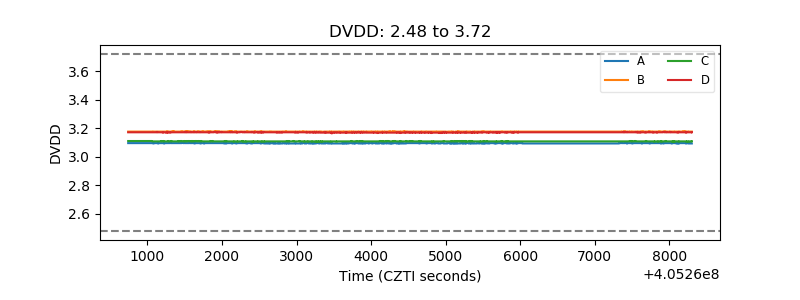 |
| Temperature 1 | 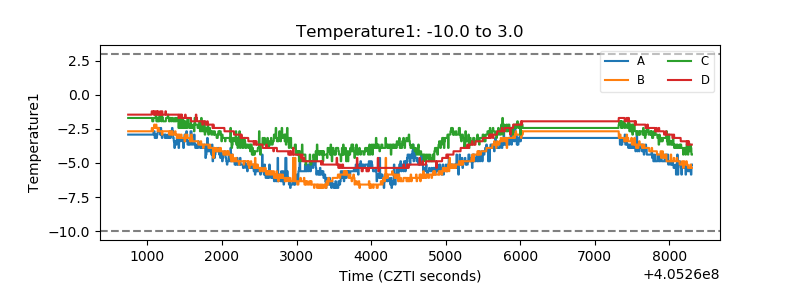 |
| Veto HV Monitor | 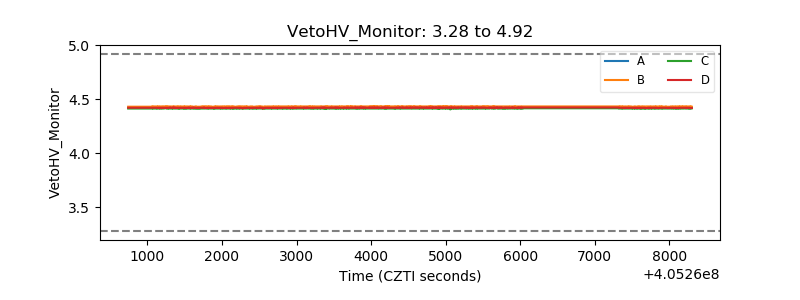 |
| Veto LLD | 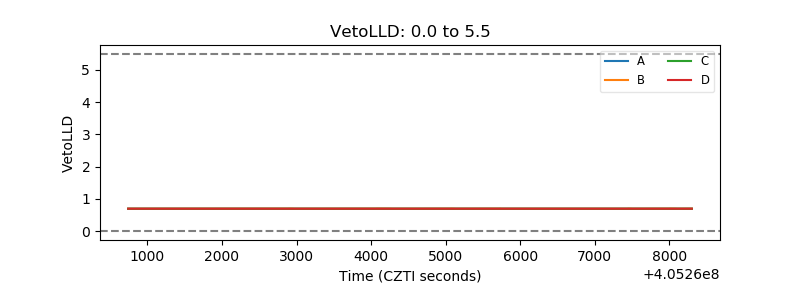 |
| Alpha Counter | 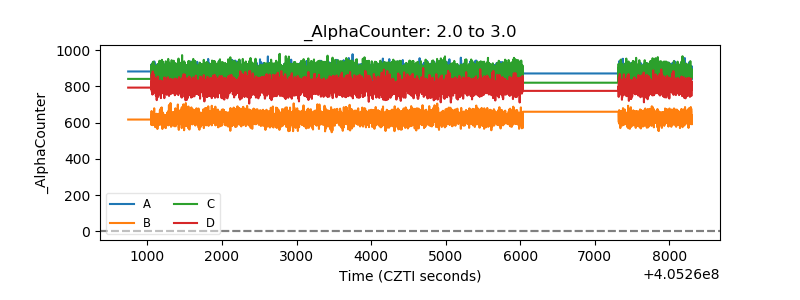 |
| _CPM_Rate | 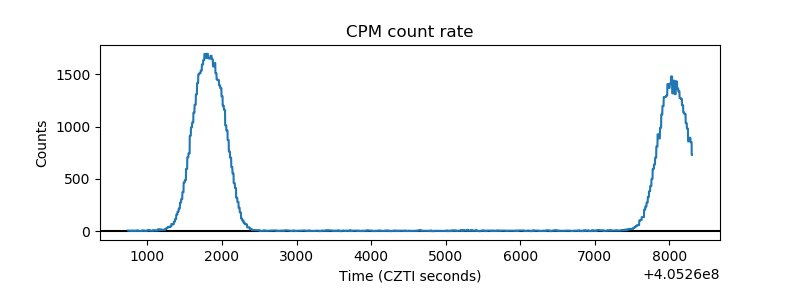 |
| CZT Counter | 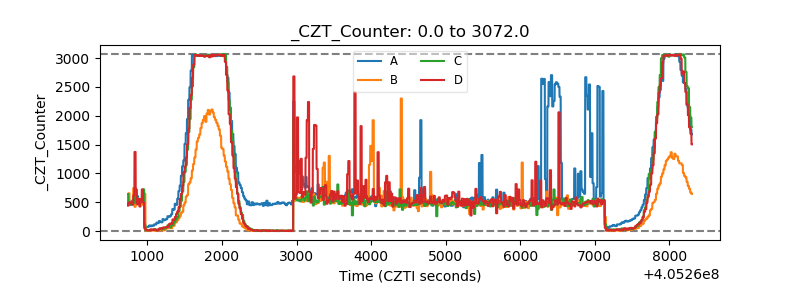 |
| +2.5 Volts monitor | 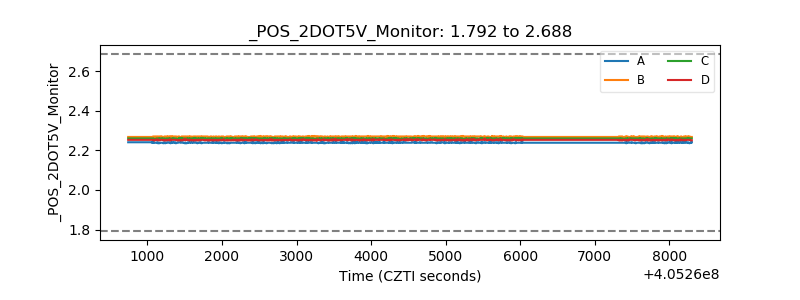 |
| +5 Volts monitor | 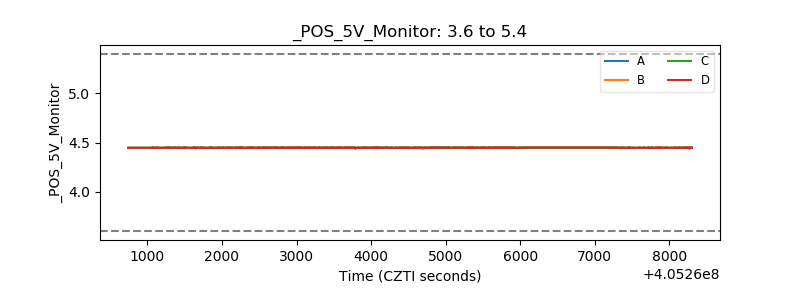 |
| _ROLL_ROT | 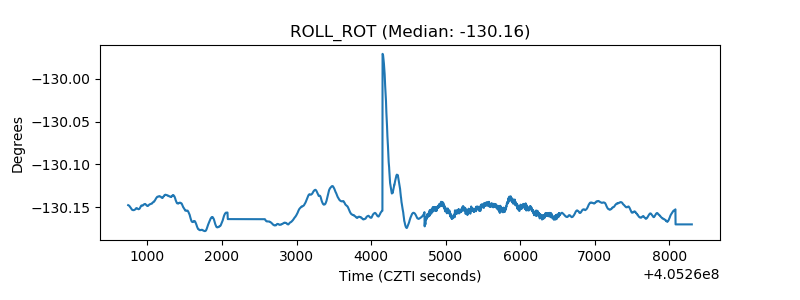 |
| _Roll_DEC | 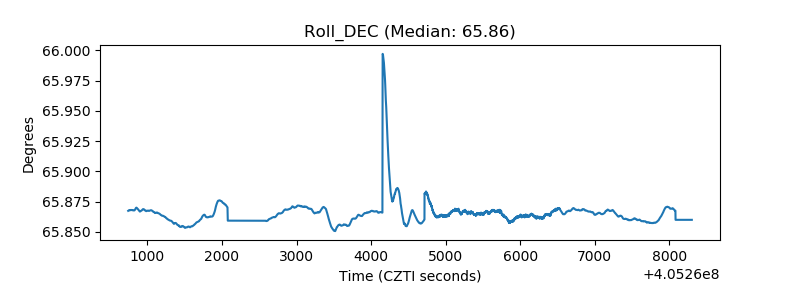 |
| _Roll_RA | 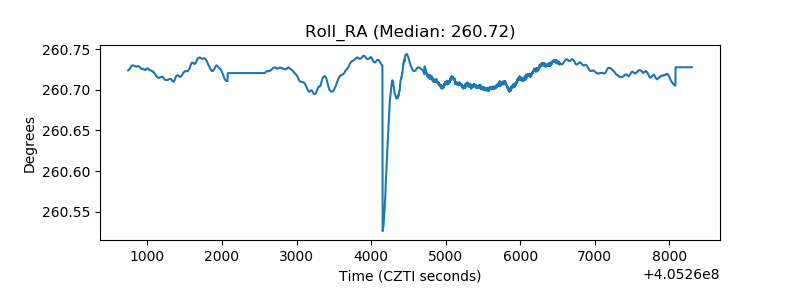 |
| Veto Counter | 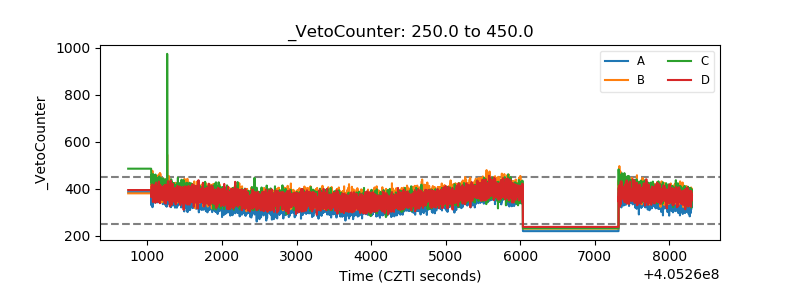 |