| Param | Original file | Final file |
|---|---|---|
| Filename | modeM0/AS1A12_018T01_9000005386_38589cztM0_level2.fits | modeM0/AS1A12_018T01_9000005386_38589cztM0_level2_quad_clean.evt |
| Size (bytes) | 142,827,840 | 25,035,840 |
| Size | 136.2 MB | 23.9 MB |
| Events in quadrant A | 795,480 | 169,999 |
| Events in quadrant B | 997,783 | 170,836 |
| Events in quadrant C | 2,052,448 | 153,115 |
| Events in quadrant D | 1,320,605 | 151,623 |
| Mode SS | |||
|---|---|---|---|
| Quadrant | BADHDUFLAG | Total packets | Discarded packets |
| A | 0 | 30 | 0 |
| B | 0 | 30 | 0 |
| C | 0 | 30 | 0 |
| D | 0 | 30 | 0 |
| Mode M9 | |||
|---|---|---|---|
| Quadrant | BADHDUFLAG | Total packets | Discarded packets |
| A | 0 | 7 | 0 |
| B | 0 | 7 | 0 |
| C | 0 | 7 | 0 |
| D | 0 | 8 | 0 |
| Mode M0 | |||
|---|---|---|---|
| Quadrant | BADHDUFLAG | Total packets | Discarded packets |
| A | 0 | 3370 | 1 |
| B | 0 | 4014 | 1 |
| C | 0 | 7157 | 1 |
| D | 0 | 5023 | 1 |
| Quadrant | Total seconds | Saturated seconds | Saturation percentage |
|---|---|---|---|
| A | 1524 | 6 | 0.393701% |
| B | 1524 | 45 | 2.952756% |
| C | 1524 | 227 | 14.895013% |
| D | 1524 | 89 | 5.839895% |
Noise dominated data is calculated using 1-second bins in cleaned event files. If a bin has >2000 counts, and if more than 50% of those come from <1% of pixels, then it is considered to be noise-dominated and hence unusable.
| Quadrant | # 1 sec bins | Bins with >0 counts | Bins with >2000 counts | High rate bins dominated by noise | Noise dominated (total time) | Noise dominated (detector-on time) | Marked lightcurve |
|---|---|---|---|---|---|---|---|
| A | 1524 | 1524 | 2 | 2 | 0.13% | 0.13% | 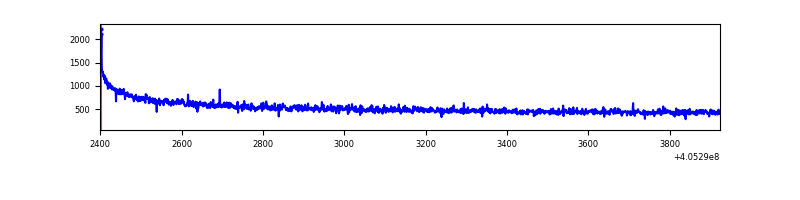 |
| B | 1524 | 1524 | 27 | 27 | 1.77% | 1.77% | 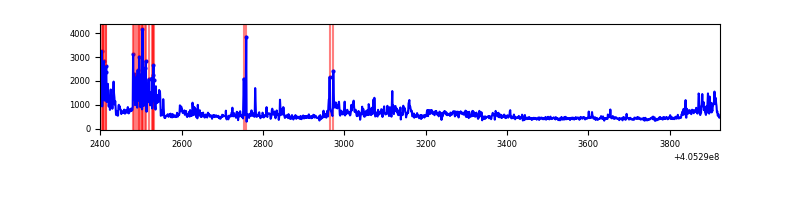 |
| C | 1524 | 1524 | 226 | 226 | 14.83% | 14.83% | 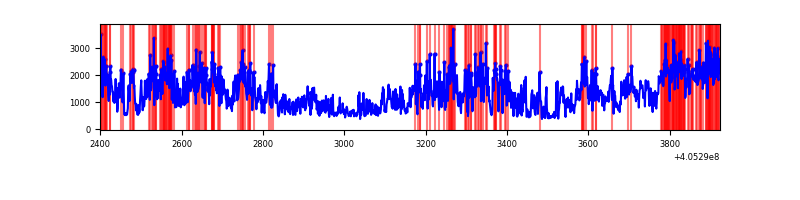 |
| D | 1524 | 1524 | 98 | 98 | 6.43% | 6.43% | 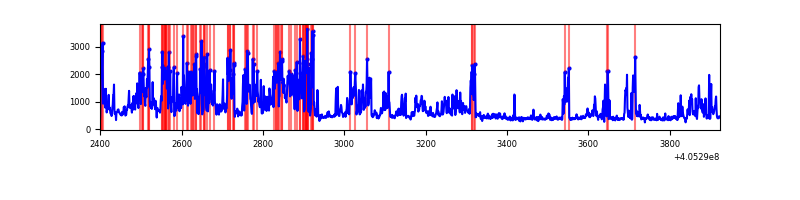 |
Top three noisy pixels from each quadrant. If the there are fewer than three noisy pixels in the level2.evt file, extra rows are filled as -1
| Pixel properties | Quadrant properties | ||||||
|---|---|---|---|---|---|---|---|
| Quadrant | DetID | PixID | Counts | Sigma | Mean | Median | Sigma |
| A | 10 | 83 | 145576 | 4035.79 | 167 | 163 | 36.0 |
| A | 13 | 254 | 2360 | 60.98 | 167 | 163 | 36.0 |
| A | 10 | 67 | 1887 | 47.85 | 167 | 163 | 36.0 |
| B | 5 | 184 | 317068 | 9418.25 | 166 | 161 | 33.6 |
| B | 5 | 172 | 16610 | 488.85 | 166 | 161 | 33.6 |
| B | 12 | 111 | 4242 | 121.28 | 166 | 161 | 33.6 |
| C | 14 | 254 | 1341163 | 34051.25 | 160 | 161 | 39.4 |
| C | 15 | 214 | 63007 | 1595.81 | 160 | 161 | 39.4 |
| C | 0 | 10 | 16846 | 423.67 | 160 | 161 | 39.4 |
| D | 1 | 47 | 566513 | 13994.17 | 159 | 154 | 40.5 |
| D | 13 | 138 | 58916 | 1451.95 | 159 | 154 | 40.5 |
| D | 13 | 249 | 23782 | 583.82 | 159 | 154 | 40.5 |
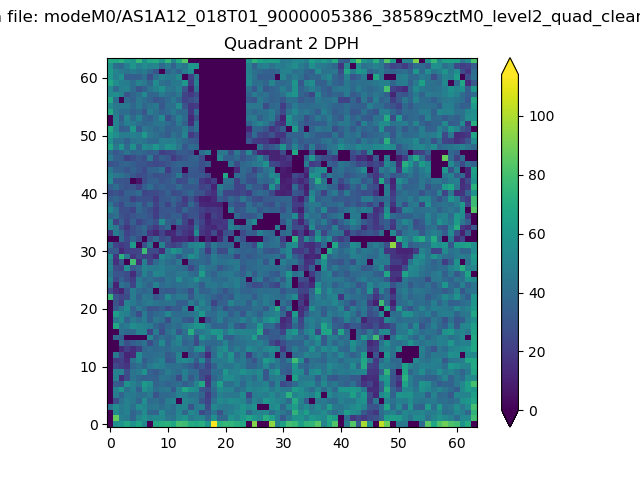
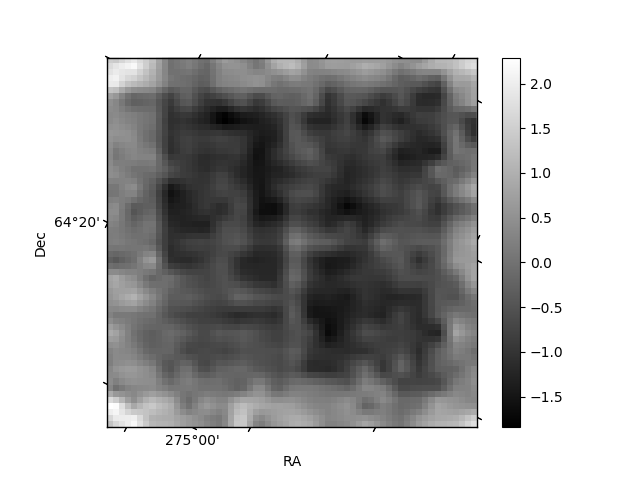
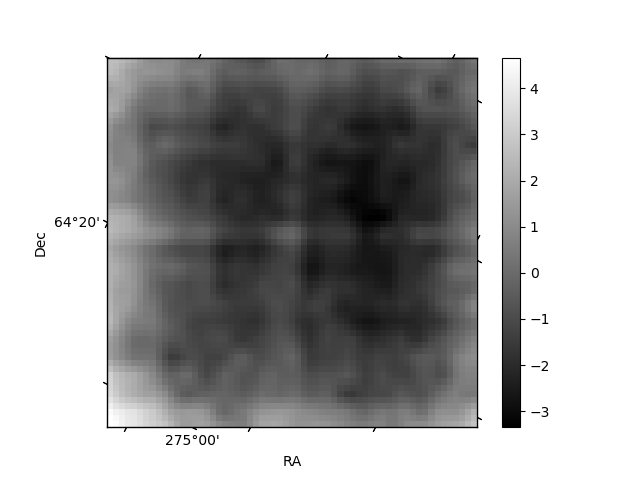
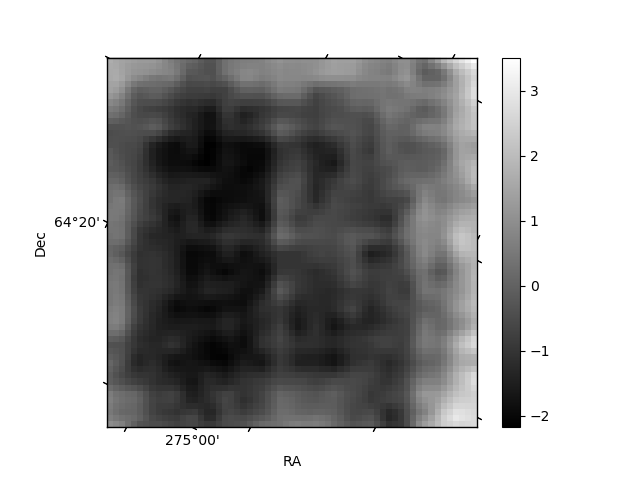
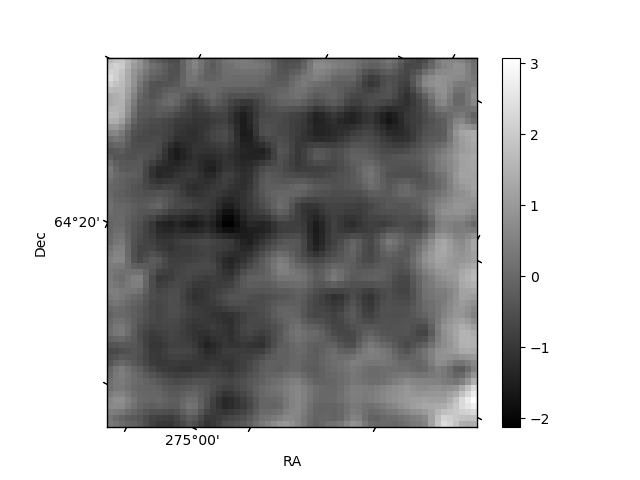
Histogram calculated using DETX and DETY for each event in the final _common_clean file
| Quadrant A |  |
 |
Quadrant B |
|---|---|---|---|
| Quadrant D | 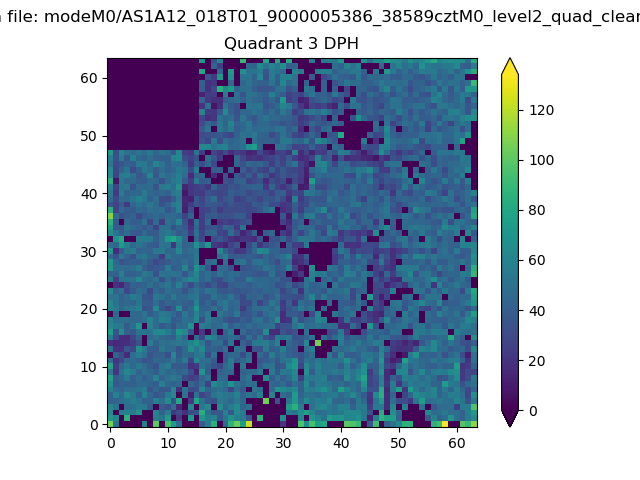 |
 |
Quadrant C |
| Plot type | Count rate plots | Images |
|---|---|---|
| Comparison with Poisson distribution Blue bars denote a histogram of data divided into 1 sec bins. Red curve is a Poisson curve with rate = median count rate of data. |
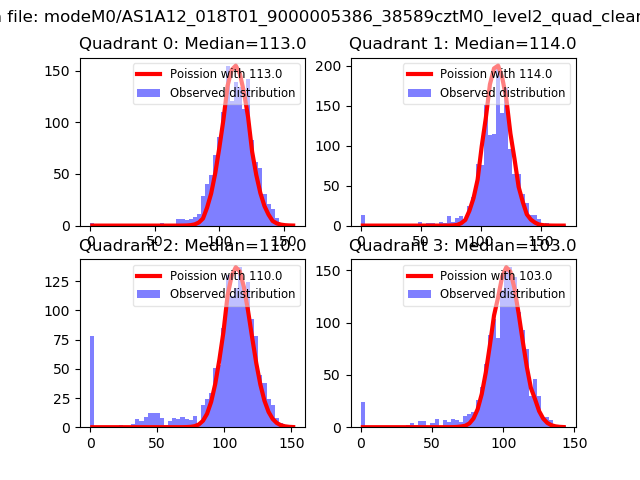 |
 |
| Quadrant-wise count rates Data is divided into 100 sec bins |
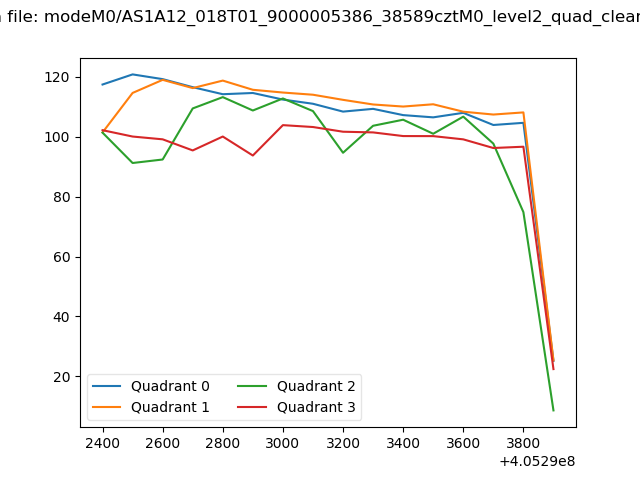 |
|
| Module-wise count rates for Quadrant A Data is divided into 100 sec bins |
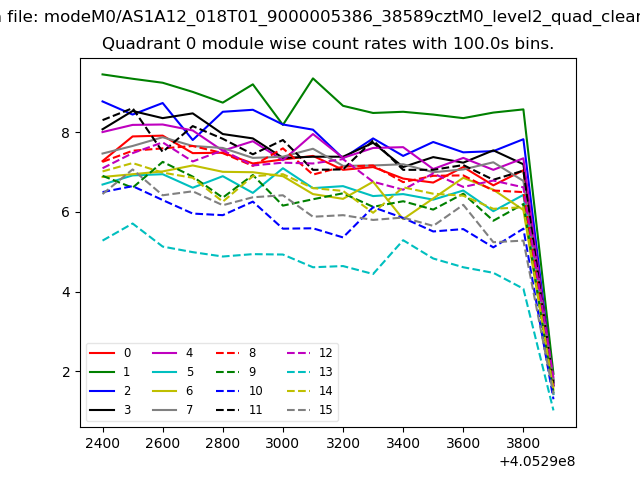 |
 |
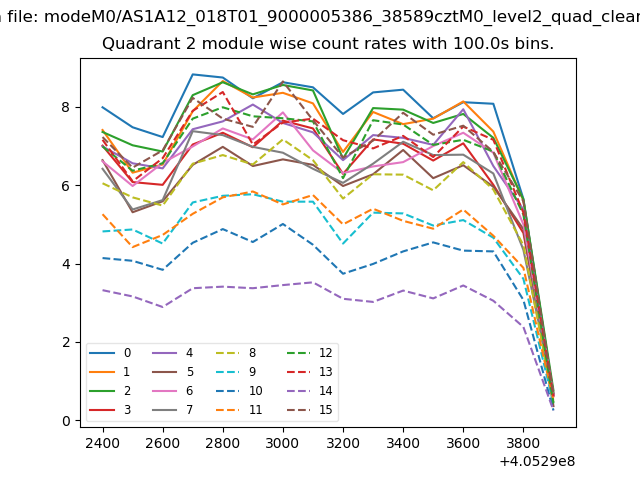
| Module-wise count rates for Quadrant B Data is divided into 100 sec bins |
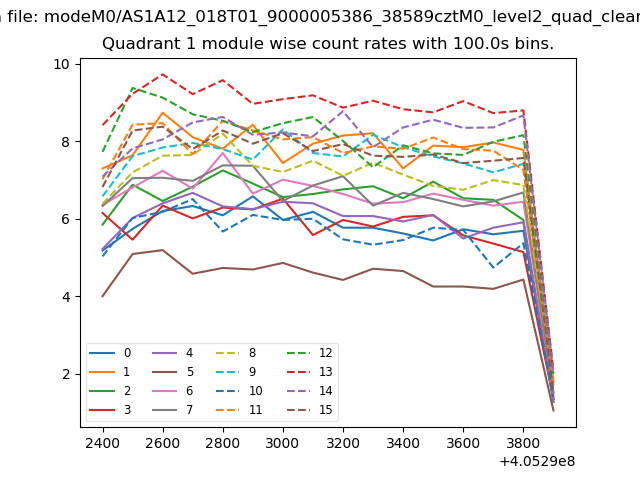 |
 |
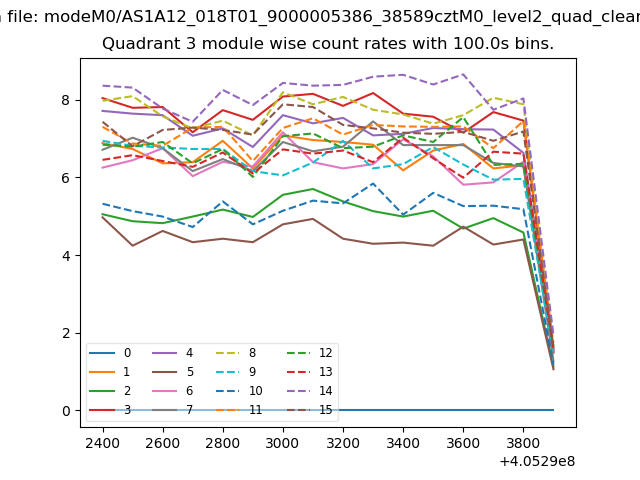
| Module-wise count rates for Quadrant C Data is divided into 100 sec bins |
 |
 |
| Module-wise count rates for Quadrant D Data is divided into 100 sec bins |
 |
 |
| Parameter | Plot |
|---|---|
| CZT HV Monitor | 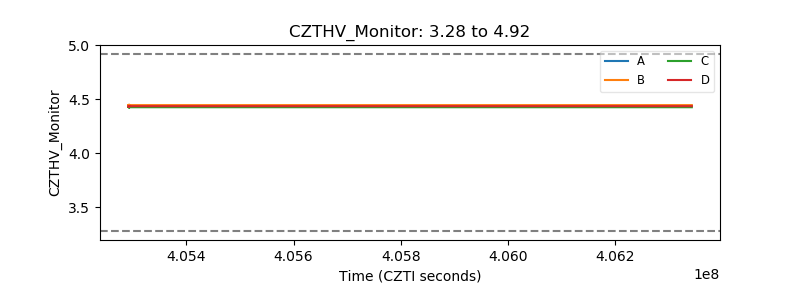 |
| D_VDD | 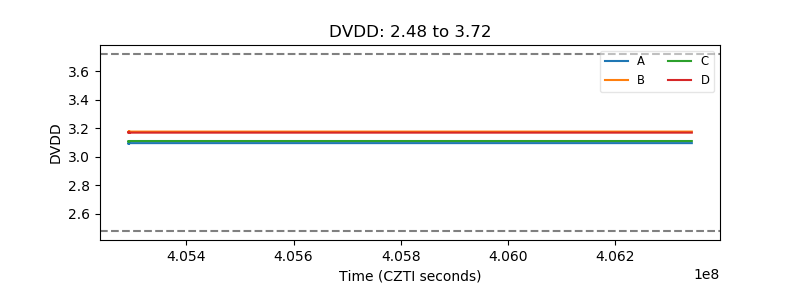 |
| Temperature 1 | 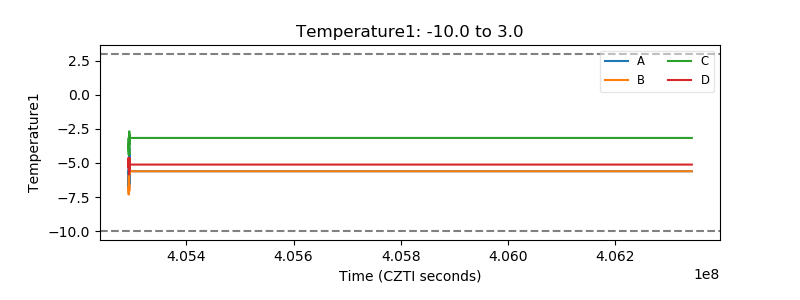 |
| Veto HV Monitor | 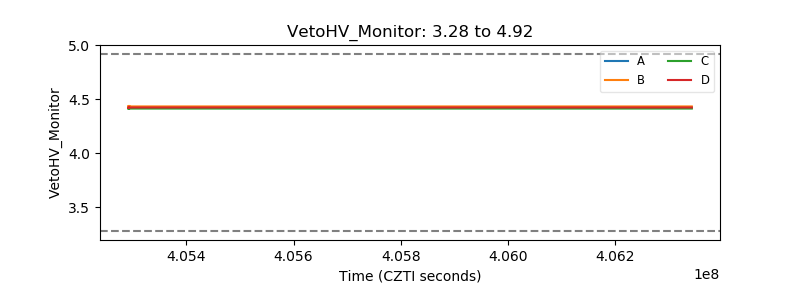 |
| Veto LLD | 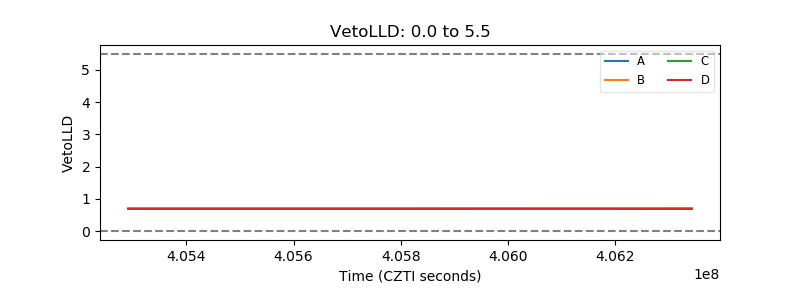 |
| Alpha Counter | 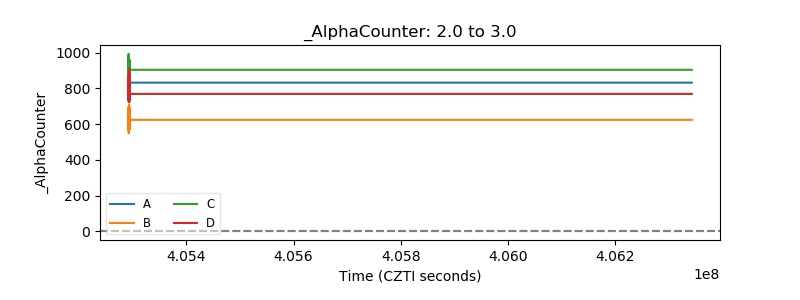 |
| _CPM_Rate | 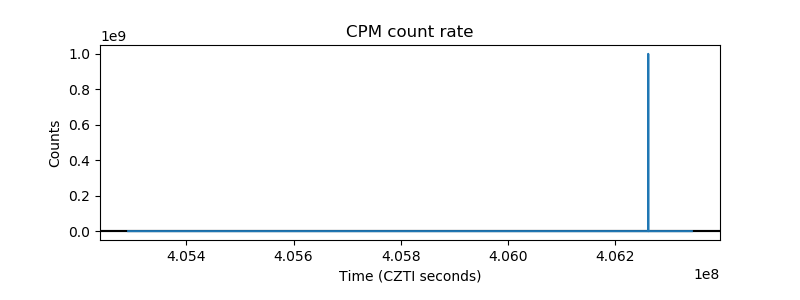 |
| CZT Counter | 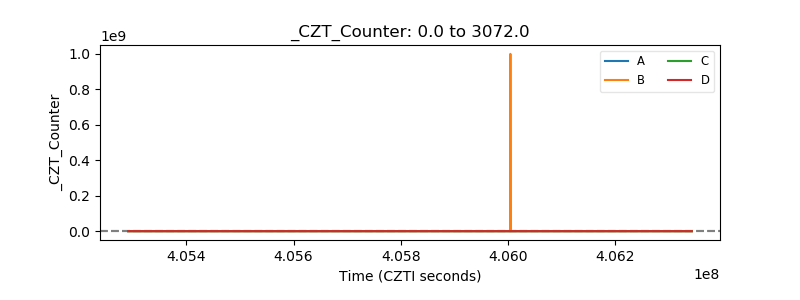 |
| +2.5 Volts monitor | 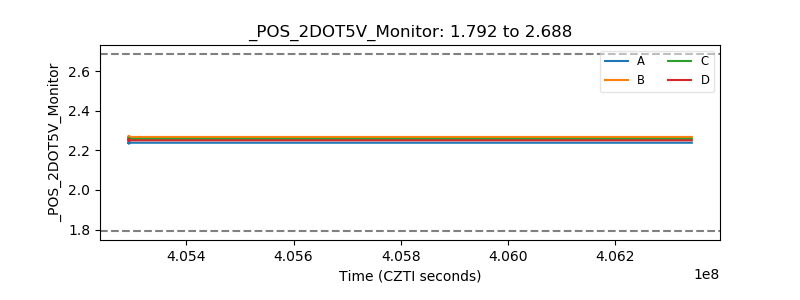 |
| +5 Volts monitor | 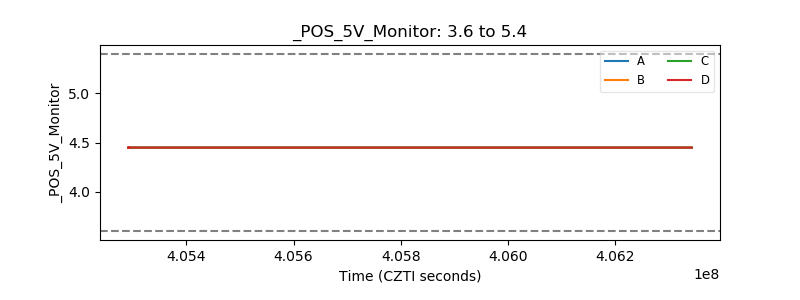 |
| _ROLL_ROT | 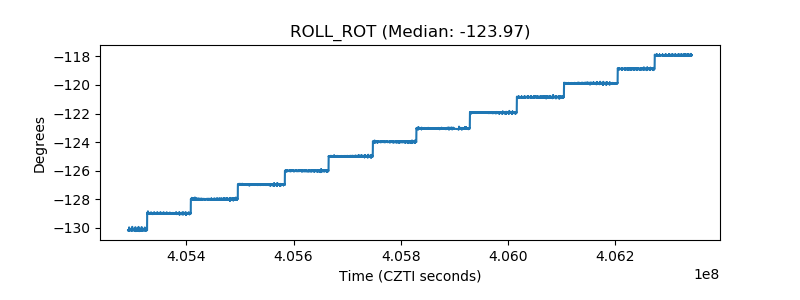 |
| _Roll_DEC | 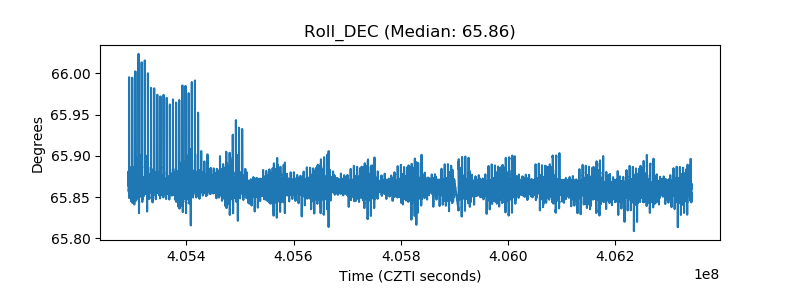 |
| _Roll_RA | 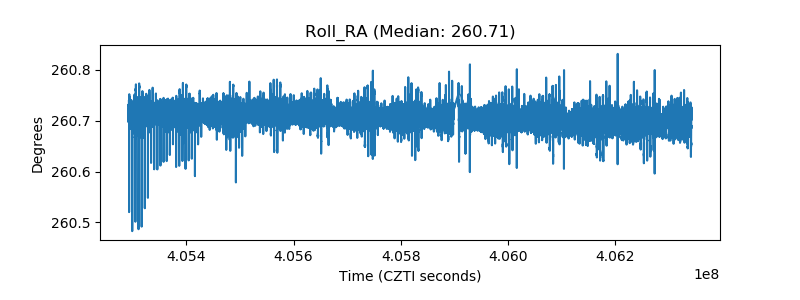 |
| Veto Counter | 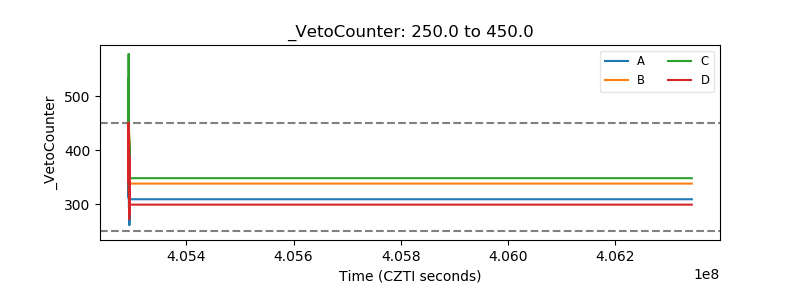 |