| Param | Original file | Final file |
|---|---|---|
| Filename | modeM0/AS1A12_052T04_9000005388_38590cztM0_level2.fits | modeM0/AS1A12_052T04_9000005388_38590cztM0_level2_quad_clean.evt |
| Size (bytes) | 492,042,240 | 93,934,080 |
| Size | 469.2 MB | 89.6 MB |
| Events in quadrant A | 2,854,857 | 660,032 |
| Events in quadrant B | 3,105,564 | 674,357 |
| Events in quadrant C | 7,674,605 | 574,754 |
| Events in quadrant D | 4,171,960 | 567,536 |
| Mode M0 | |||
|---|---|---|---|
| Quadrant | BADHDUFLAG | Total packets | Discarded packets |
| A | 0 | 11544 | 3 |
| B | 0 | 12483 | 2 |
| C | 0 | 26481 | 2 |
| D | 0 | 15852 | 2 |
| Mode SS | |||
|---|---|---|---|
| Quadrant | BADHDUFLAG | Total packets | Discarded packets |
| A | 0 | 108 | 0 |
| B | 0 | 108 | 0 |
| C | 0 | 108 | 0 |
| D | 0 | 108 | 0 |
| Mode M9 | |||
|---|---|---|---|
| Quadrant | BADHDUFLAG | Total packets | Discarded packets |
| A | 0 | 26 | 0 |
| B | 0 | 26 | 0 |
| C | 0 | 26 | 0 |
| D | 0 | 27 | 0 |
| Quadrant | Total seconds | Saturated seconds | Saturation percentage |
|---|---|---|---|
| A | 5248 | 7 | 0.133384% |
| B | 5248 | 92 | 1.753049% |
| C | 5248 | 937 | 17.854421% |
| D | 5248 | 332 | 6.326220% |
Noise dominated data is calculated using 1-second bins in cleaned event files. If a bin has >2000 counts, and if more than 50% of those come from <1% of pixels, then it is considered to be noise-dominated and hence unusable.
| Quadrant | # 1 sec bins | Bins with >0 counts | Bins with >2000 counts | High rate bins dominated by noise | Noise dominated (total time) | Noise dominated (detector-on time) | Marked lightcurve |
|---|---|---|---|---|---|---|---|
| A | 7131 | 5249 | 4 | 4 | 0.06% | 0.08% | 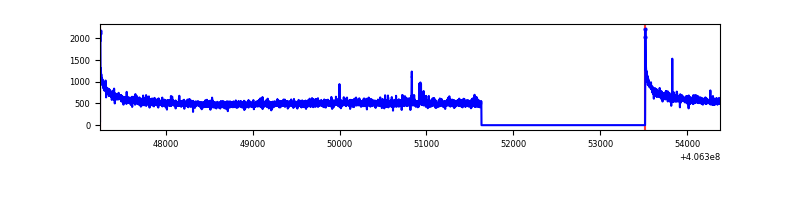 |
| B | 7131 | 5248 | 56 | 56 | 0.79% | 1.07% | 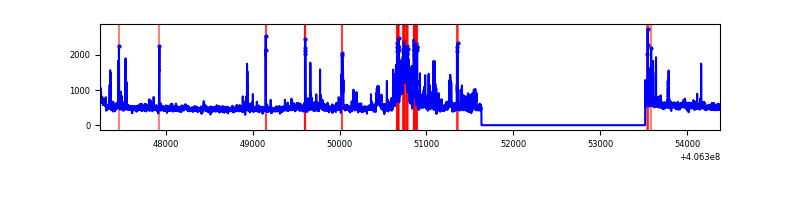 |
| C | 7131 | 5248 | 917 | 917 | 12.86% | 17.47% | 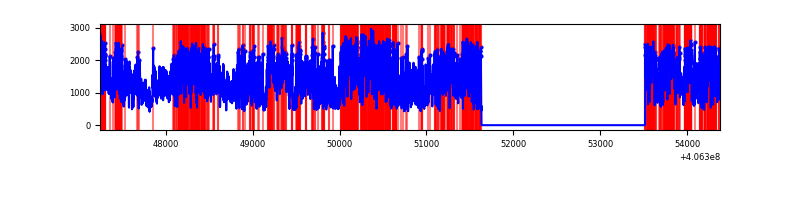 |
| D | 7131 | 5248 | 346 | 346 | 4.85% | 6.59% | 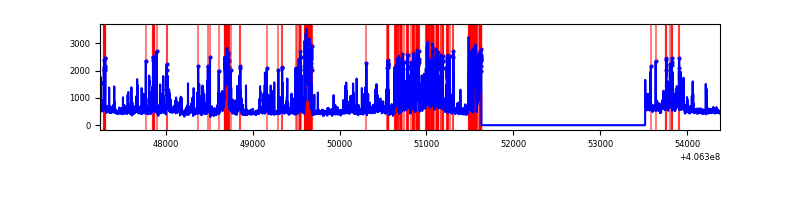 |
Top three noisy pixels from each quadrant. If the there are fewer than three noisy pixels in the level2.evt file, extra rows are filled as -1
| Pixel properties | Quadrant properties | ||||||
|---|---|---|---|---|---|---|---|
| Quadrant | DetID | PixID | Counts | Sigma | Mean | Median | Sigma |
| A | 10 | 83 | 402445 | 3193.3 | 626 | 615 | 125.8 |
| A | 13 | 6 | 14520 | 110.5 | 626 | 615 | 125.8 |
| A | 13 | 248 | 14140 | 107.48 | 626 | 615 | 125.8 |
| B | 5 | 184 | 448222 | 3836.24 | 620 | 603 | 116.7 |
| B | 15 | 32 | 45775 | 387.14 | 620 | 603 | 116.7 |
| B | 5 | 172 | 45096 | 381.32 | 620 | 603 | 116.7 |
| C | 14 | 254 | 5104838 | 37922.73 | 588 | 593 | 134.6 |
| C | 15 | 214 | 208995 | 1548.35 | 588 | 593 | 134.6 |
| C | 0 | 10 | 44399 | 325.46 | 588 | 593 | 134.6 |
| D | 1 | 47 | 1297696 | 9096.36 | 597 | 580 | 142.6 |
| D | 10 | 118 | 192921 | 1348.84 | 597 | 580 | 142.6 |
| D | 2 | 250 | 74247 | 516.61 | 597 | 580 | 142.6 |
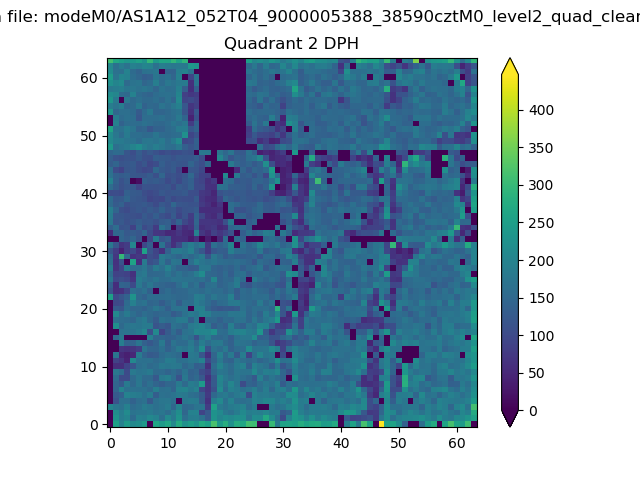
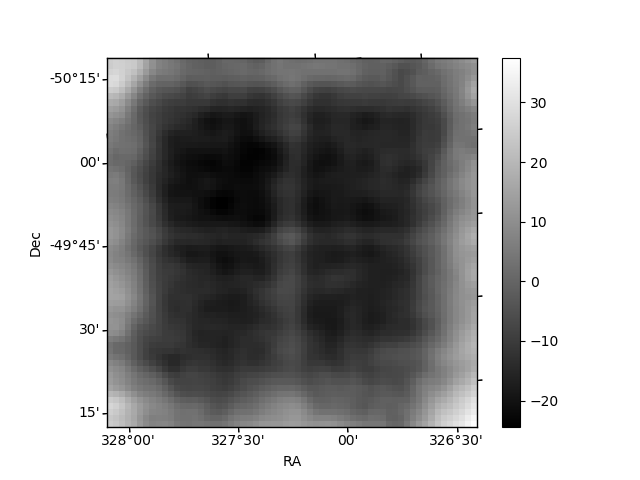
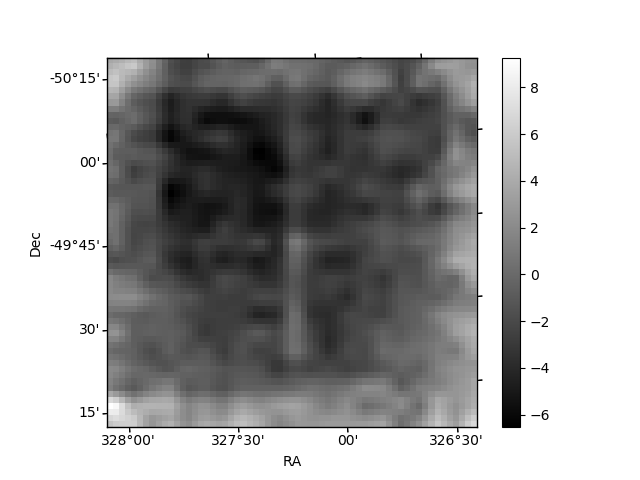
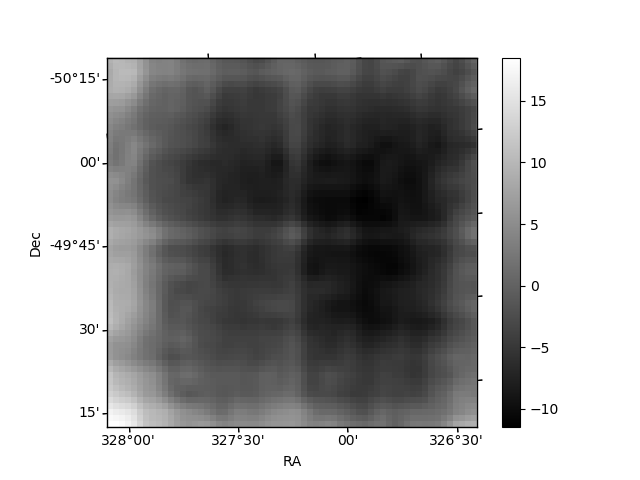
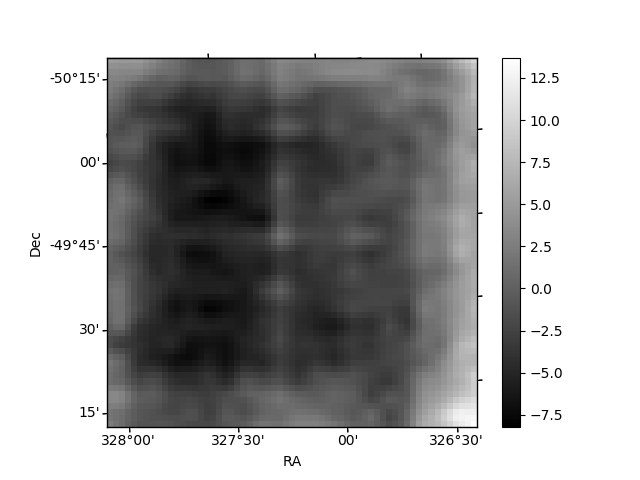
Histogram calculated using DETX and DETY for each event in the final _common_clean file
| Quadrant A | 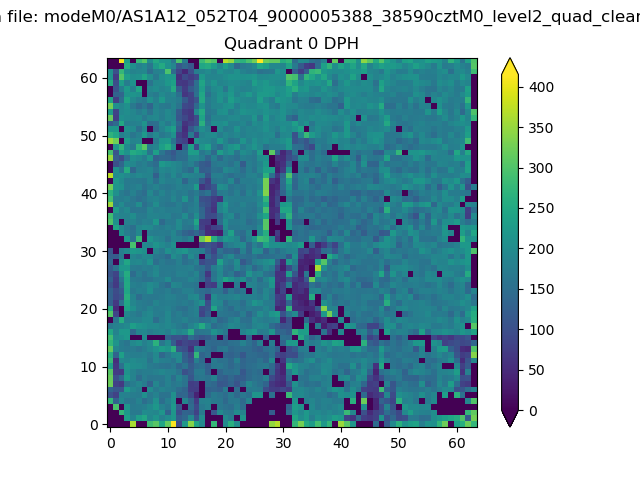 |
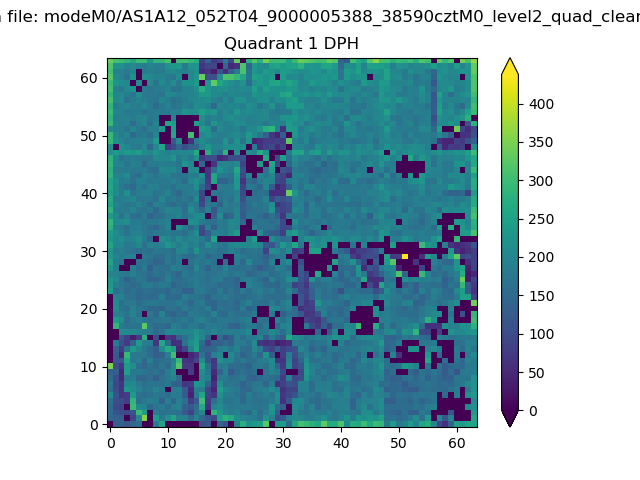 |
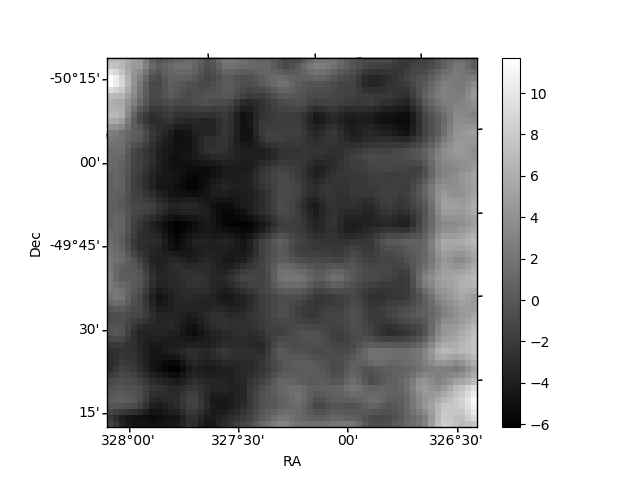
Quadrant B |
|---|---|---|---|
| Quadrant D | 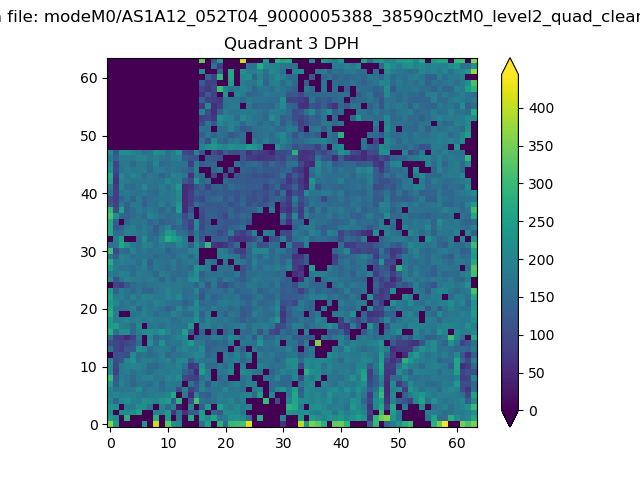 |
 |
Quadrant C |
| Plot type | Count rate plots | Images |
|---|---|---|
| Comparison with Poisson distribution Blue bars denote a histogram of data divided into 1 sec bins. Red curve is a Poisson curve with rate = median count rate of data. |
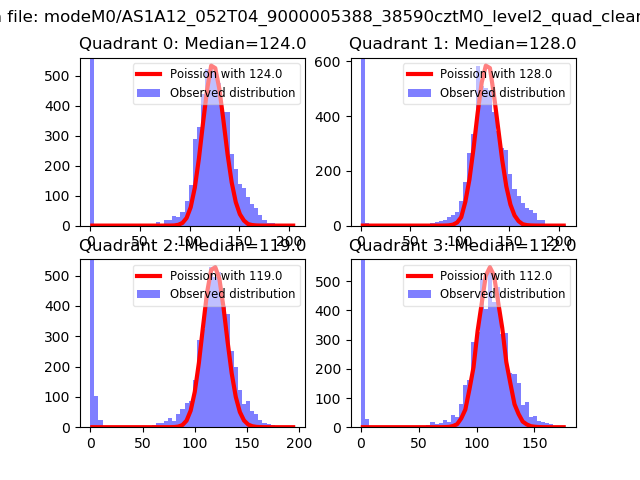 |
 |
| Quadrant-wise count rates Data is divided into 100 sec bins |
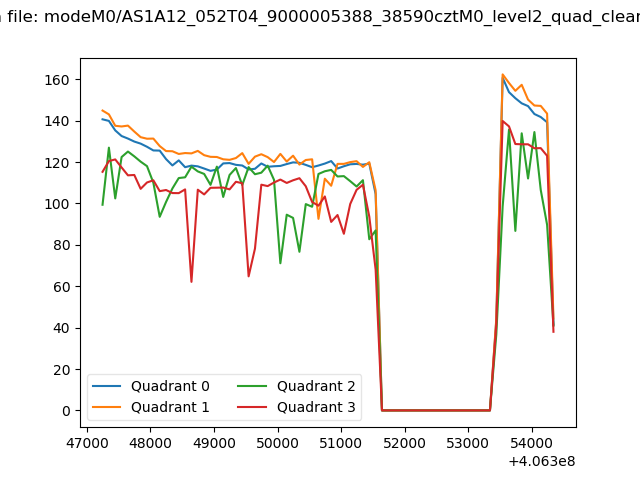 |
|
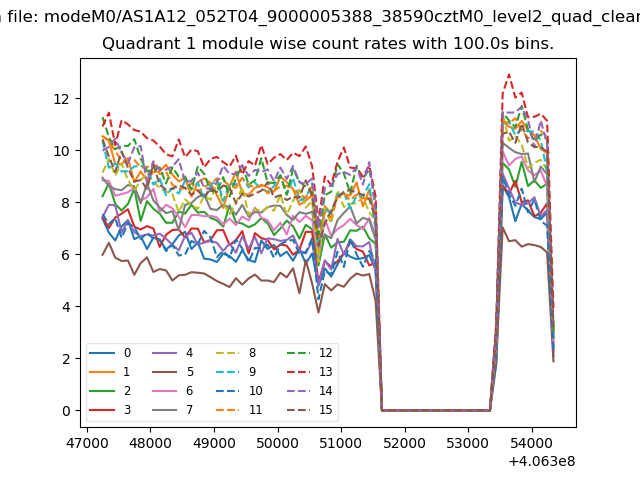
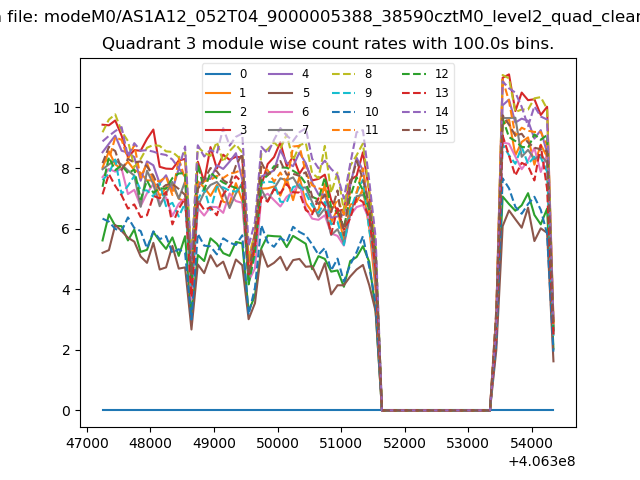
| Module-wise count rates for Quadrant A Data is divided into 100 sec bins |
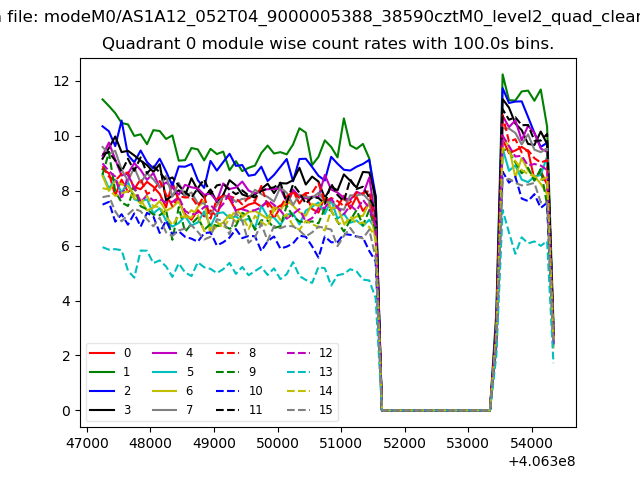 |
 |
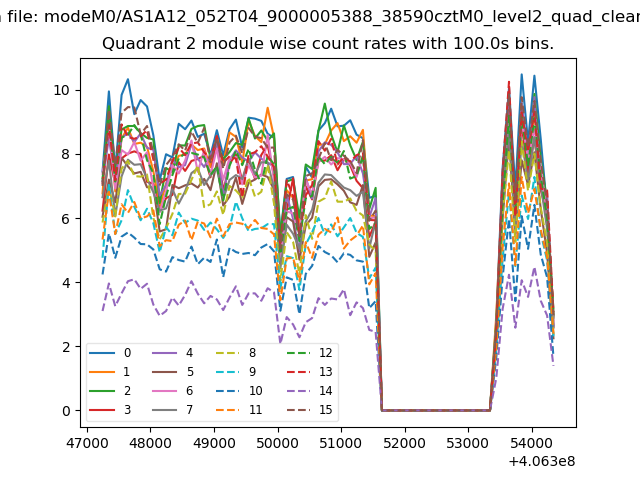
| Module-wise count rates for Quadrant B Data is divided into 100 sec bins |
 |
 |
| Module-wise count rates for Quadrant C Data is divided into 100 sec bins |
 |
 |
| Module-wise count rates for Quadrant D Data is divided into 100 sec bins |
 |
 |
| Parameter | Plot |
|---|---|
| CZT HV Monitor | 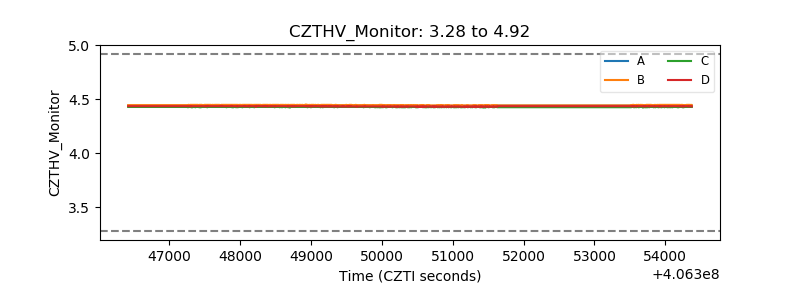 |
| D_VDD | 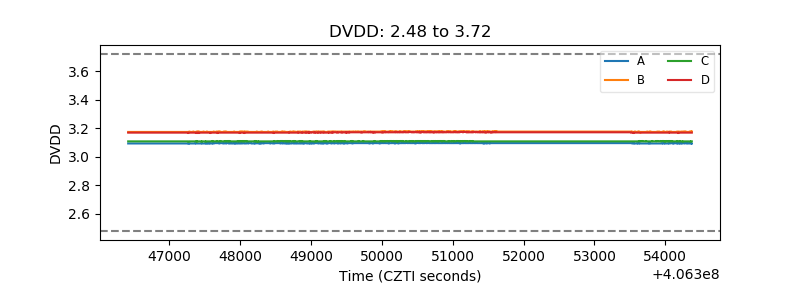 |
| Temperature 1 | 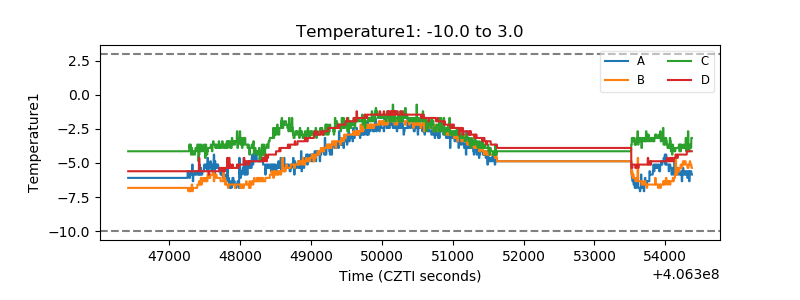 |
| Veto HV Monitor |  |
| Veto LLD | 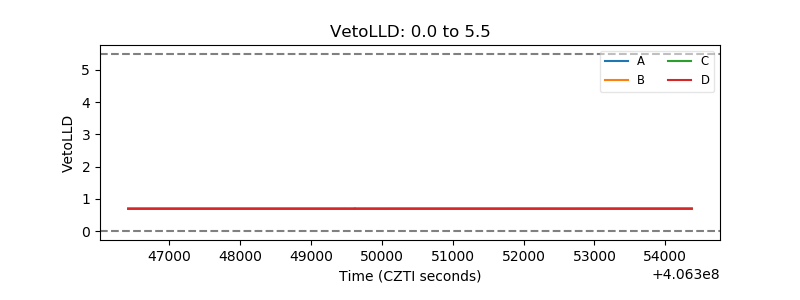 |
| Alpha Counter | 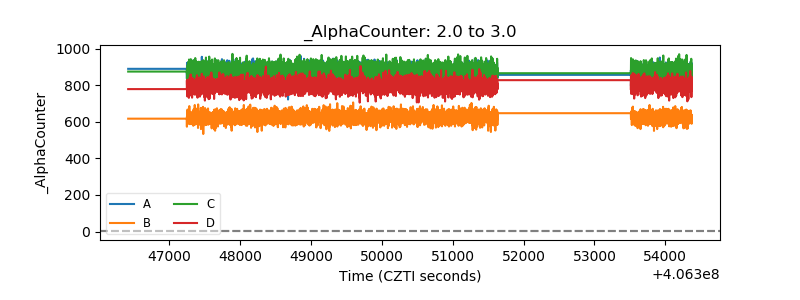 |
| _CPM_Rate | 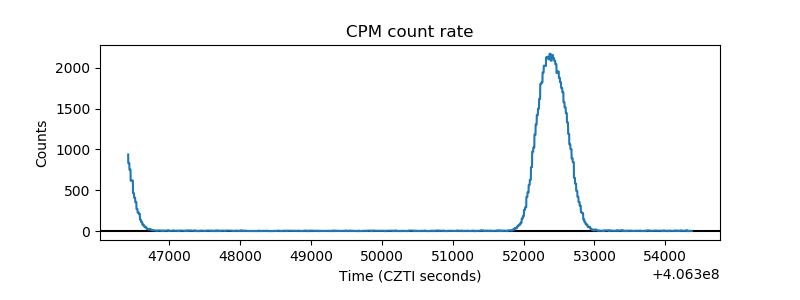 |
| CZT Counter | 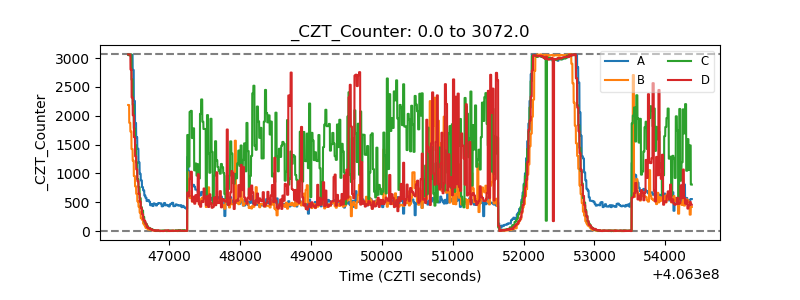 |
| +2.5 Volts monitor | 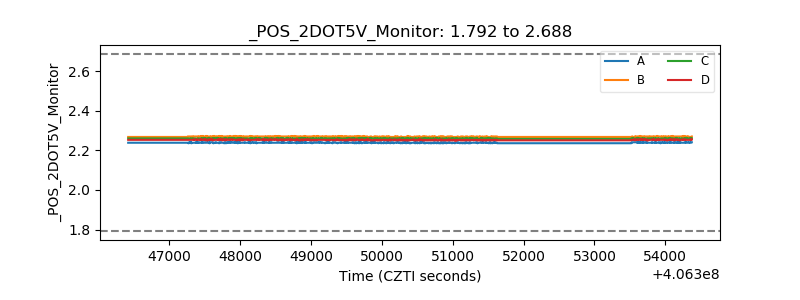 |
| +5 Volts monitor | 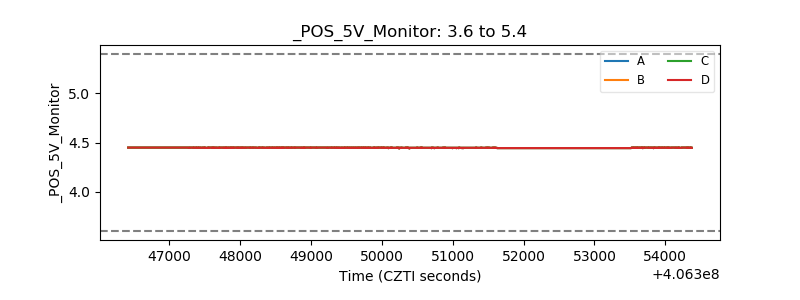 |
| _ROLL_ROT | 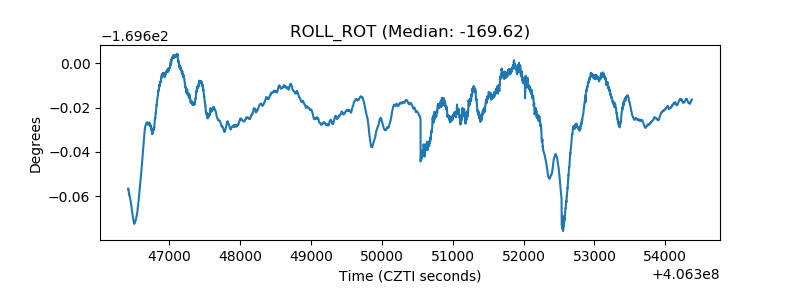 |
| _Roll_DEC | 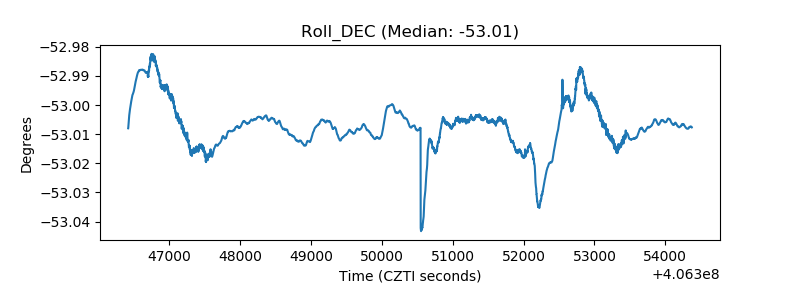 |
| _Roll_RA | 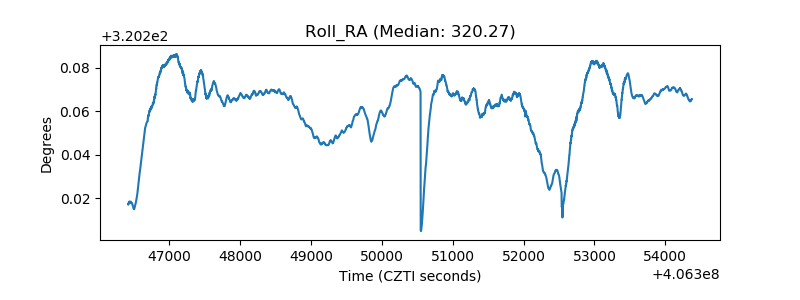 |
| Veto Counter | 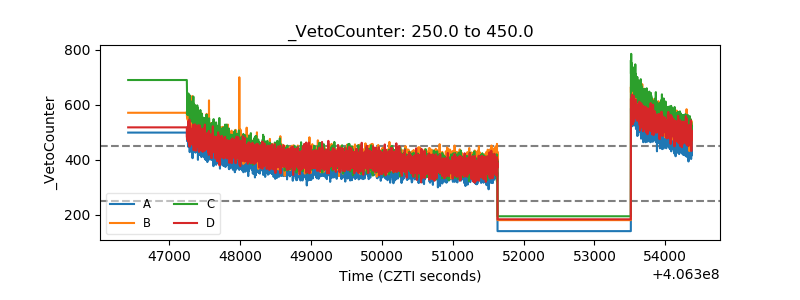 |