| Param | Original file | Final file |
|---|---|---|
| Filename | modeM0/AS1A12_052T04_9000005388_38591cztM0_level2.fits | modeM0/AS1A12_052T04_9000005388_38591cztM0_level2_quad_clean.evt |
| Size (bytes) | 494,331,840 | 95,028,480 |
| Size | 471.4 MB | 90.6 MB |
| Events in quadrant A | 2,894,488 | 684,264 |
| Events in quadrant B | 4,741,240 | 635,440 |
| Events in quadrant C | 6,463,989 | 602,394 |
| Events in quadrant D | 3,807,358 | 601,089 |
| Mode M0 | |||
|---|---|---|---|
| Quadrant | BADHDUFLAG | Total packets | Discarded packets |
| A | 0 | 11564 | 3 |
| B | 0 | 17312 | 2 |
| C | 0 | 22800 | 2 |
| D | 0 | 14593 | 2 |
| Mode SS | |||
|---|---|---|---|
| Quadrant | BADHDUFLAG | Total packets | Discarded packets |
| A | 0 | 104 | 0 |
| B | 0 | 104 | 0 |
| C | 0 | 104 | 0 |
| D | 0 | 104 | 0 |
| Mode M9 | |||
|---|---|---|---|
| Quadrant | BADHDUFLAG | Total packets | Discarded packets |
| A | 0 | 31 | 0 |
| B | 0 | 31 | 0 |
| C | 0 | 31 | 0 |
| D | 0 | 32 | 0 |
| Quadrant | Total seconds | Saturated seconds | Saturation percentage |
|---|---|---|---|
| A | 5052 | 14 | 0.277118% |
| B | 5052 | 669 | 13.242280% |
| C | 5052 | 757 | 14.984165% |
| D | 5052 | 196 | 3.879652% |
Noise dominated data is calculated using 1-second bins in cleaned event files. If a bin has >2000 counts, and if more than 50% of those come from <1% of pixels, then it is considered to be noise-dominated and hence unusable.
| Quadrant | # 1 sec bins | Bins with >0 counts | Bins with >2000 counts | High rate bins dominated by noise | Noise dominated (total time) | Noise dominated (detector-on time) | Marked lightcurve |
|---|---|---|---|---|---|---|---|
| A | 7055 | 5053 | 6 | 6 | 0.09% | 0.12% | 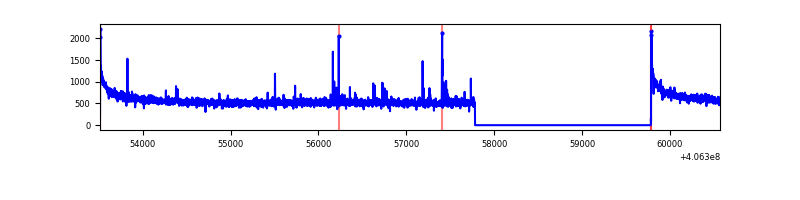 |
| B | 7054 | 5052 | 538 | 538 | 7.63% | 10.65% | 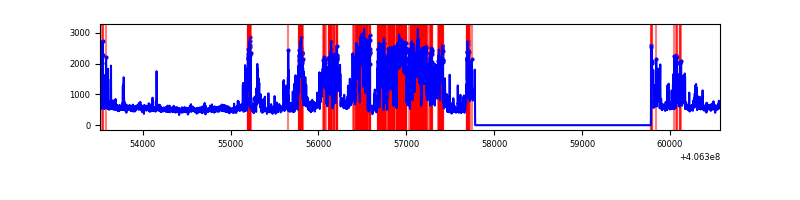 |
| C | 7054 | 5052 | 699 | 699 | 9.91% | 13.84% | 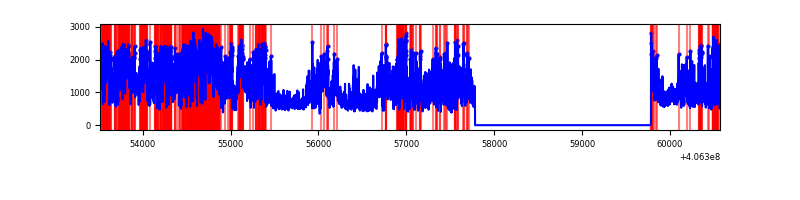 |
| D | 7054 | 5052 | 194 | 194 | 2.75% | 3.84% | 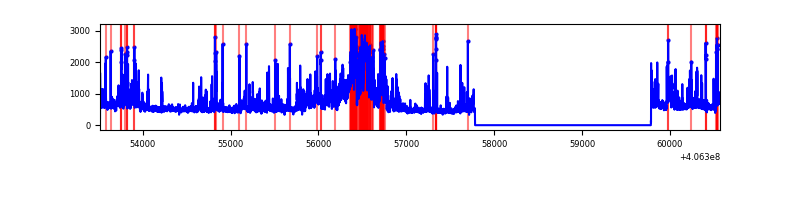 |
Top three noisy pixels from each quadrant. If the there are fewer than three noisy pixels in the level2.evt file, extra rows are filled as -1
| Pixel properties | Quadrant properties | ||||||
|---|---|---|---|---|---|---|---|
| Quadrant | DetID | PixID | Counts | Sigma | Mean | Median | Sigma |
| A | 10 | 83 | 394281 | 3131.51 | 632 | 623 | 125.7 |
| A | 13 | 248 | 38020 | 297.49 | 632 | 623 | 125.7 |
| A | 13 | 254 | 8133 | 59.74 | 632 | 623 | 125.7 |
| B | 5 | 184 | 2017070 | 18073.63 | 598 | 584 | 111.6 |
| B | 5 | 172 | 179537 | 1603.94 | 598 | 584 | 111.6 |
| B | 4 | 251 | 79155 | 704.23 | 598 | 584 | 111.6 |
| C | 14 | 254 | 3874762 | 28492.11 | 596 | 601 | 136.0 |
| C | 15 | 214 | 202843 | 1487.37 | 596 | 601 | 136.0 |
| C | 0 | 10 | 44157 | 320.33 | 596 | 601 | 136.0 |
| D | 1 | 47 | 939086 | 6385.79 | 612 | 596 | 147.0 |
| D | 10 | 118 | 111647 | 755.63 | 612 | 596 | 147.0 |
| D | 12 | 235 | 70249 | 473.94 | 612 | 596 | 147.0 |
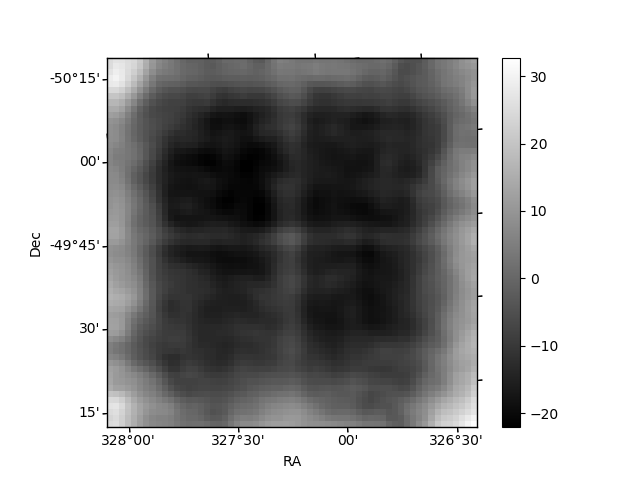
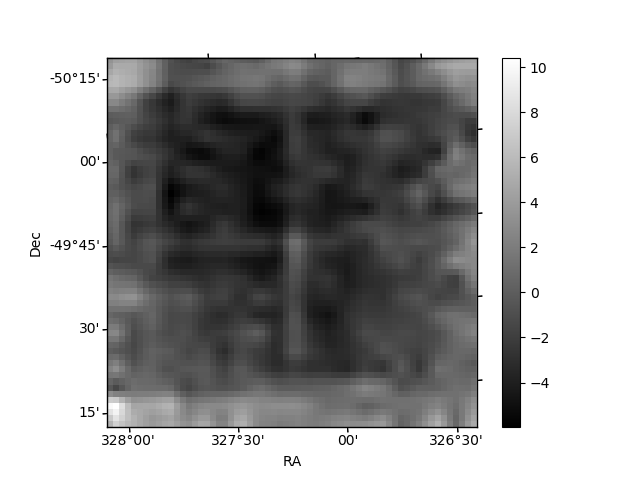
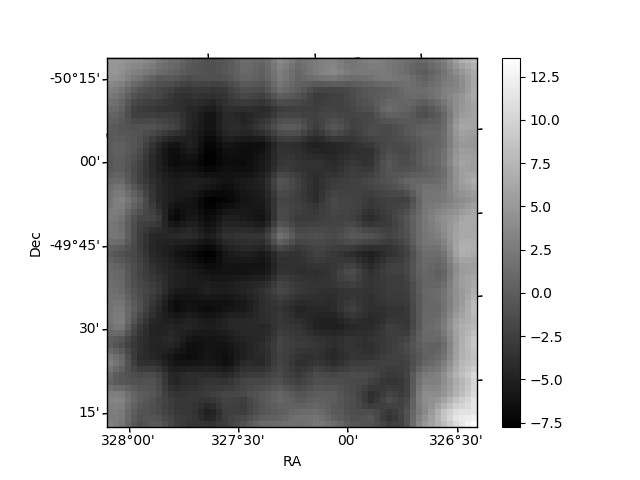
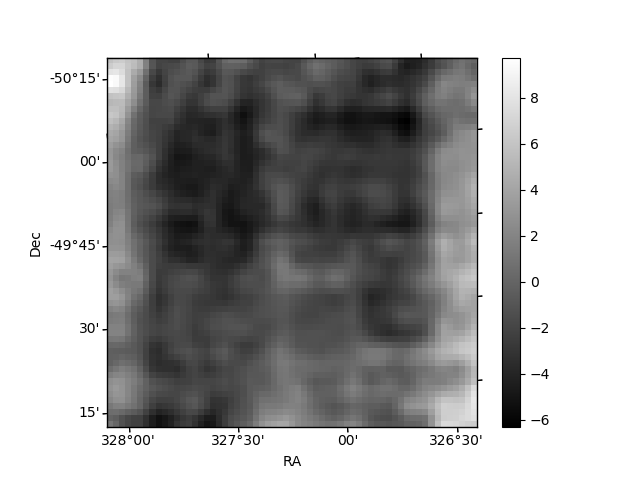
Histogram calculated using DETX and DETY for each event in the final _common_clean file
| Quadrant A | 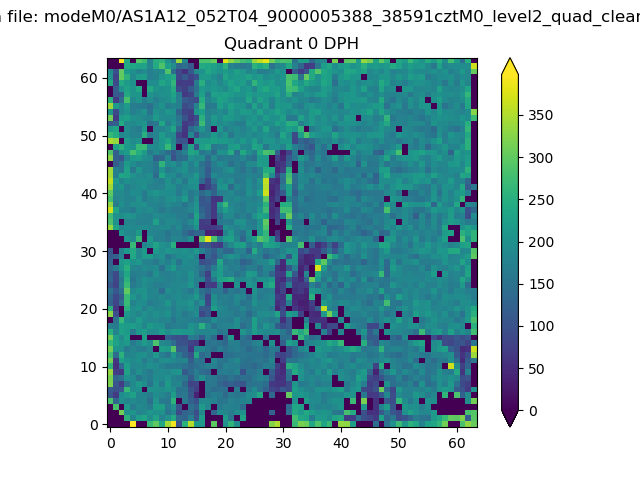 |
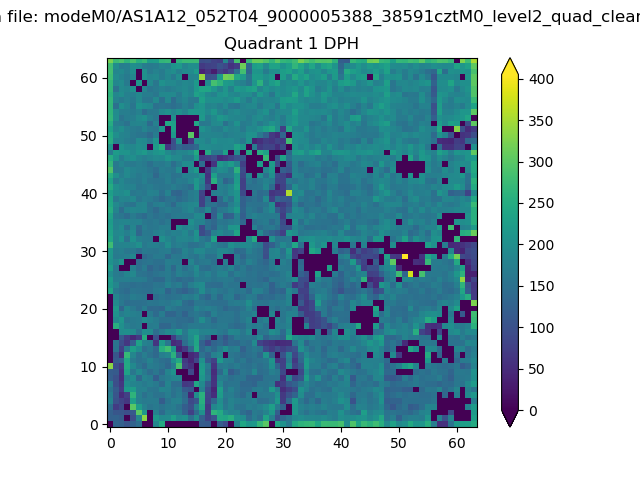 |
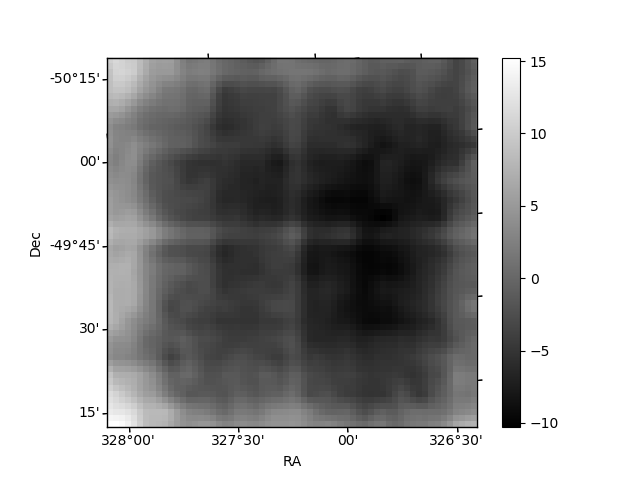
Quadrant B |
|---|---|---|---|
| Quadrant D | 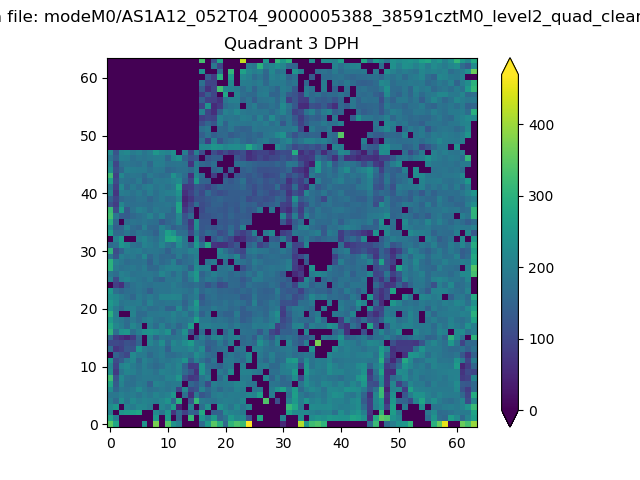 |
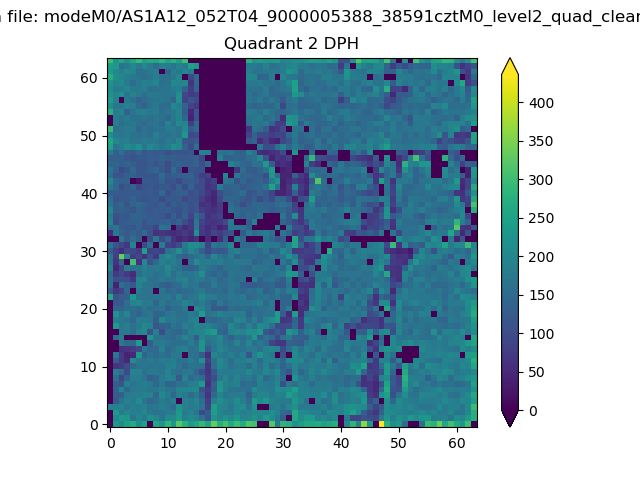 |
Quadrant C |
| Plot type | Count rate plots | Images |
|---|---|---|
| Comparison with Poisson distribution Blue bars denote a histogram of data divided into 1 sec bins. Red curve is a Poisson curve with rate = median count rate of data. |
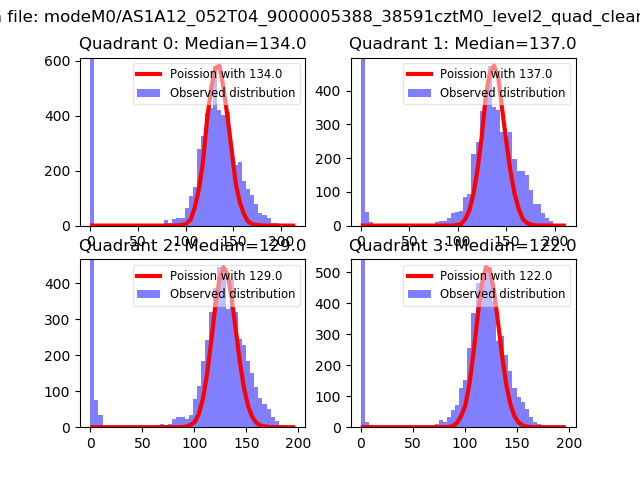 |
 |
| Quadrant-wise count rates Data is divided into 100 sec bins |
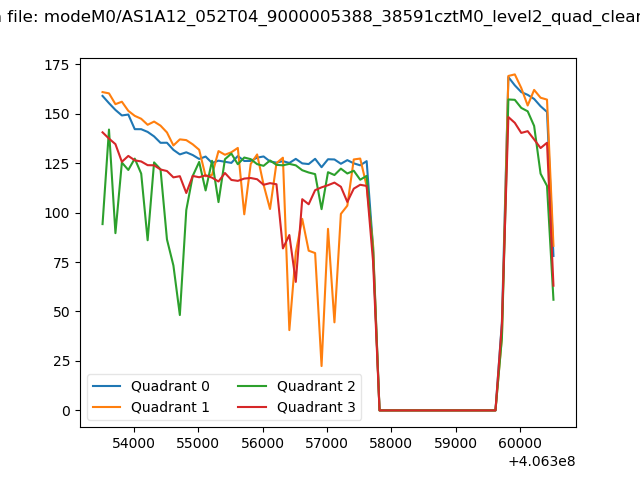 |
|
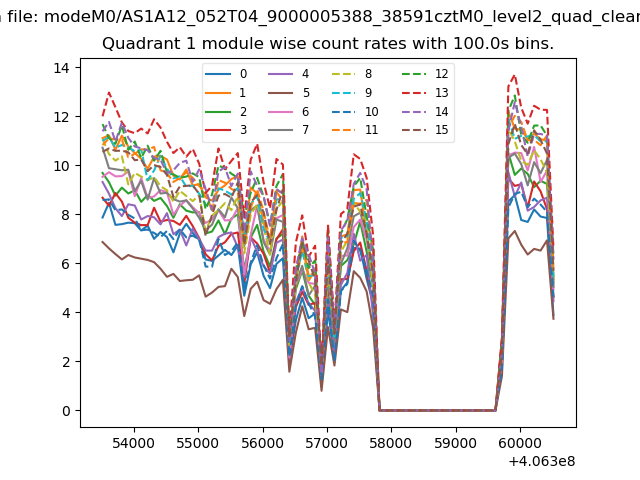
| Module-wise count rates for Quadrant A Data is divided into 100 sec bins |
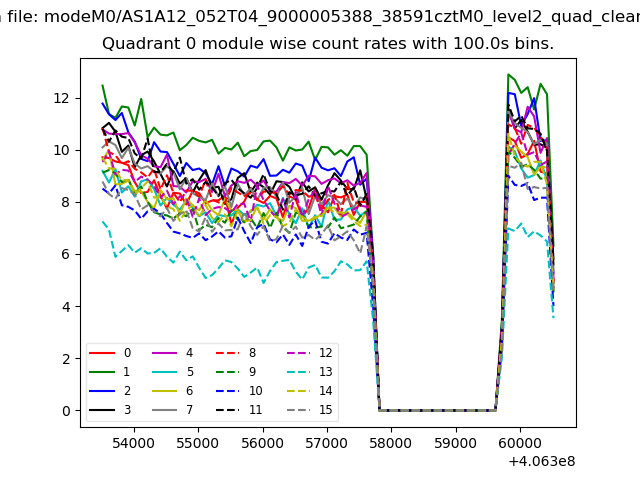 |
 |
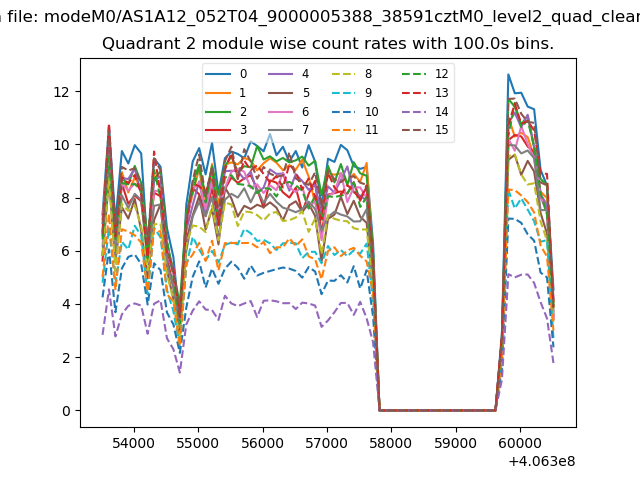
| Module-wise count rates for Quadrant B Data is divided into 100 sec bins |
 |
 |
| Module-wise count rates for Quadrant C Data is divided into 100 sec bins |
 |
 |
| Module-wise count rates for Quadrant D Data is divided into 100 sec bins |
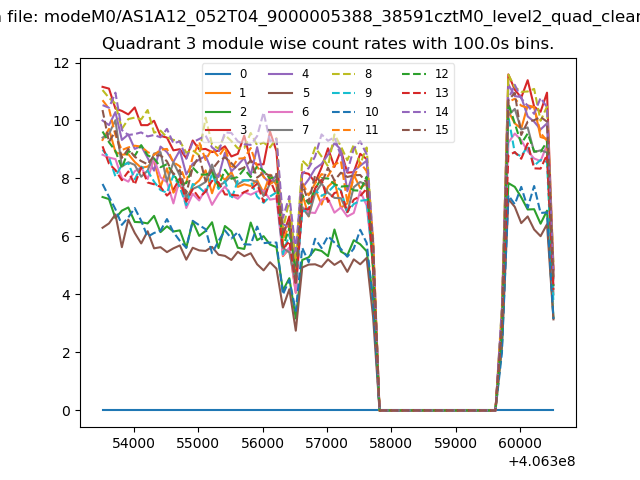 |
 |
| Parameter | Plot |
|---|---|
| CZT HV Monitor | 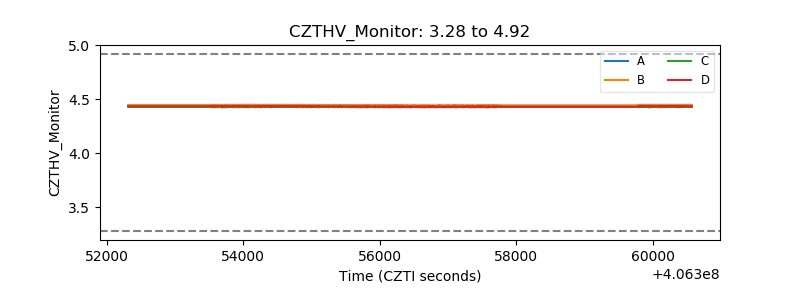 |
| D_VDD | 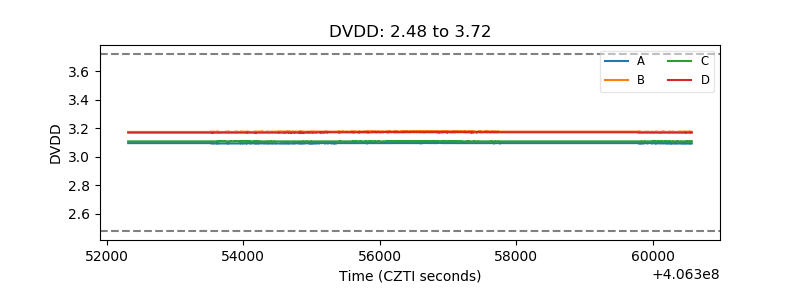 |
| Temperature 1 |  |
| Veto HV Monitor | 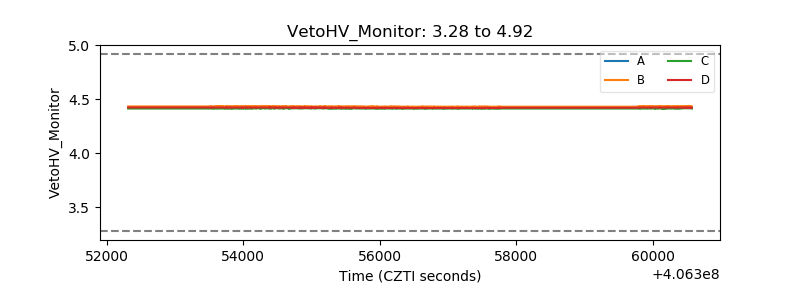 |
| Veto LLD | 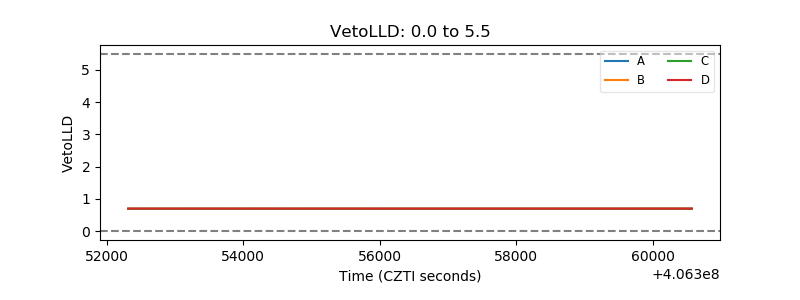 |
| Alpha Counter | 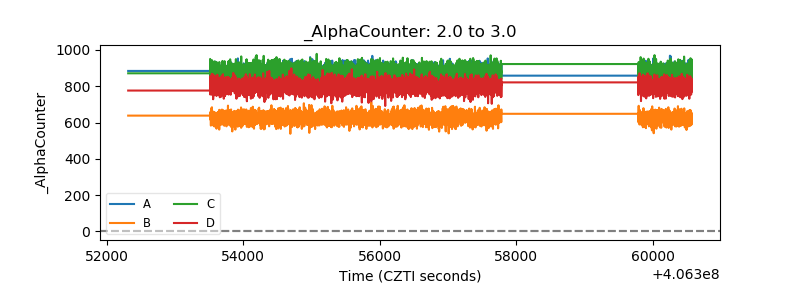 |
| _CPM_Rate | 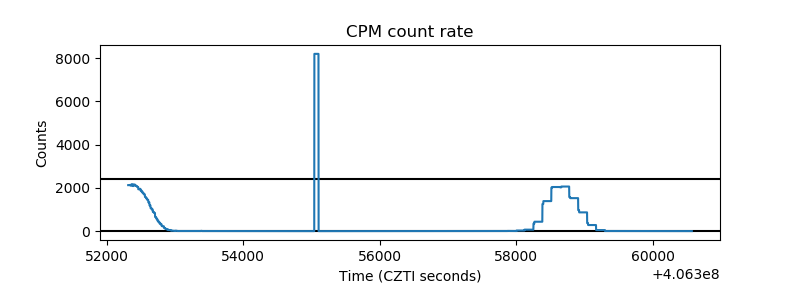 |
| CZT Counter | 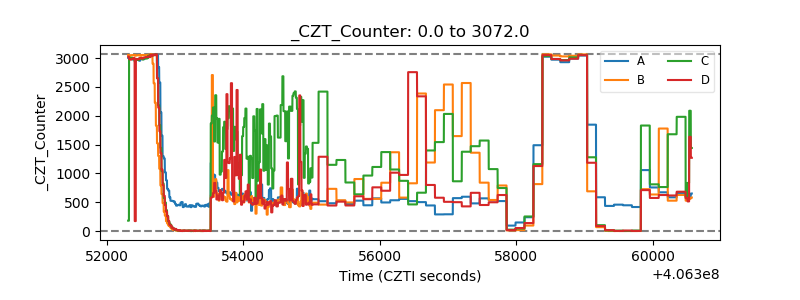 |
| +2.5 Volts monitor | 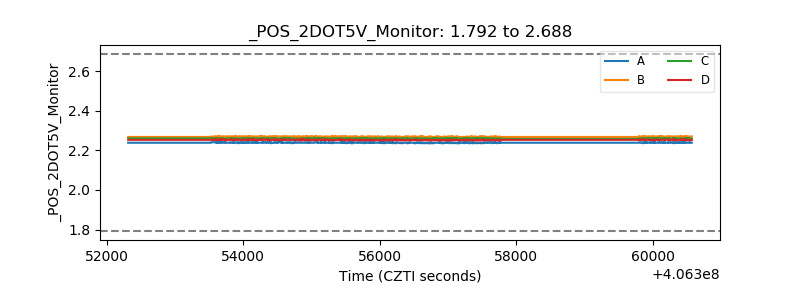 |
| +5 Volts monitor | 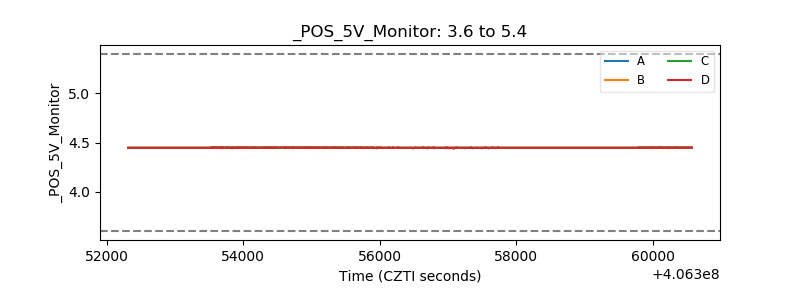 |
| _ROLL_ROT | 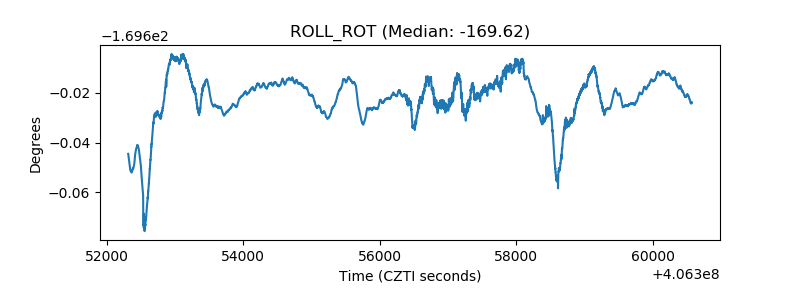 |
| _Roll_DEC | 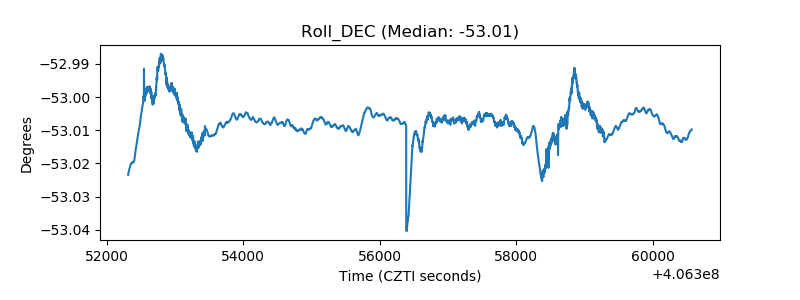 |
| _Roll_RA | 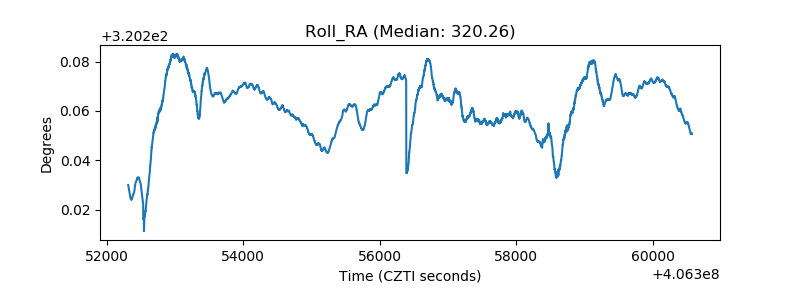 |
| Veto Counter | 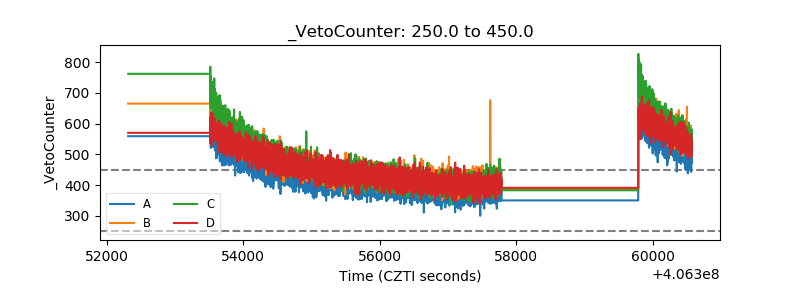 |