| Param | Original file | Final file |
|---|---|---|
| Filename | modeM0/AS1A12_052T04_9000005388_38592cztM0_level2.fits | modeM0/AS1A12_052T04_9000005388_38592cztM0_level2_quad_clean.evt |
| Size (bytes) | 463,812,480 | 96,773,760 |
| Size | 442.3 MB | 92.3 MB |
| Events in quadrant A | 2,882,112 | 691,547 |
| Events in quadrant B | 3,983,884 | 674,601 |
| Events in quadrant C | 4,447,366 | 652,083 |
| Events in quadrant D | 5,473,658 | 567,148 |
| Mode M0 | |||
|---|---|---|---|
| Quadrant | BADHDUFLAG | Total packets | Discarded packets |
| A | 0 | 11472 | 3 |
| B | 0 | 15052 | 2 |
| C | 0 | 16560 | 2 |
| D | 0 | 19697 | 2 |
| Mode SS | |||
|---|---|---|---|
| Quadrant | BADHDUFLAG | Total packets | Discarded packets |
| A | 0 | 100 | 0 |
| B | 0 | 100 | 0 |
| C | 0 | 100 | 0 |
| D | 0 | 100 | 0 |
| Mode M9 | |||
|---|---|---|---|
| Quadrant | BADHDUFLAG | Total packets | Discarded packets |
| A | 0 | 25 | 0 |
| B | 0 | 25 | 0 |
| C | 0 | 25 | 0 |
| D | 0 | 26 | 0 |
| Quadrant | Total seconds | Saturated seconds | Saturation percentage |
|---|---|---|---|
| A | 4923 | 22 | 0.446882% |
| B | 4923 | 363 | 7.373553% |
| C | 4923 | 273 | 5.545399% |
| D | 4923 | 659 | 13.386147% |
Noise dominated data is calculated using 1-second bins in cleaned event files. If a bin has >2000 counts, and if more than 50% of those come from <1% of pixels, then it is considered to be noise-dominated and hence unusable.
| Quadrant | # 1 sec bins | Bins with >0 counts | Bins with >2000 counts | High rate bins dominated by noise | Noise dominated (total time) | Noise dominated (detector-on time) | Marked lightcurve |
|---|---|---|---|---|---|---|---|
| A | 7016 | 4924 | 13 | 13 | 0.19% | 0.26% | 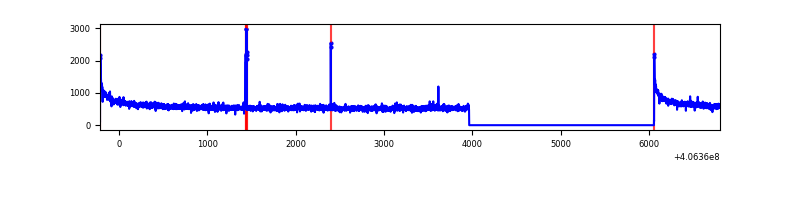 |
| B | 7016 | 4924 | 280 | 280 | 3.99% | 5.69% | 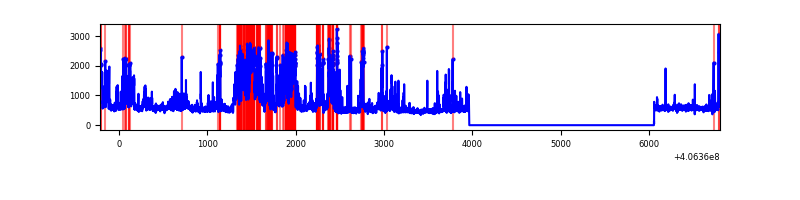 |
| C | 7016 | 4924 | 233 | 233 | 3.32% | 4.73% | 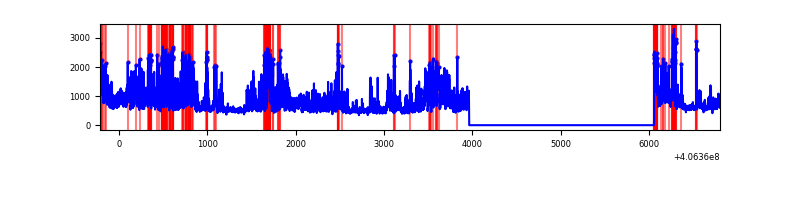 |
| D | 7016 | 4924 | 719 | 719 | 10.25% | 14.60% | 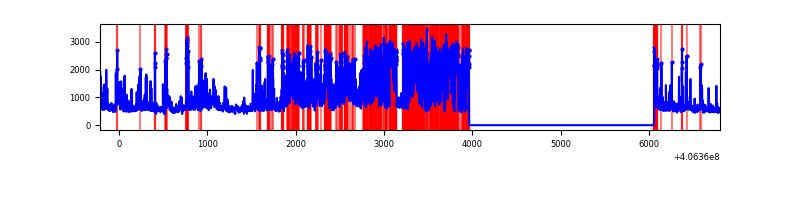 |
Top three noisy pixels from each quadrant. If the there are fewer than three noisy pixels in the level2.evt file, extra rows are filled as -1
| Pixel properties | Quadrant properties | ||||||
|---|---|---|---|---|---|---|---|
| Quadrant | DetID | PixID | Counts | Sigma | Mean | Median | Sigma |
| A | 10 | 83 | 400277 | 3168.65 | 631 | 621 | 126.1 |
| A | 13 | 248 | 38123 | 297.33 | 631 | 621 | 126.1 |
| A | 13 | 254 | 7928 | 57.93 | 631 | 621 | 126.1 |
| B | 5 | 184 | 1265757 | 11169.65 | 612 | 600 | 113.3 |
| B | 5 | 172 | 78228 | 685.35 | 612 | 600 | 113.3 |
| B | 15 | 32 | 63028 | 551.16 | 612 | 600 | 113.3 |
| C | 14 | 254 | 1699717 | 12392.16 | 602 | 606 | 137.1 |
| C | 15 | 214 | 201834 | 1467.62 | 602 | 606 | 137.1 |
| C | 1 | 23 | 111087 | 805.77 | 602 | 606 | 137.1 |
| D | 1 | 47 | 1905421 | 13403.48 | 588 | 574 | 142.1 |
| D | 1 | 20 | 293982 | 2064.57 | 588 | 574 | 142.1 |
| D | 5 | 222 | 213151 | 1495.8 | 588 | 574 | 142.1 |
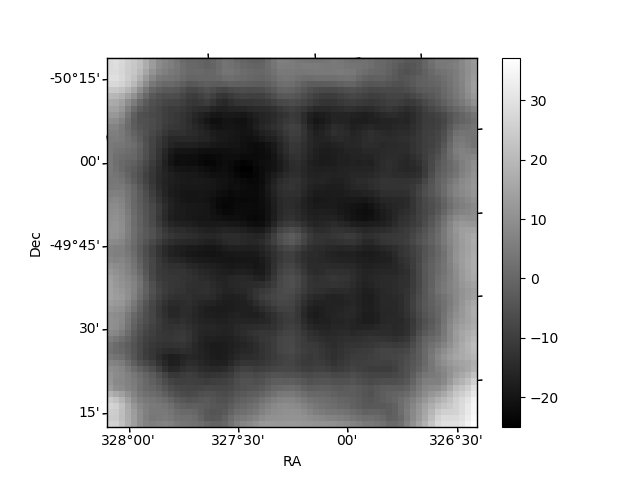
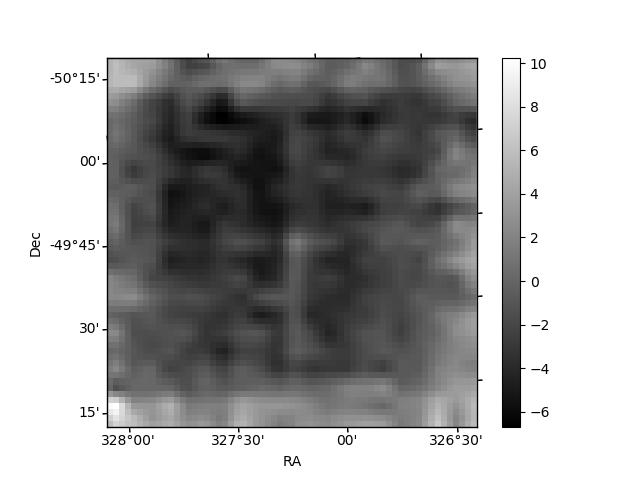
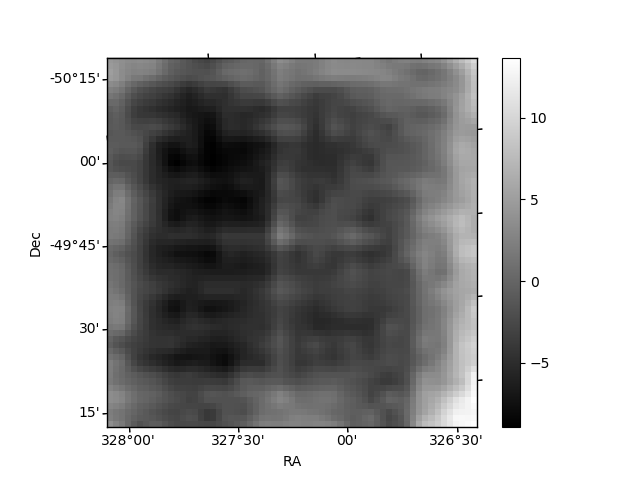
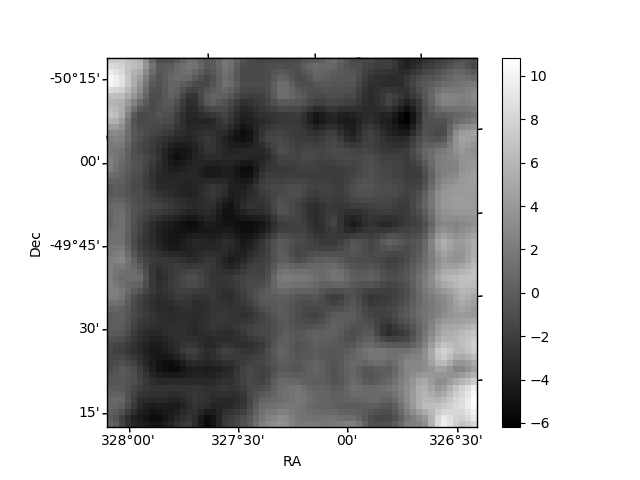
Histogram calculated using DETX and DETY for each event in the final _common_clean file
| Quadrant A | 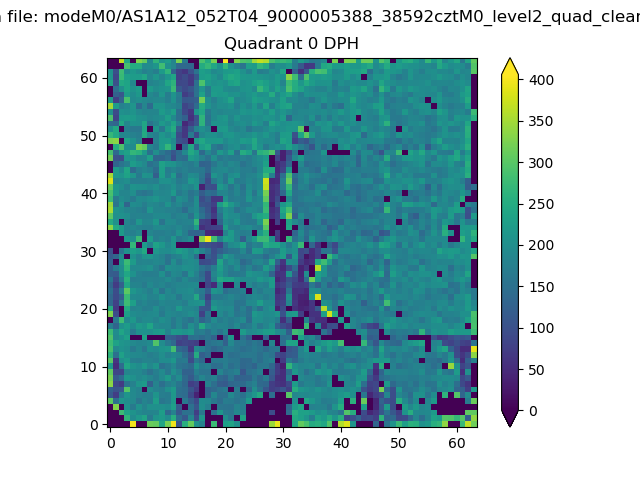 |
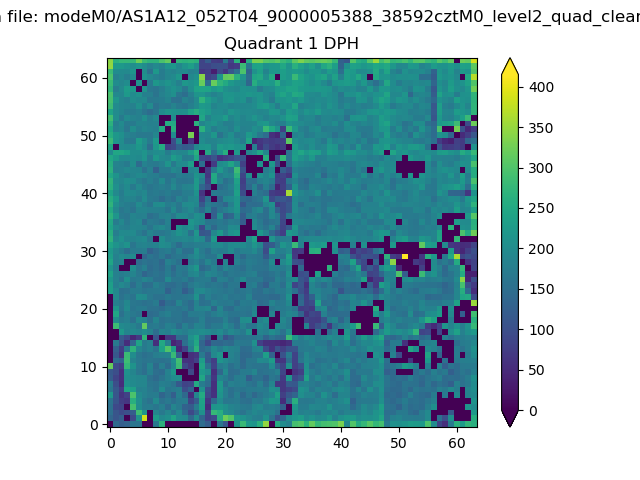 |
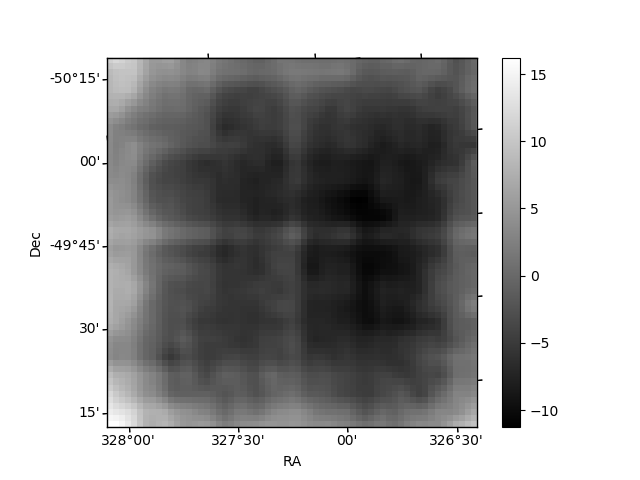
Quadrant B |
|---|---|---|---|
| Quadrant D | 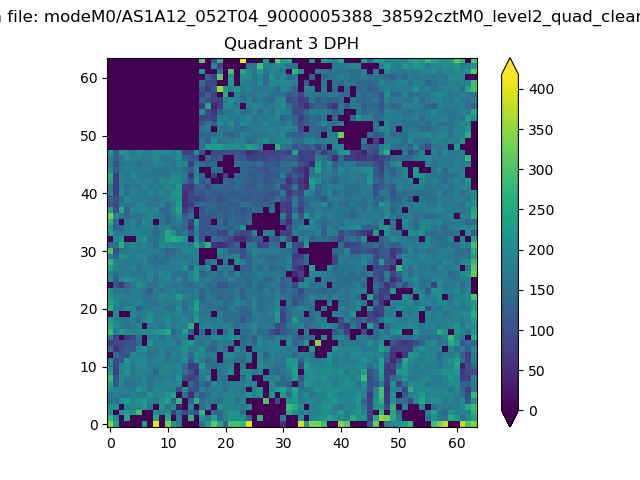 |
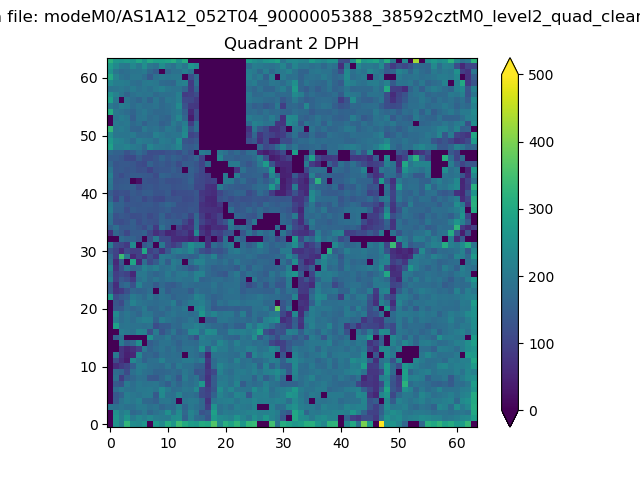 |
Quadrant C |
| Plot type | Count rate plots | Images |
|---|---|---|
| Comparison with Poisson distribution Blue bars denote a histogram of data divided into 1 sec bins. Red curve is a Poisson curve with rate = median count rate of data. |
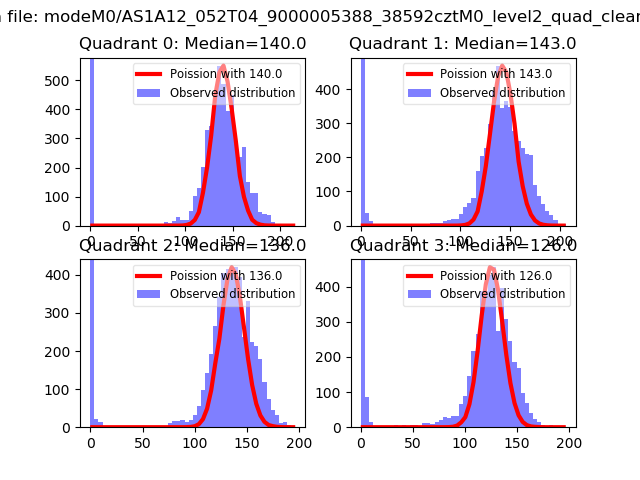 |
 |
| Quadrant-wise count rates Data is divided into 100 sec bins |
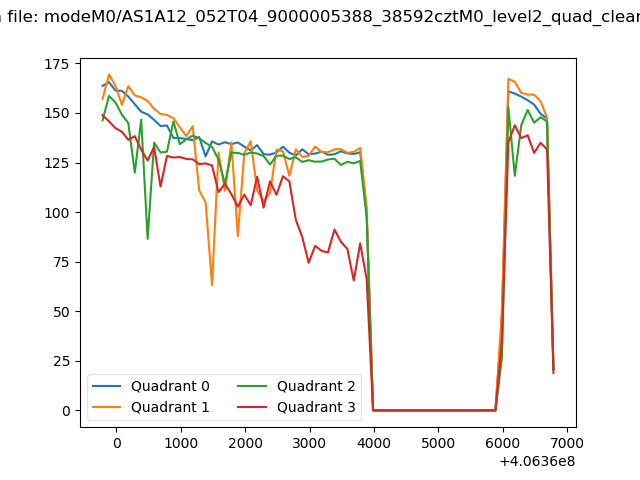 |
|
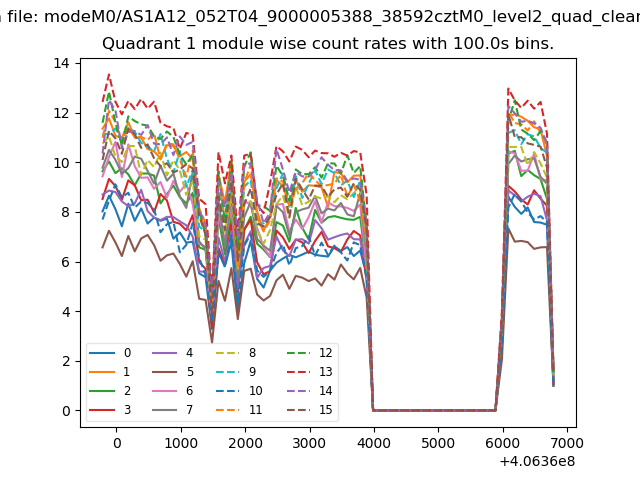
| Module-wise count rates for Quadrant A Data is divided into 100 sec bins |
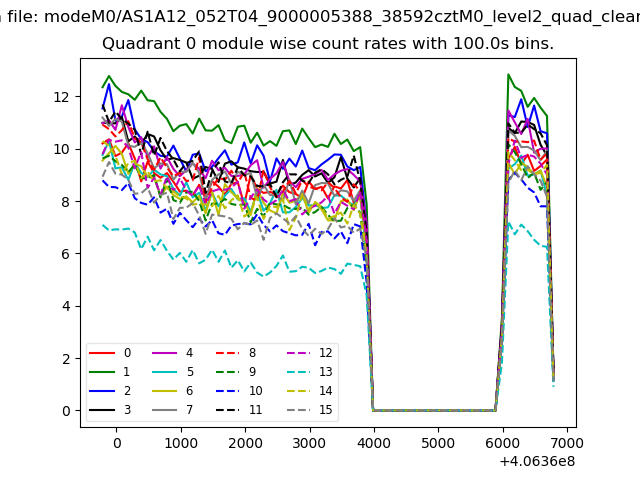 |
 |
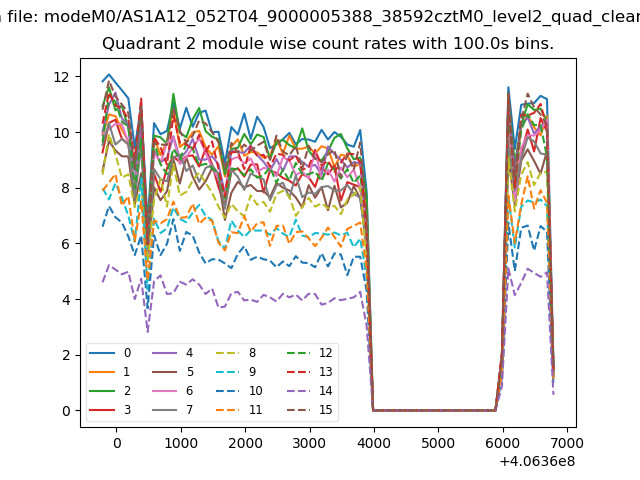
| Module-wise count rates for Quadrant B Data is divided into 100 sec bins |
 |
 |
| Module-wise count rates for Quadrant C Data is divided into 100 sec bins |
 |
 |
| Module-wise count rates for Quadrant D Data is divided into 100 sec bins |
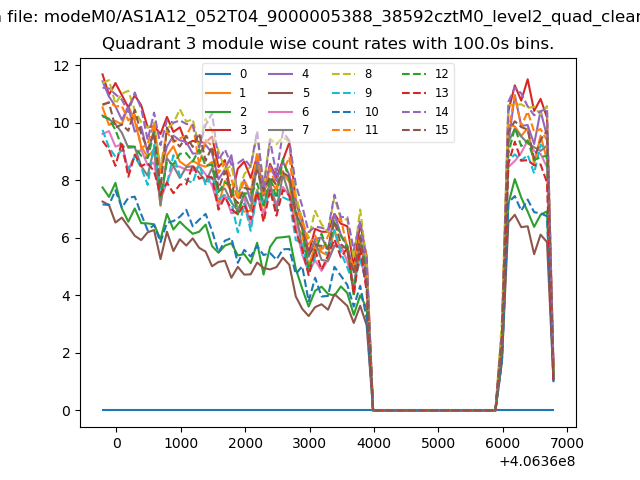 |
 |
| Parameter | Plot |
|---|---|
| CZT HV Monitor | 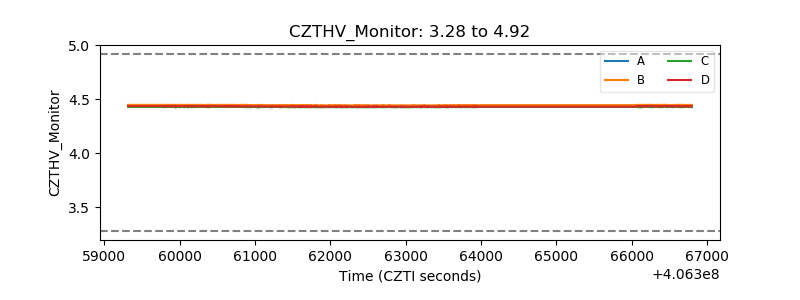 |
| D_VDD | 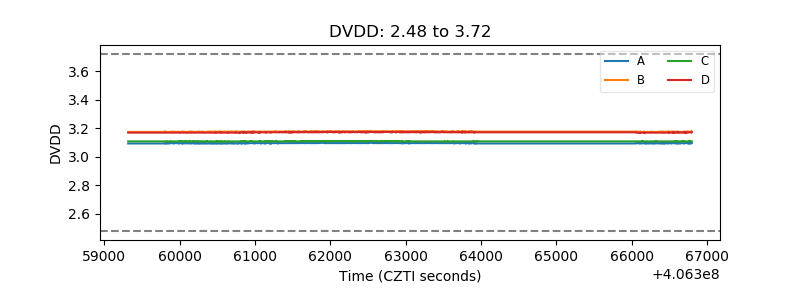 |
| Temperature 1 |  |
| Veto HV Monitor | 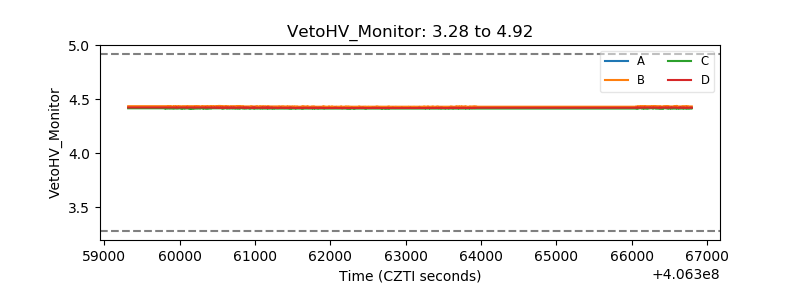 |
| Veto LLD | 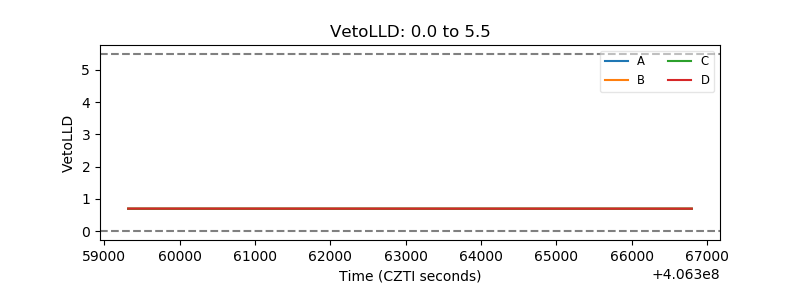 |
| Alpha Counter | 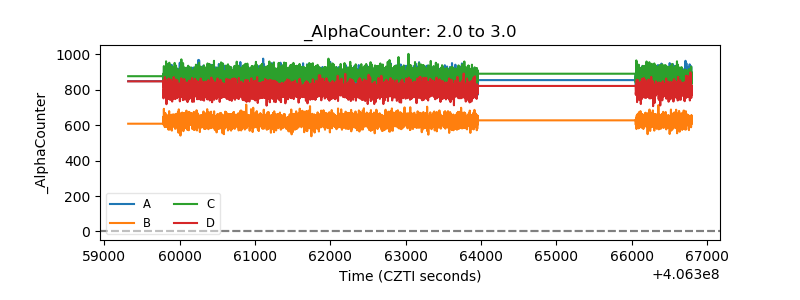 |
| _CPM_Rate | 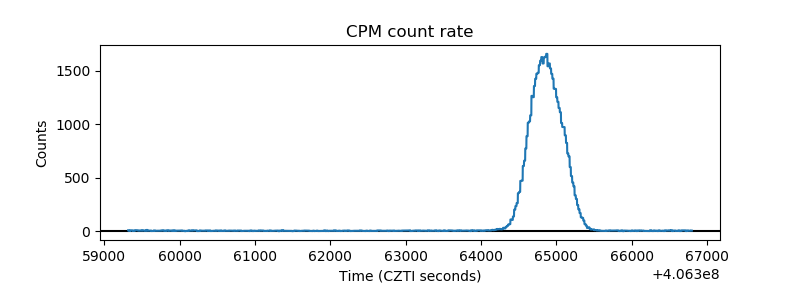 |
| CZT Counter | 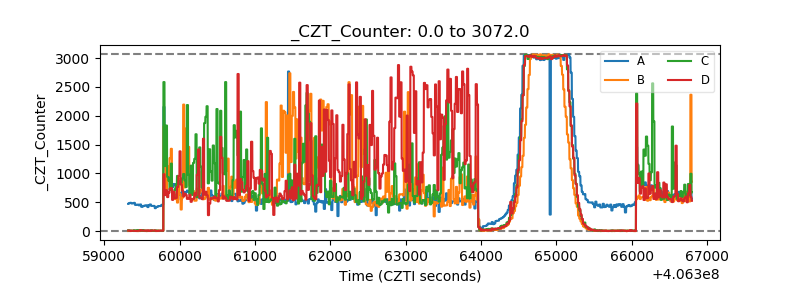 |
| +2.5 Volts monitor | 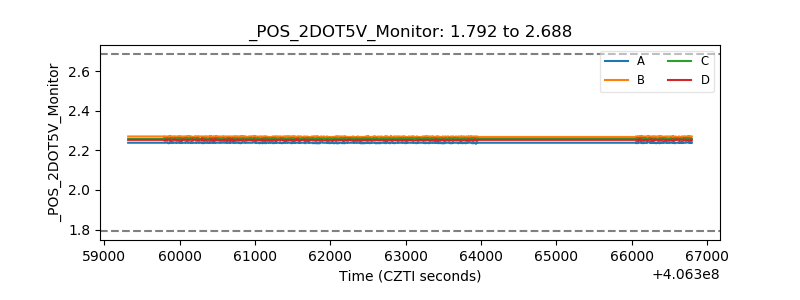 |
| +5 Volts monitor | 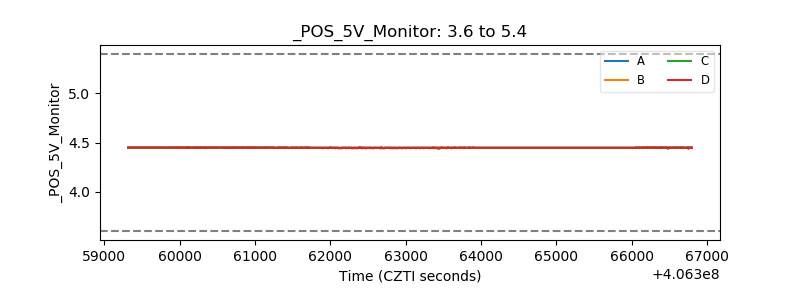 |
| _ROLL_ROT | 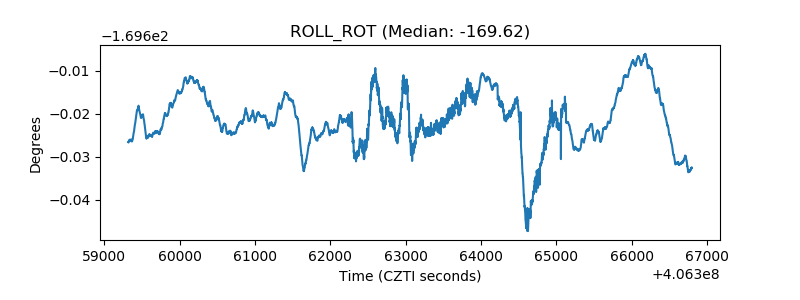 |
| _Roll_DEC | 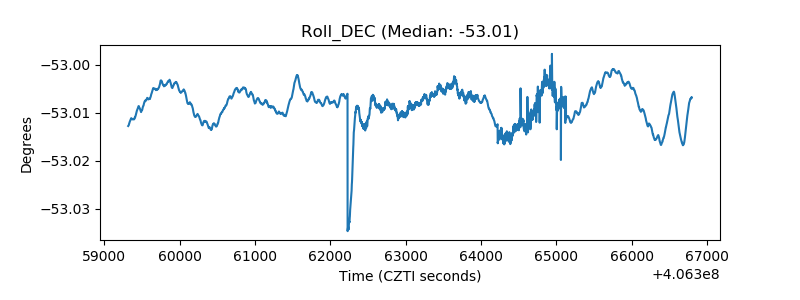 |
| _Roll_RA | 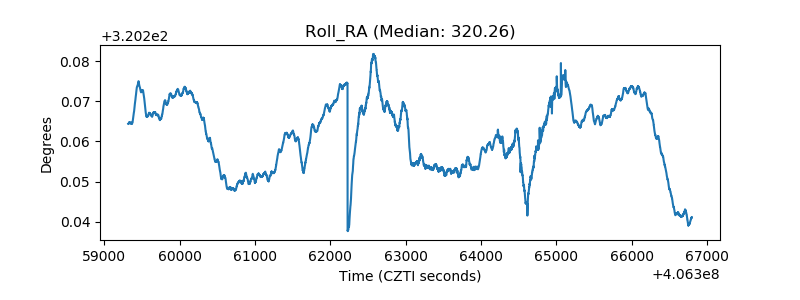 |
| Veto Counter | 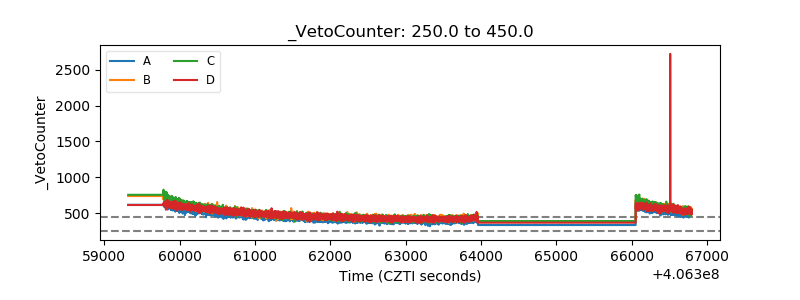 |