| Param | Original file | Final file |
|---|---|---|
| Filename | modeM0/AS1A12_052T04_9000005388_38593cztM0_level2.fits | modeM0/AS1A12_052T04_9000005388_38593cztM0_level2_quad_clean.evt |
| Size (bytes) | 471,620,160 | 92,329,920 |
| Size | 449.8 MB | 88.1 MB |
| Events in quadrant A | 2,868,744 | 665,529 |
| Events in quadrant B | 4,818,739 | 586,933 |
| Events in quadrant C | 4,749,662 | 633,686 |
| Events in quadrant D | 4,643,068 | 568,392 |
| Mode M0 | |||
|---|---|---|---|
| Quadrant | BADHDUFLAG | Total packets | Discarded packets |
| A | 0 | 11434 | 3 |
| B | 0 | 17444 | 2 |
| C | 0 | 17561 | 2 |
| D | 0 | 17173 | 2 |
| Mode SS | |||
|---|---|---|---|
| Quadrant | BADHDUFLAG | Total packets | Discarded packets |
| A | 0 | 98 | 0 |
| B | 0 | 98 | 0 |
| C | 0 | 98 | 0 |
| D | 0 | 98 | 0 |
| Mode M9 | |||
|---|---|---|---|
| Quadrant | BADHDUFLAG | Total packets | Discarded packets |
| A | 0 | 30 | 0 |
| B | 0 | 30 | 0 |
| C | 0 | 30 | 0 |
| D | 0 | 31 | 0 |
| Quadrant | Total seconds | Saturated seconds | Saturation percentage |
|---|---|---|---|
| A | 4871 | 21 | 0.431123% |
| B | 4871 | 821 | 16.854855% |
| C | 4871 | 218 | 4.475467% |
| D | 4871 | 356 | 7.308561% |
Noise dominated data is calculated using 1-second bins in cleaned event files. If a bin has >2000 counts, and if more than 50% of those come from <1% of pixels, then it is considered to be noise-dominated and hence unusable.
| Quadrant | # 1 sec bins | Bins with >0 counts | Bins with >2000 counts | High rate bins dominated by noise | Noise dominated (total time) | Noise dominated (detector-on time) | Marked lightcurve |
|---|---|---|---|---|---|---|---|
| A | 7024 | 4872 | 7 | 7 | 0.10% | 0.14% | 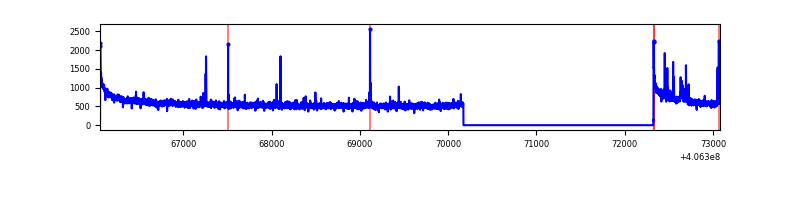 |
| B | 7024 | 4872 | 627 | 627 | 8.93% | 12.87% | 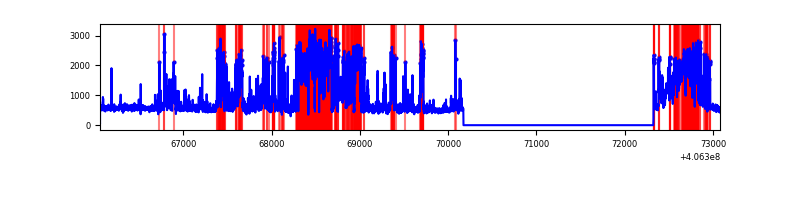 |
| C | 7024 | 4872 | 251 | 251 | 3.57% | 5.15% | 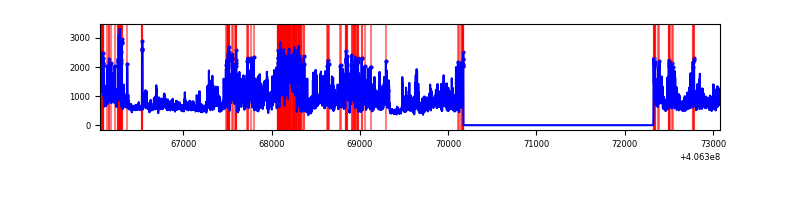 |
| D | 7024 | 4872 | 398 | 398 | 5.67% | 8.17% | 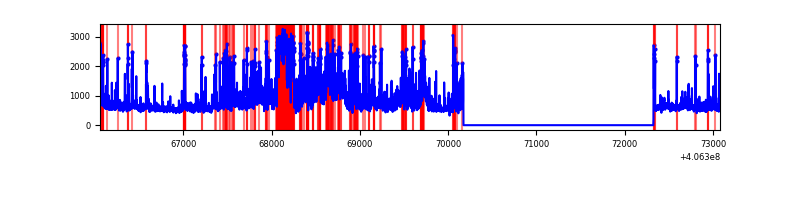 |
Top three noisy pixels from each quadrant. If the there are fewer than three noisy pixels in the level2.evt file, extra rows are filled as -1
| Pixel properties | Quadrant properties | ||||||
|---|---|---|---|---|---|---|---|
| Quadrant | DetID | PixID | Counts | Sigma | Mean | Median | Sigma |
| A | 10 | 83 | 409543 | 3365.11 | 611 | 602 | 121.5 |
| A | 13 | 248 | 68857 | 561.66 | 611 | 602 | 121.5 |
| A | 13 | 6 | 12371 | 96.85 | 611 | 602 | 121.5 |
| B | 5 | 184 | 2166924 | 20734.86 | 559 | 546 | 104.5 |
| B | 5 | 172 | 139501 | 1329.97 | 559 | 546 | 104.5 |
| B | 0 | 183 | 65817 | 624.72 | 559 | 546 | 104.5 |
| C | 14 | 254 | 2082943 | 15759.13 | 579 | 584 | 132.1 |
| C | 15 | 214 | 203098 | 1532.61 | 579 | 584 | 132.1 |
| C | 1 | 23 | 81394 | 611.56 | 579 | 584 | 132.1 |
| D | 1 | 20 | 535656 | 3840.63 | 575 | 560 | 139.3 |
| D | 12 | 227 | 509325 | 3651.64 | 575 | 560 | 139.3 |
| D | 1 | 47 | 426675 | 3058.42 | 575 | 560 | 139.3 |
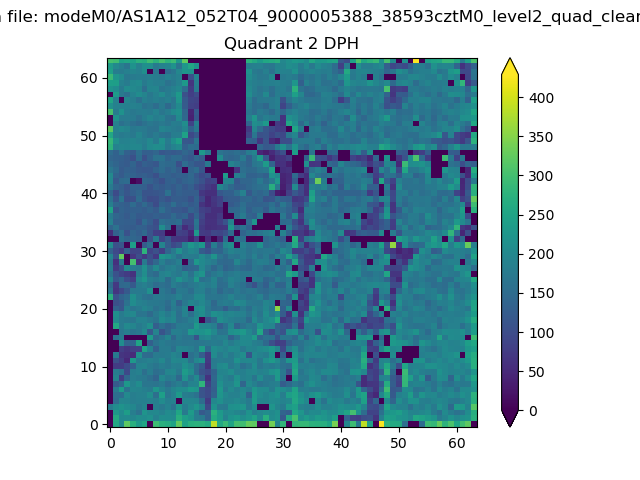
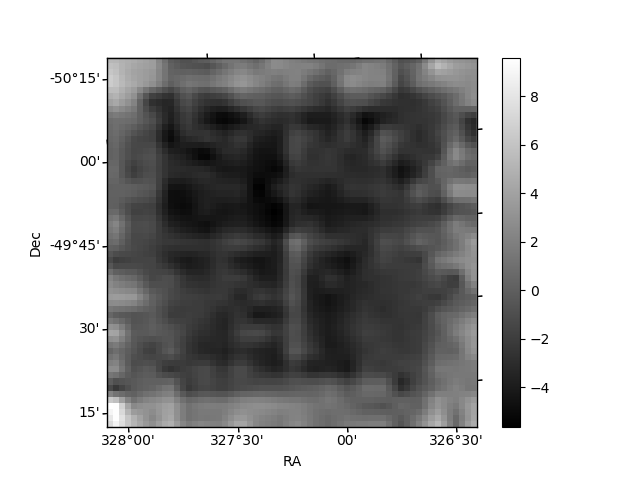
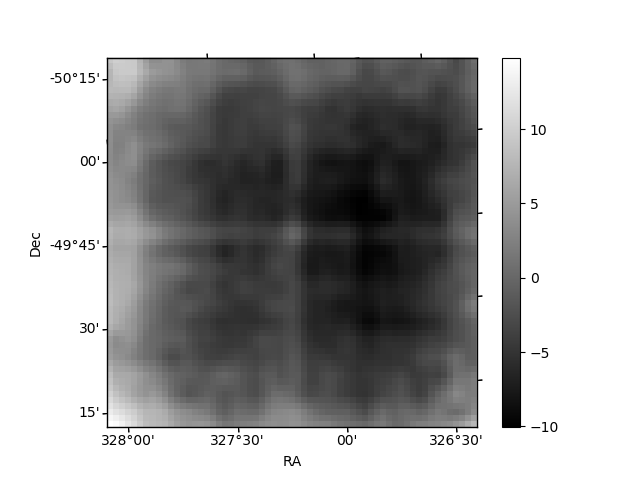
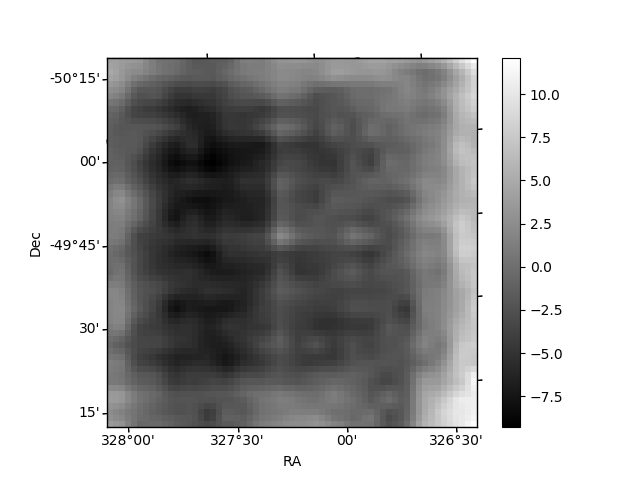
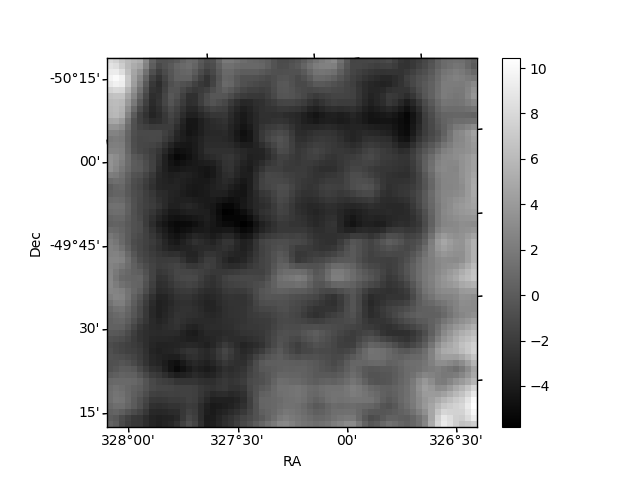
Histogram calculated using DETX and DETY for each event in the final _common_clean file
| Quadrant A | 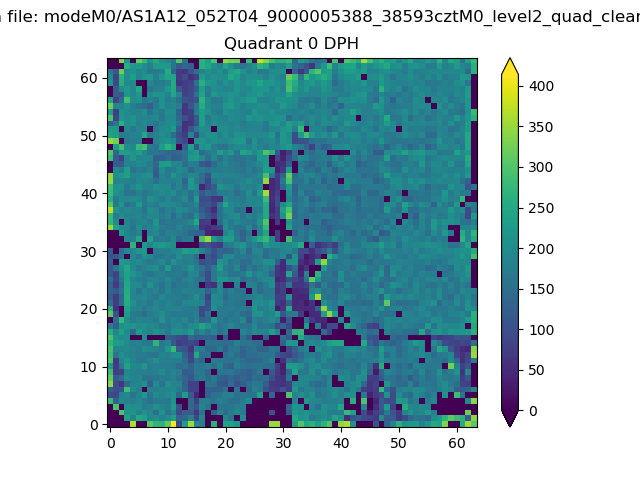 |
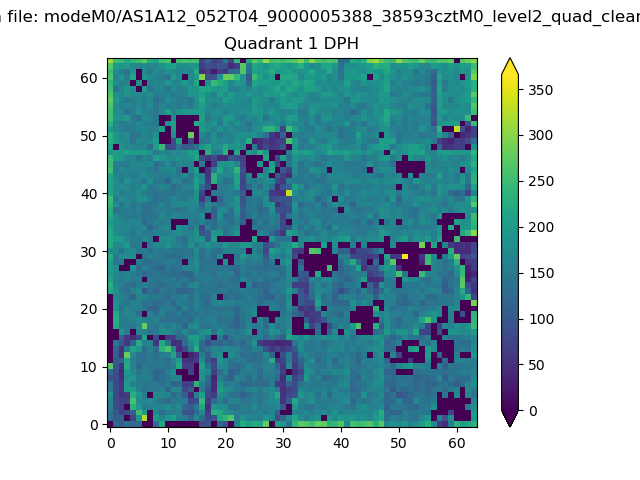 |
Quadrant B |
|---|---|---|---|
| Quadrant D | 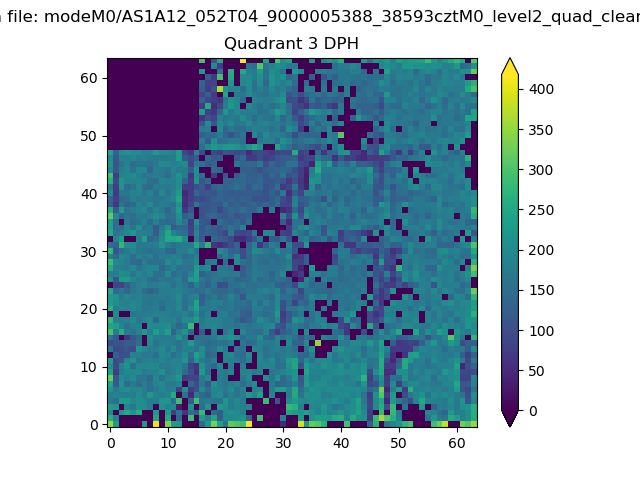 |
 |
Quadrant C |
| Plot type | Count rate plots | Images |
|---|---|---|
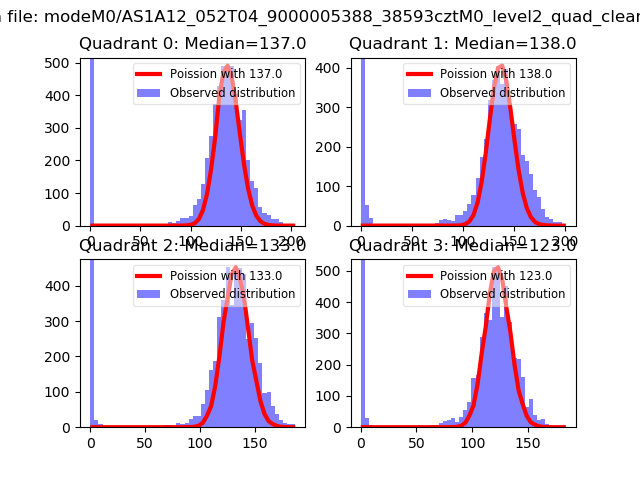
| Comparison with Poisson distribution Blue bars denote a histogram of data divided into 1 sec bins. Red curve is a Poisson curve with rate = median count rate of data. |
 |
 |
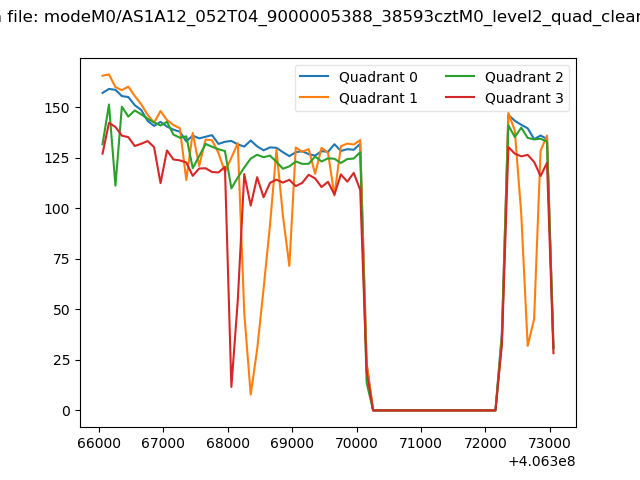
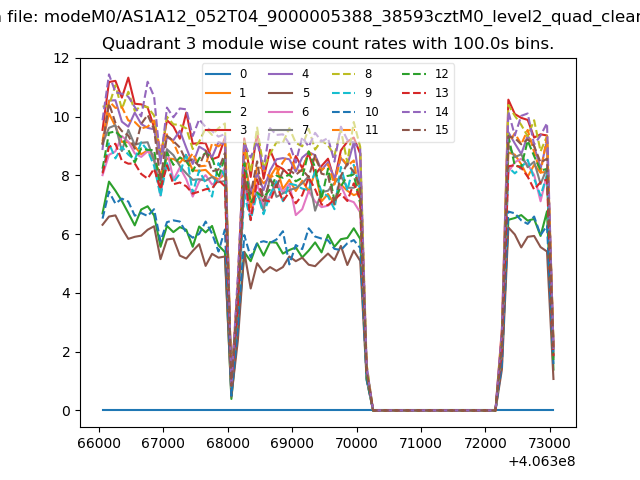
| Quadrant-wise count rates Data is divided into 100 sec bins |
 |
|
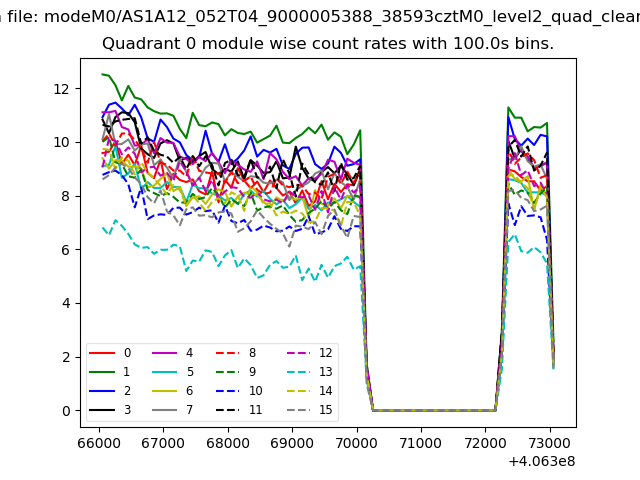
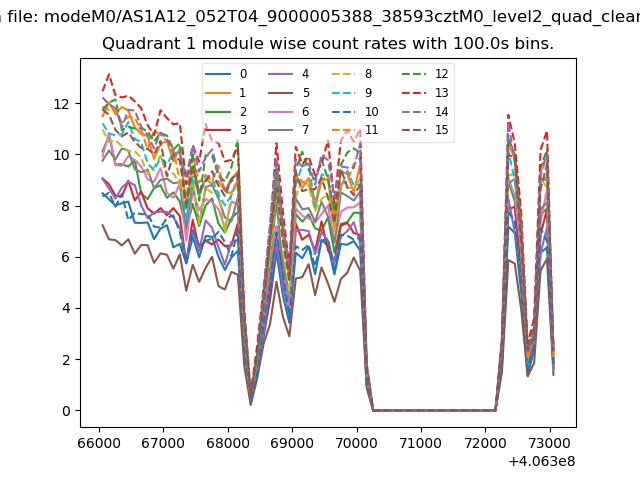
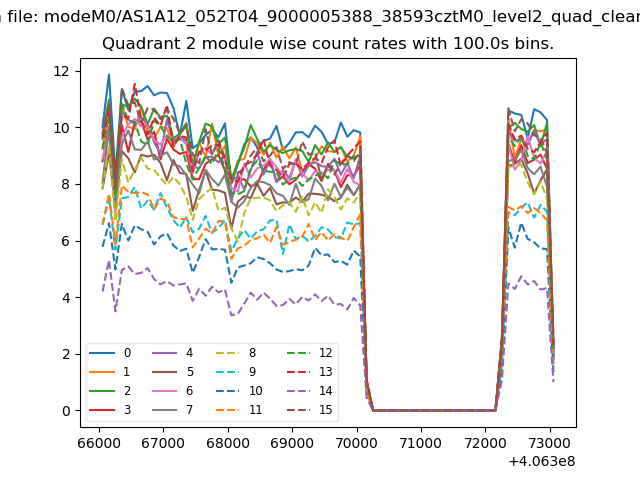
| Module-wise count rates for Quadrant A Data is divided into 100 sec bins |
 |
 |
| Module-wise count rates for Quadrant B Data is divided into 100 sec bins |
 |
 |
| Module-wise count rates for Quadrant C Data is divided into 100 sec bins |
 |
 |
| Module-wise count rates for Quadrant D Data is divided into 100 sec bins |
 |
 |
| Parameter | Plot |
|---|---|
| CZT HV Monitor | 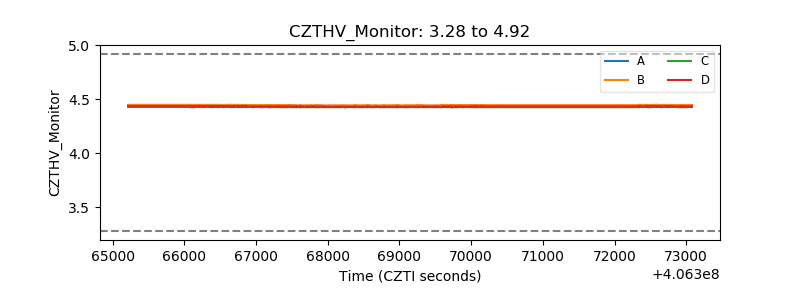 |
| D_VDD | 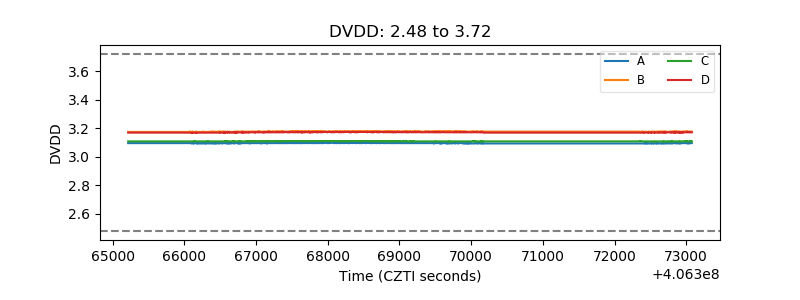 |
| Temperature 1 | 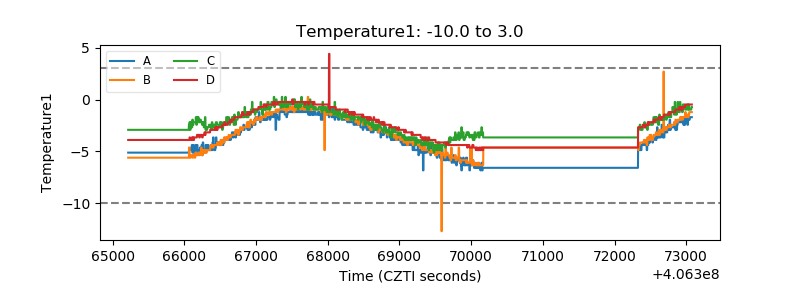 |
| Veto HV Monitor | 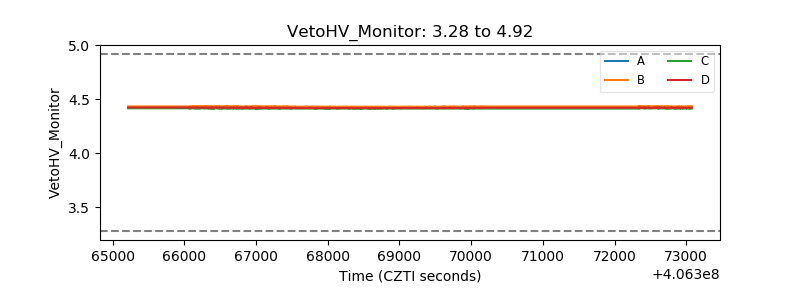 |
| Veto LLD | 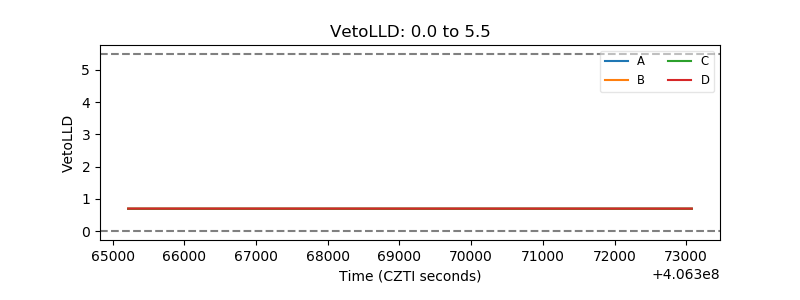 |
| Alpha Counter | 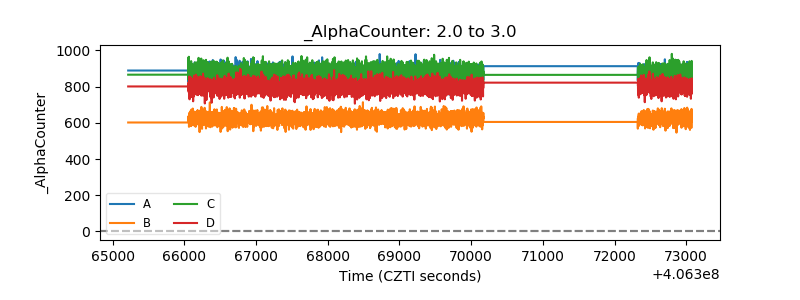 |
| _CPM_Rate |  |
| CZT Counter | 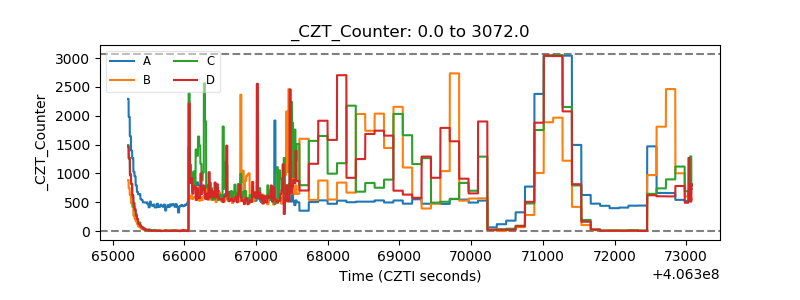 |
| +2.5 Volts monitor |  |
| +5 Volts monitor |  |
| _ROLL_ROT | 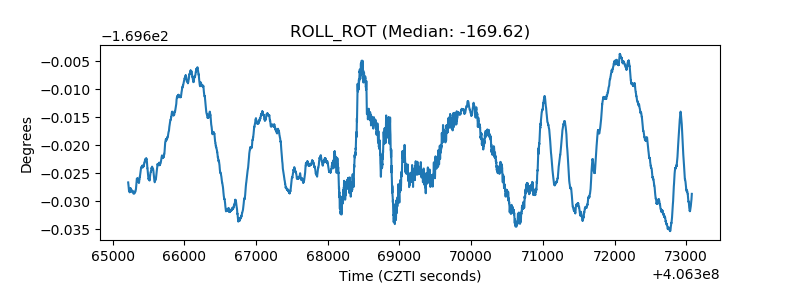 |
| _Roll_DEC | 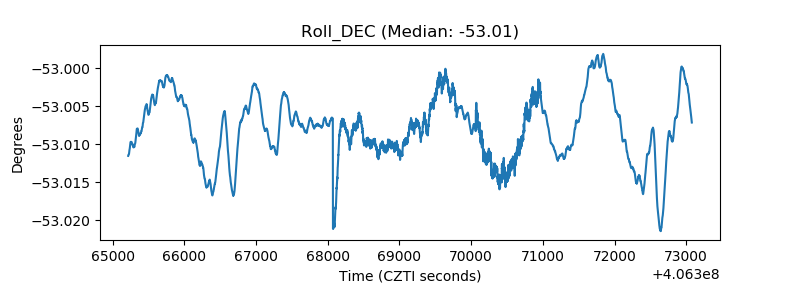 |
| _Roll_RA | 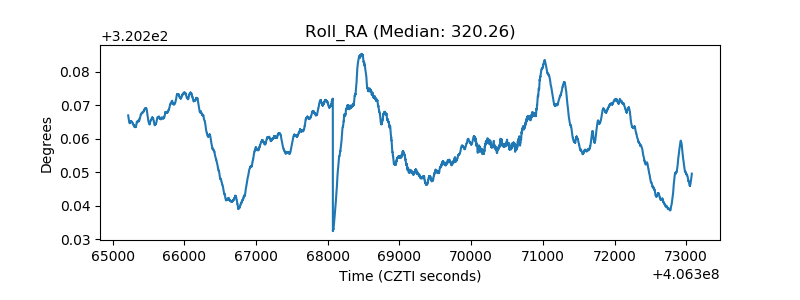 |
| Veto Counter | 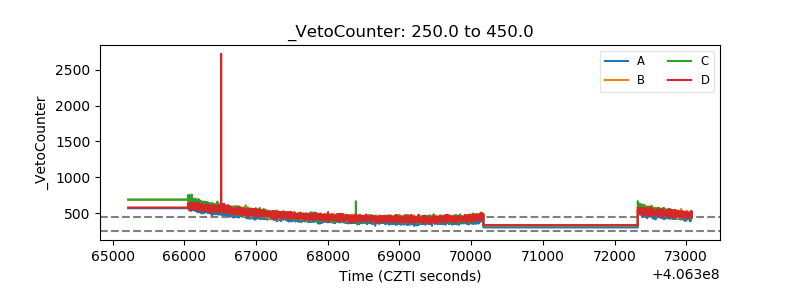 |