| Param | Original file | Final file |
|---|---|---|
| Filename | modeM0/AS1A12_052T04_9000005388_38594cztM0_level2.fits | modeM0/AS1A12_052T04_9000005388_38594cztM0_level2_quad_clean.evt |
| Size (bytes) | 470,692,800 | 92,966,400 |
| Size | 448.9 MB | 88.7 MB |
| Events in quadrant A | 2,938,165 | 665,152 |
| Events in quadrant B | 4,337,894 | 627,182 |
| Events in quadrant C | 3,319,878 | 642,730 |
| Events in quadrant D | 6,421,832 | 513,872 |
| Mode M0 | |||
|---|---|---|---|
| Quadrant | BADHDUFLAG | Total packets | Discarded packets |
| A | 0 | 11767 | 3 |
| B | 0 | 16319 | 2 |
| C | 0 | 13191 | 2 |
| D | 0 | 22752 | 2 |
| Mode SS | |||
|---|---|---|---|
| Quadrant | BADHDUFLAG | Total packets | Discarded packets |
| A | 0 | 106 | 0 |
| B | 0 | 106 | 0 |
| C | 0 | 106 | 0 |
| D | 0 | 106 | 0 |
| Mode M9 | |||
|---|---|---|---|
| Quadrant | BADHDUFLAG | Total packets | Discarded packets |
| A | 0 | 25 | 0 |
| B | 0 | 25 | 0 |
| C | 0 | 25 | 0 |
| D | 0 | 26 | 0 |
| Quadrant | Total seconds | Saturated seconds | Saturation percentage |
|---|---|---|---|
| A | 5228 | 14 | 0.267789% |
| B | 5228 | 484 | 9.257842% |
| C | 5228 | 81 | 1.549350% |
| D | 5228 | 965 | 18.458301% |
Noise dominated data is calculated using 1-second bins in cleaned event files. If a bin has >2000 counts, and if more than 50% of those come from <1% of pixels, then it is considered to be noise-dominated and hence unusable.
| Quadrant | # 1 sec bins | Bins with >0 counts | Bins with >2000 counts | High rate bins dominated by noise | Noise dominated (total time) | Noise dominated (detector-on time) | Marked lightcurve |
|---|---|---|---|---|---|---|---|
| A | 7350 | 5229 | 5 | 5 | 0.07% | 0.10% | 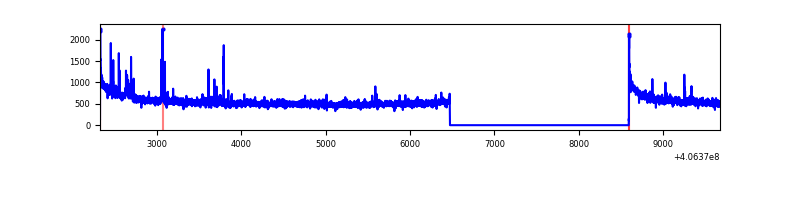 |
| B | 7350 | 5229 | 378 | 378 | 5.14% | 7.23% | 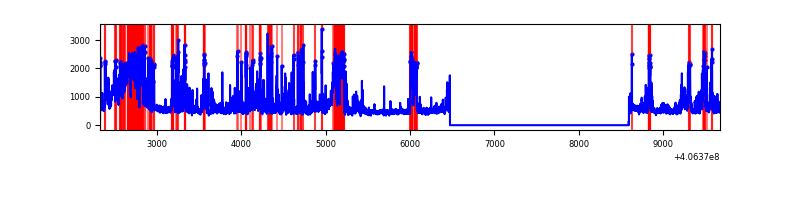 |
| C | 7350 | 5229 | 78 | 78 | 1.06% | 1.49% | 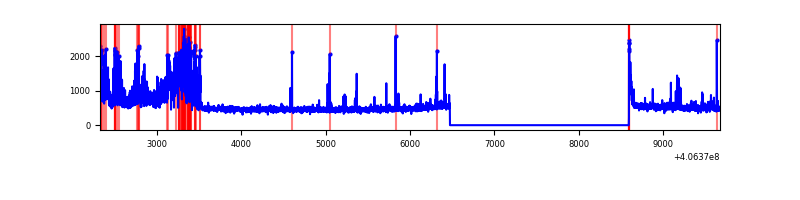 |
| D | 7350 | 5229 | 1027 | 1027 | 13.97% | 19.64% | 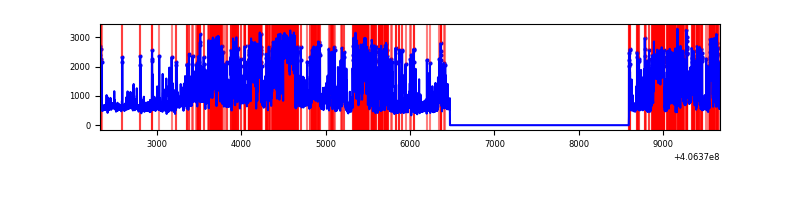 |
Top three noisy pixels from each quadrant. If the there are fewer than three noisy pixels in the level2.evt file, extra rows are filled as -1
| Pixel properties | Quadrant properties | ||||||
|---|---|---|---|---|---|---|---|
| Quadrant | DetID | PixID | Counts | Sigma | Mean | Median | Sigma |
| A | 10 | 83 | 432638 | 3446.86 | 622 | 611 | 125.3 |
| A | 13 | 248 | 58716 | 463.58 | 622 | 611 | 125.3 |
| A | 13 | 6 | 22238 | 172.55 | 622 | 611 | 125.3 |
| B | 5 | 184 | 1326342 | 11747.08 | 596 | 582 | 112.9 |
| B | 0 | 183 | 209084 | 1847.46 | 596 | 582 | 112.9 |
| B | 5 | 172 | 108761 | 958.54 | 596 | 582 | 112.9 |
| C | 14 | 254 | 691072 | 5019.61 | 593 | 596 | 137.6 |
| C | 15 | 214 | 217452 | 1576.5 | 593 | 596 | 137.6 |
| C | 0 | 10 | 66303 | 477.68 | 593 | 596 | 137.6 |
| D | 1 | 47 | 2855157 | 20776.32 | 561 | 546 | 137.4 |
| D | 12 | 235 | 379847 | 2760.61 | 561 | 546 | 137.4 |
| D | 2 | 249 | 280992 | 2041.13 | 561 | 546 | 137.4 |
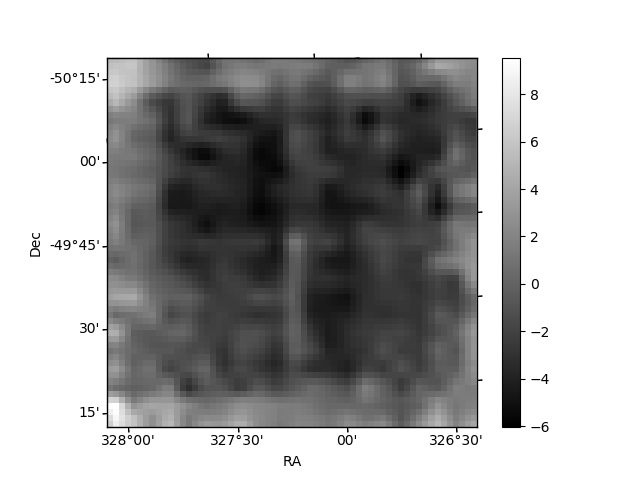
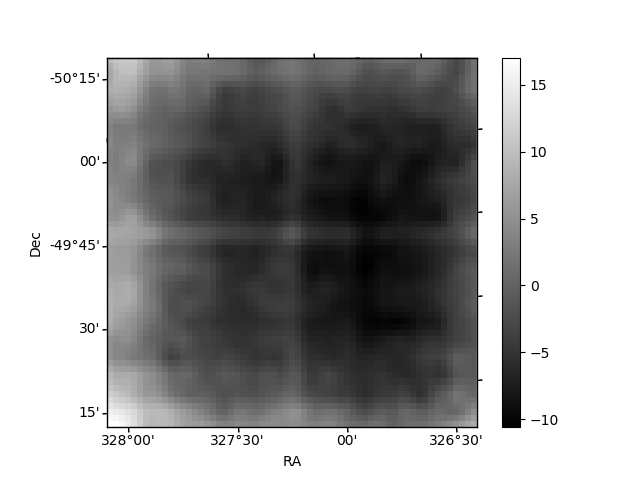
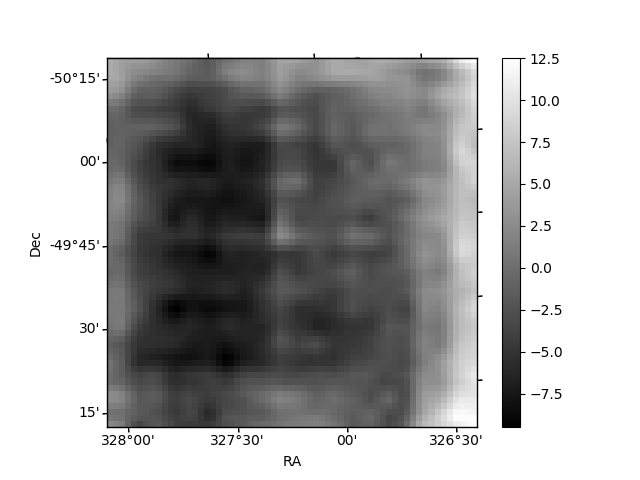
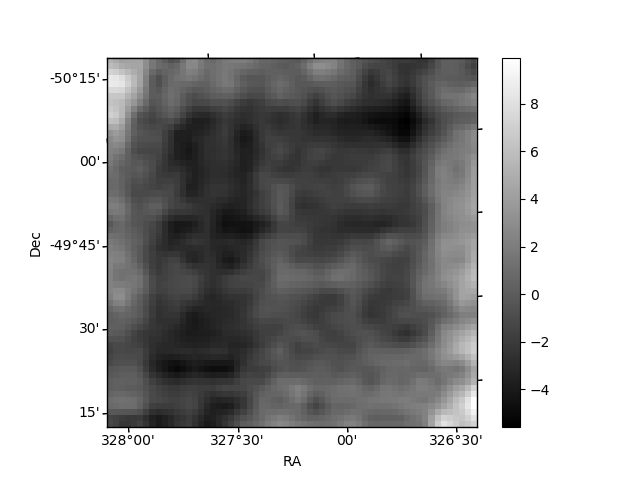
Histogram calculated using DETX and DETY for each event in the final _common_clean file
| Quadrant A | 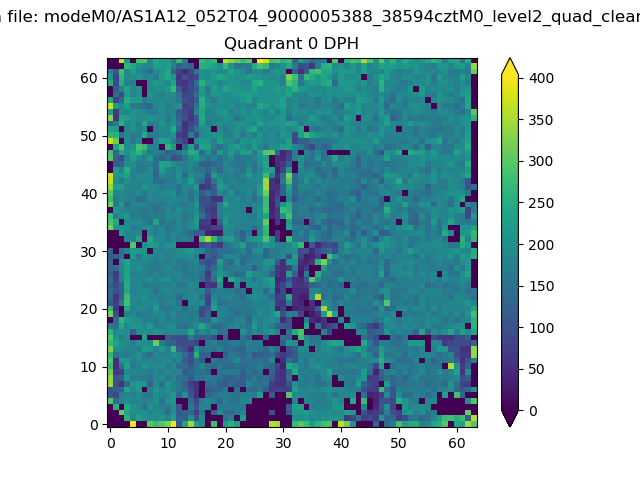 |
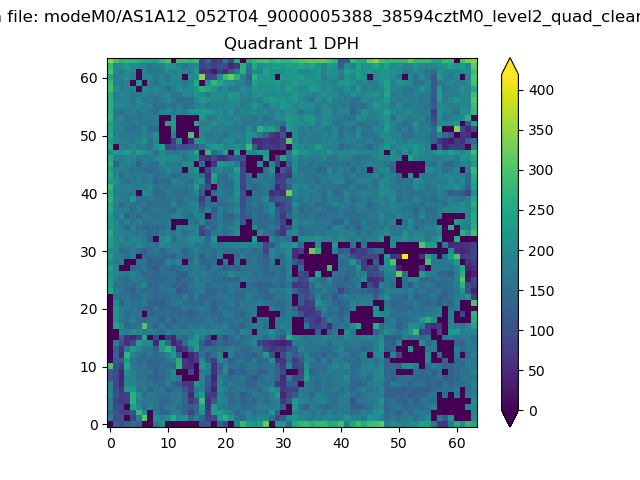 |
Quadrant B |
|---|---|---|---|
| Quadrant D | 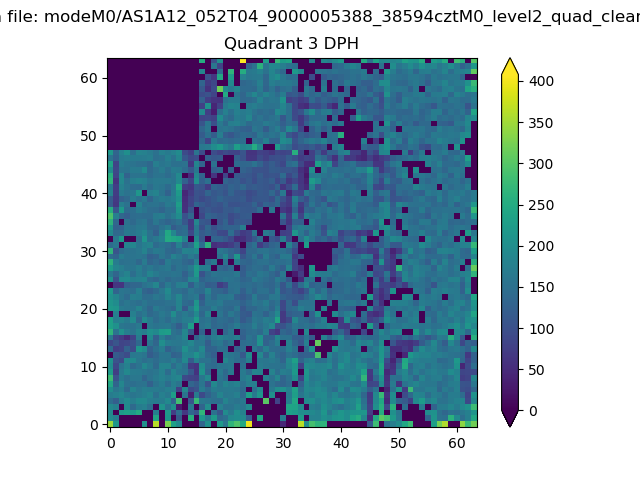 |
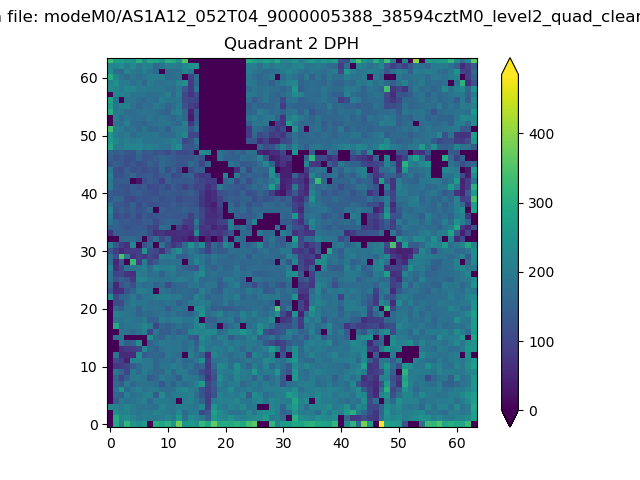 |
Quadrant C |
| Plot type | Count rate plots | Images |
|---|---|---|
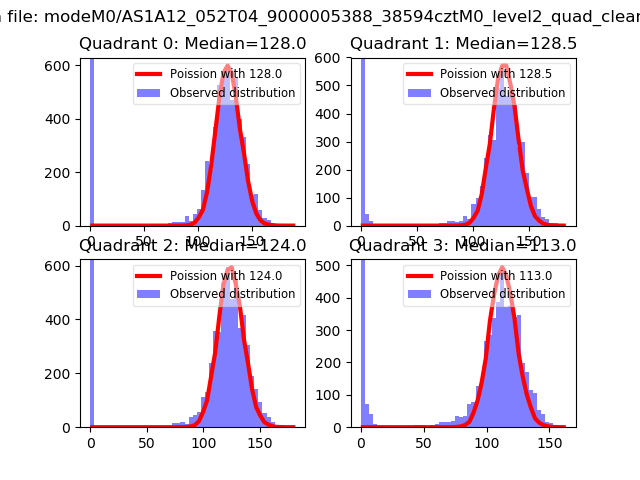
| Comparison with Poisson distribution Blue bars denote a histogram of data divided into 1 sec bins. Red curve is a Poisson curve with rate = median count rate of data. |
 |
 |
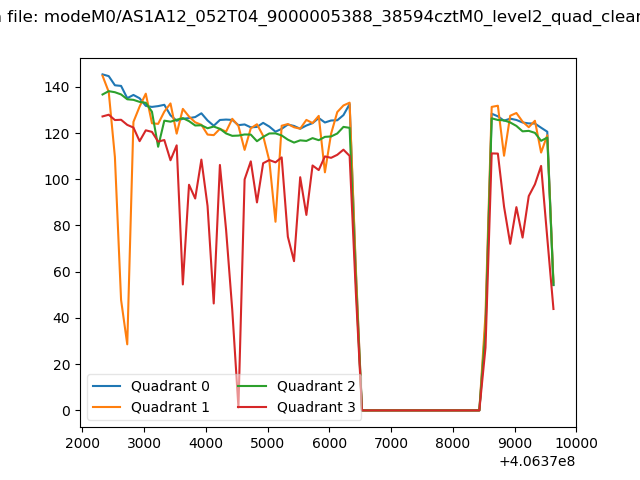
| Quadrant-wise count rates Data is divided into 100 sec bins |
 |
|
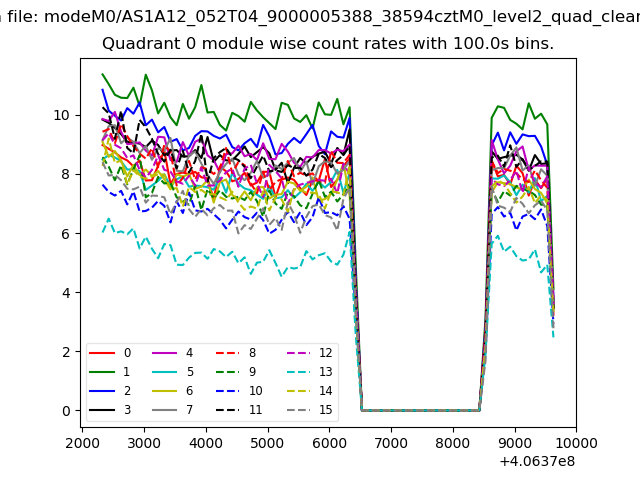
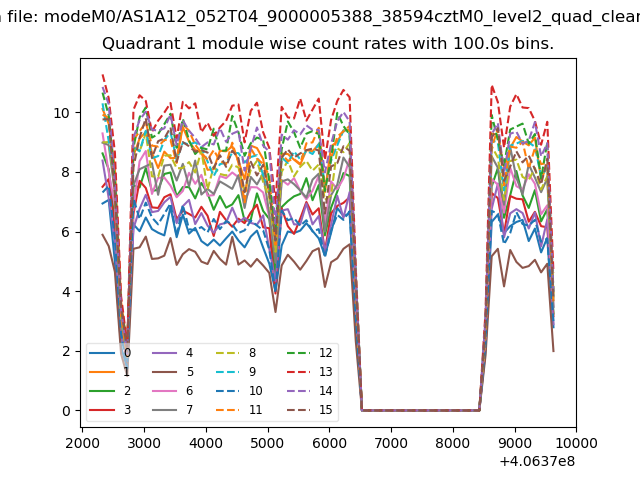
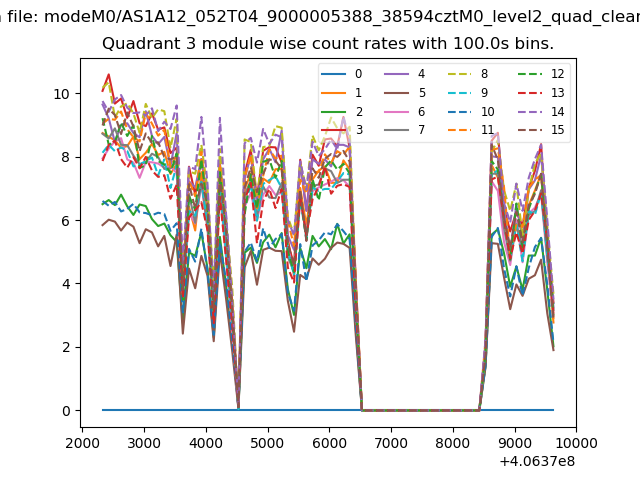
| Module-wise count rates for Quadrant A Data is divided into 100 sec bins |
 |
 |
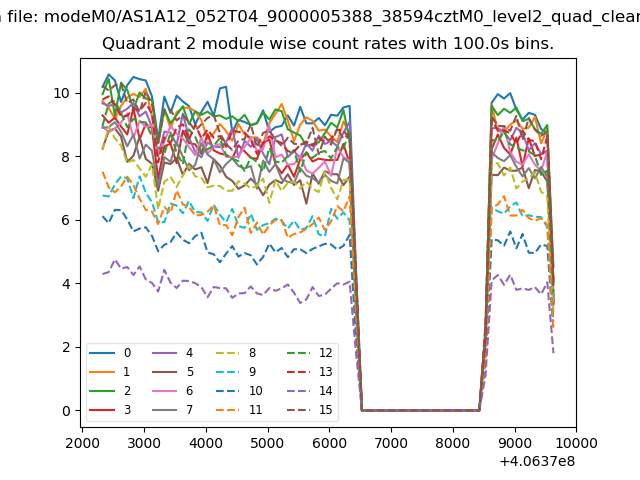
| Module-wise count rates for Quadrant B Data is divided into 100 sec bins |
 |
 |
| Module-wise count rates for Quadrant C Data is divided into 100 sec bins |
 |
 |
| Module-wise count rates for Quadrant D Data is divided into 100 sec bins |
 |
 |
| Parameter | Plot |
|---|---|
| CZT HV Monitor | 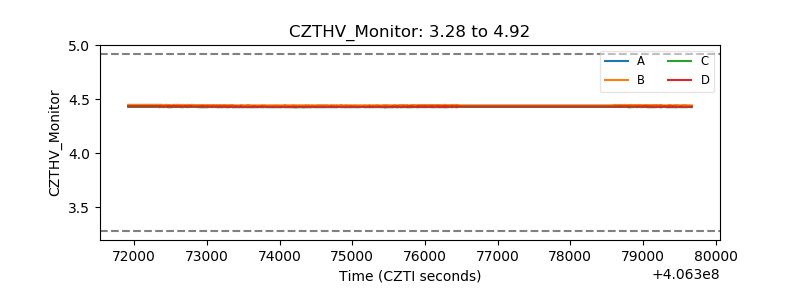 |
| D_VDD | 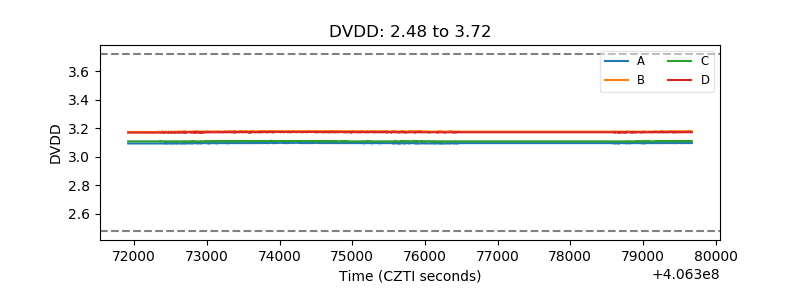 |
| Temperature 1 | 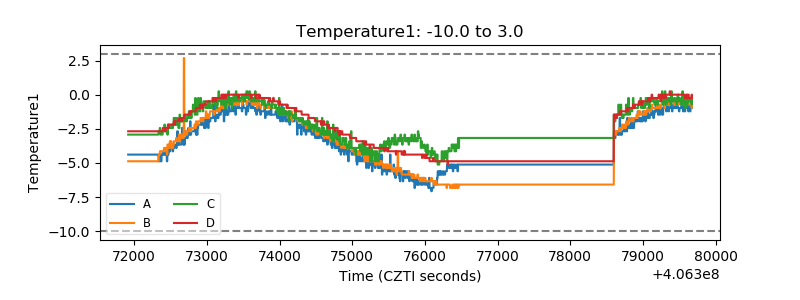 |
| Veto HV Monitor | 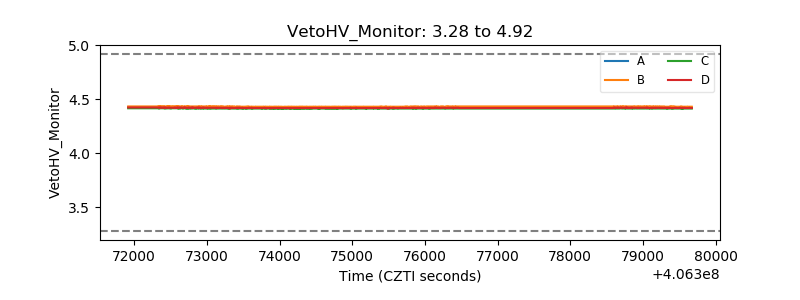 |
| Veto LLD | 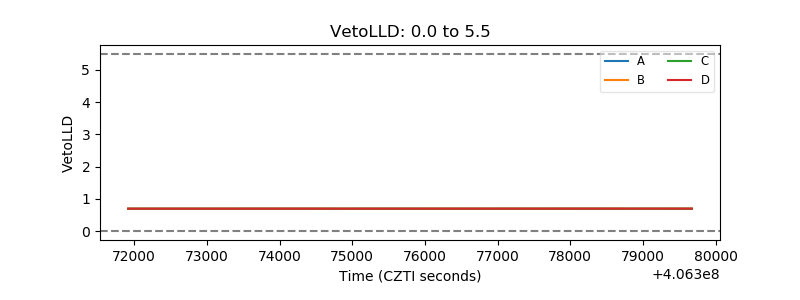 |
| Alpha Counter | 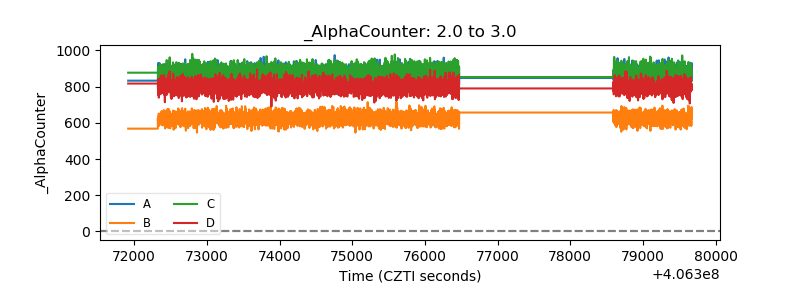 |
| _CPM_Rate | 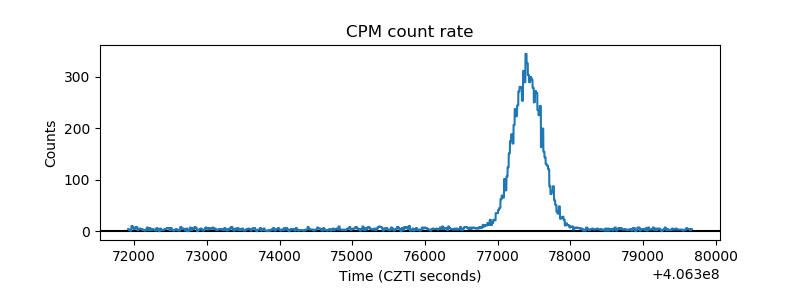 |
| CZT Counter | 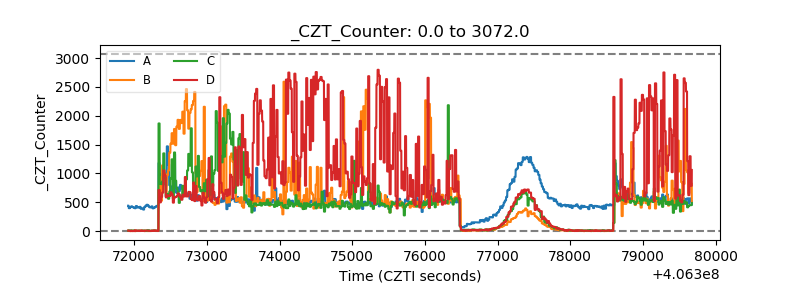 |
| +2.5 Volts monitor | 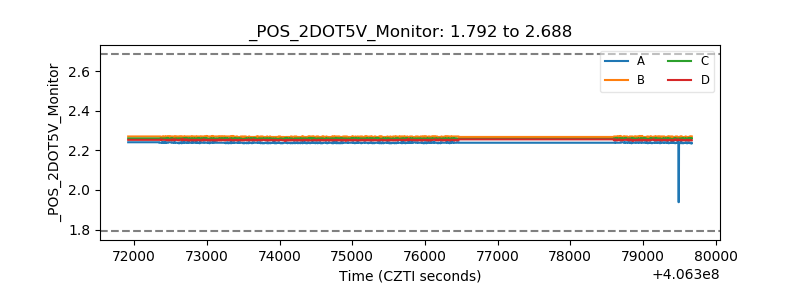 |
| +5 Volts monitor | 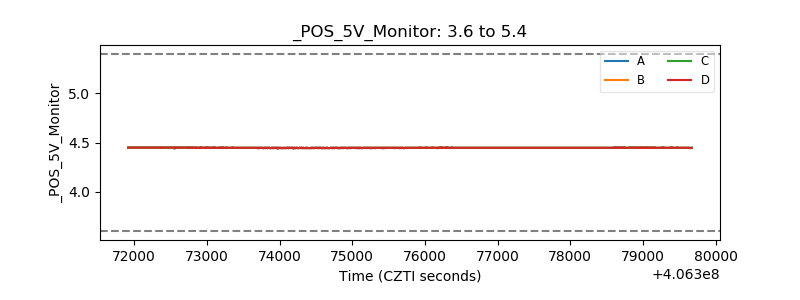 |
| _ROLL_ROT | 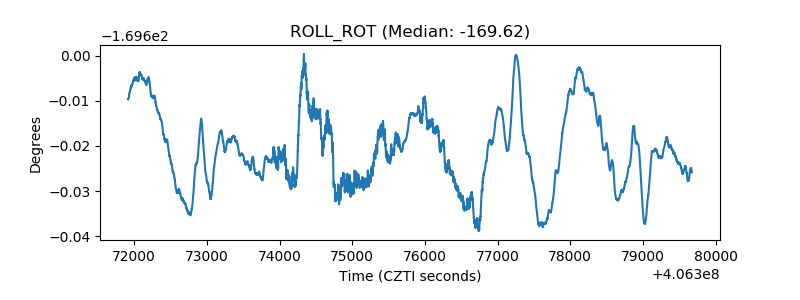 |
| _Roll_DEC | 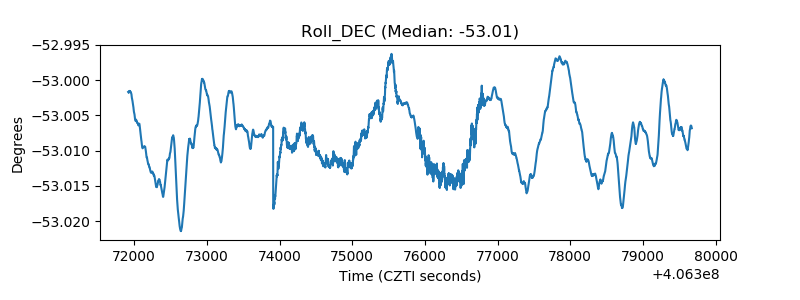 |
| _Roll_RA | 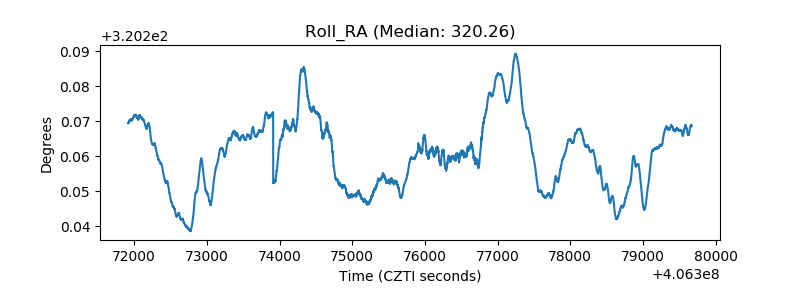 |
| Veto Counter | 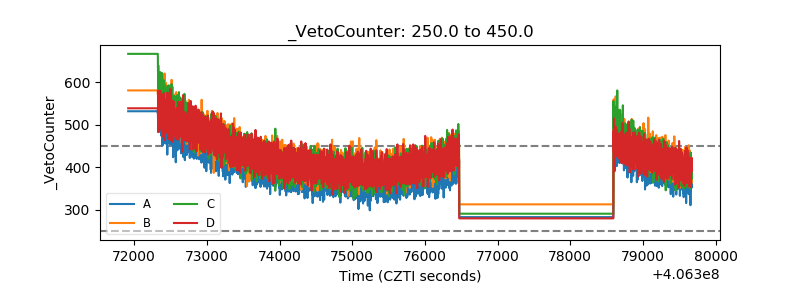 |