| Param | Original file | Final file |
|---|---|---|
| Filename | modeM0/AS1A12_052T04_9000005388_38595cztM0_level2.fits | modeM0/AS1A12_052T04_9000005388_38595cztM0_level2_quad_clean.evt |
| Size (bytes) | 441,103,680 | 90,918,720 |
| Size | 420.7 MB | 86.7 MB |
| Events in quadrant A | 2,955,075 | 647,517 |
| Events in quadrant B | 5,412,131 | 544,107 |
| Events in quadrant C | 2,822,307 | 624,561 |
| Events in quadrant D | 4,716,328 | 556,287 |
| Mode M0 | |||
|---|---|---|---|
| Quadrant | BADHDUFLAG | Total packets | Discarded packets |
| A | 0 | 11986 | 3 |
| B | 0 | 19769 | 2 |
| C | 0 | 11803 | 2 |
| D | 0 | 17755 | 2 |
| Mode SS | |||
|---|---|---|---|
| Quadrant | BADHDUFLAG | Total packets | Discarded packets |
| A | 0 | 112 | 0 |
| B | 0 | 112 | 0 |
| C | 0 | 112 | 0 |
| D | 0 | 112 | 0 |
| Mode M9 | |||
|---|---|---|---|
| Quadrant | BADHDUFLAG | Total packets | Discarded packets |
| A | 0 | 20 | 0 |
| B | 0 | 20 | 0 |
| C | 0 | 20 | 0 |
| D | 0 | 21 | 0 |
| Quadrant | Total seconds | Saturated seconds | Saturation percentage |
|---|---|---|---|
| A | 5431 | 20 | 0.368256% |
| B | 5431 | 1059 | 19.499171% |
| C | 5431 | 31 | 0.570797% |
| D | 5431 | 372 | 6.849567% |
Noise dominated data is calculated using 1-second bins in cleaned event files. If a bin has >2000 counts, and if more than 50% of those come from <1% of pixels, then it is considered to be noise-dominated and hence unusable.
| Quadrant | # 1 sec bins | Bins with >0 counts | Bins with >2000 counts | High rate bins dominated by noise | Noise dominated (total time) | Noise dominated (detector-on time) | Marked lightcurve |
|---|---|---|---|---|---|---|---|
| A | 7342 | 5432 | 13 | 13 | 0.18% | 0.24% | 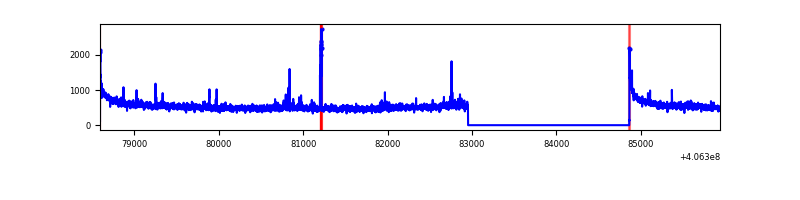 |
| B | 7342 | 5432 | 883 | 883 | 12.03% | 16.26% | 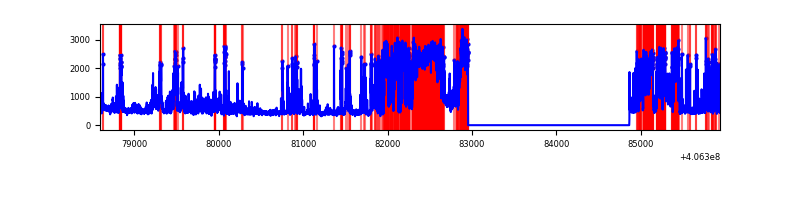 |
| C | 7342 | 5432 | 29 | 29 | 0.39% | 0.53% | 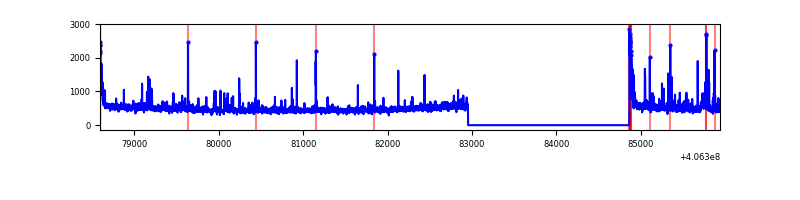 |
| D | 7342 | 5432 | 383 | 383 | 5.22% | 7.05% | 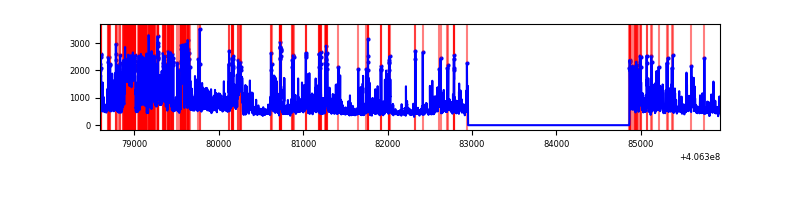 |
Top three noisy pixels from each quadrant. If the there are fewer than three noisy pixels in the level2.evt file, extra rows are filled as -1
| Pixel properties | Quadrant properties | ||||||
|---|---|---|---|---|---|---|---|
| Quadrant | DetID | PixID | Counts | Sigma | Mean | Median | Sigma |
| A | 10 | 83 | 453793 | 3646.02 | 615 | 603 | 124.3 |
| A | 13 | 248 | 59973 | 477.65 | 615 | 603 | 124.3 |
| A | 15 | 174 | 29210 | 230.15 | 615 | 603 | 124.3 |
| B | 5 | 184 | 2512296 | 24432.32 | 544 | 532 | 102.8 |
| B | 5 | 172 | 278504 | 2703.87 | 544 | 532 | 102.8 |
| B | 0 | 183 | 134365 | 1301.81 | 544 | 532 | 102.8 |
| C | 15 | 214 | 225240 | 1647.01 | 589 | 592 | 136.4 |
| C | 14 | 254 | 124456 | 908.11 | 589 | 592 | 136.4 |
| C | 0 | 10 | 94126 | 685.75 | 589 | 592 | 136.4 |
| D | 1 | 47 | 1476930 | 10449.48 | 581 | 564 | 141.3 |
| D | 12 | 235 | 242594 | 1713.05 | 581 | 564 | 141.3 |
| D | 2 | 250 | 165618 | 1168.23 | 581 | 564 | 141.3 |
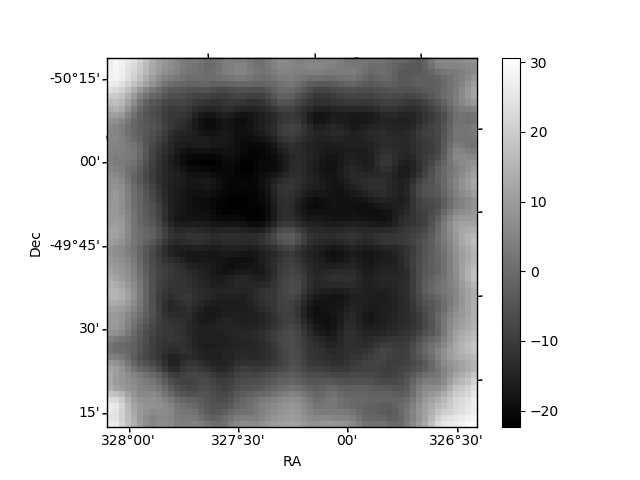
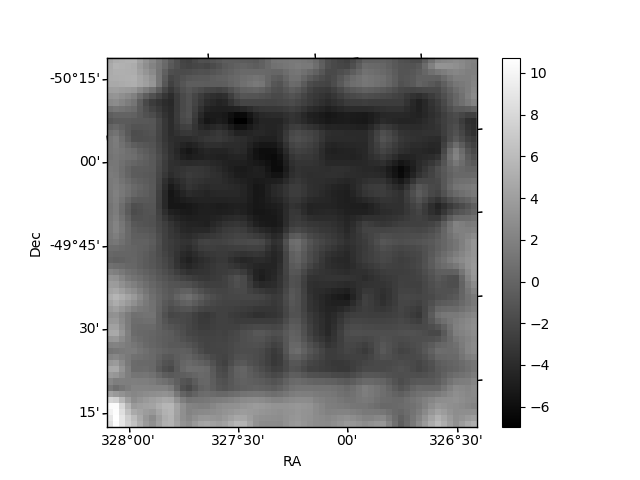
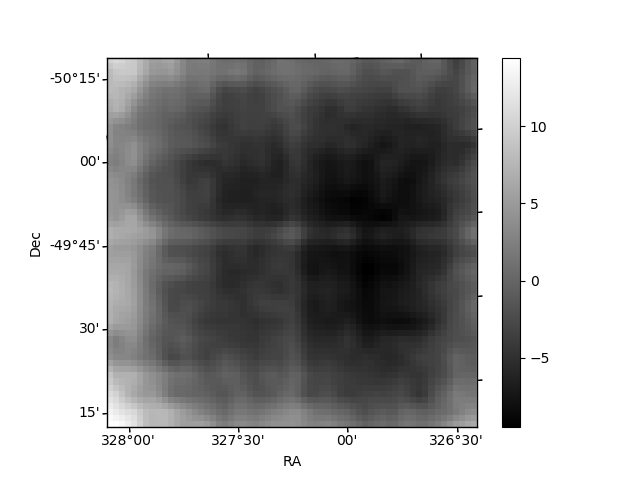
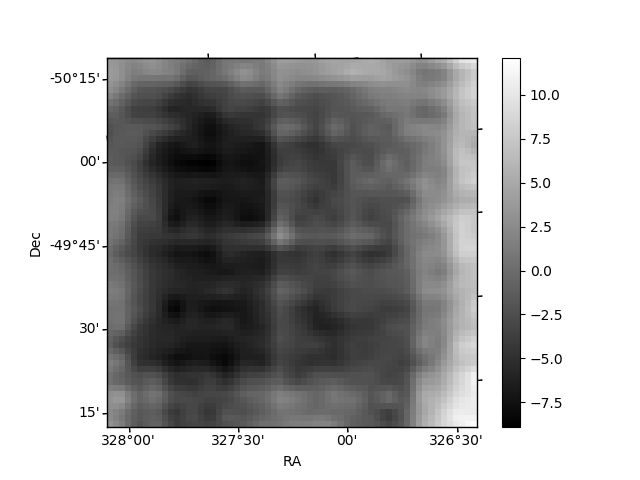
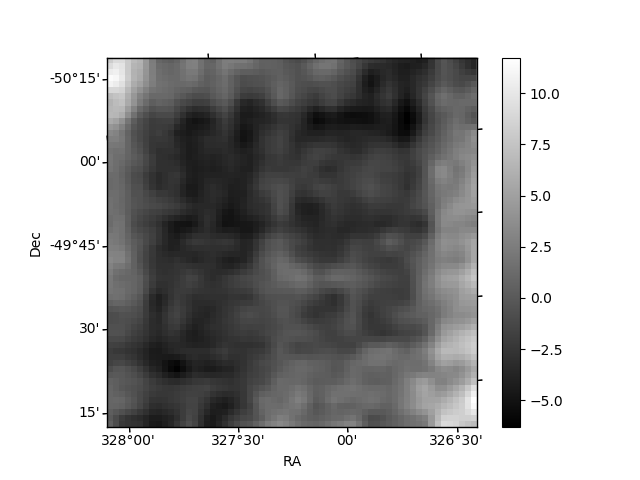
Histogram calculated using DETX and DETY for each event in the final _common_clean file
| Quadrant A | 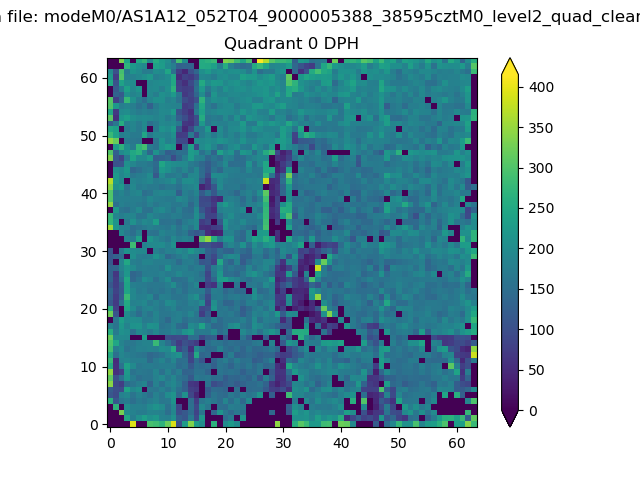 |
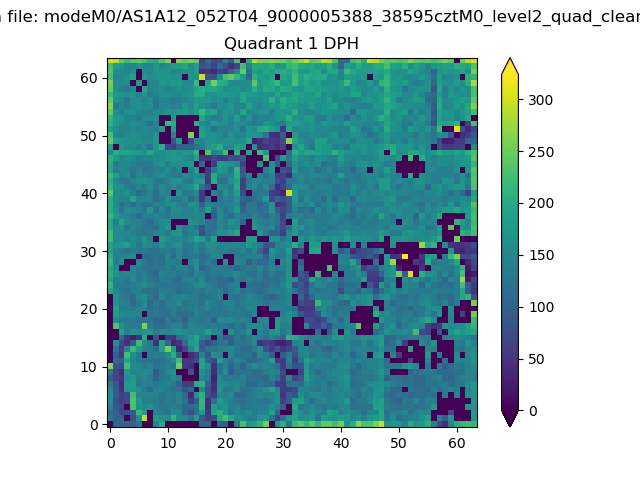 |
Quadrant B |
|---|---|---|---|
| Quadrant D | 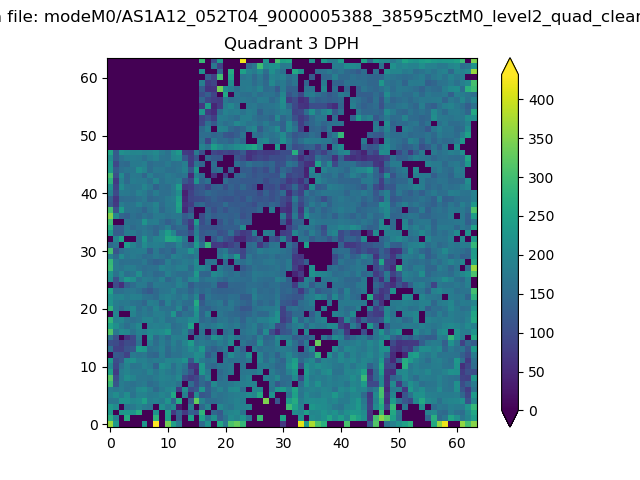 |
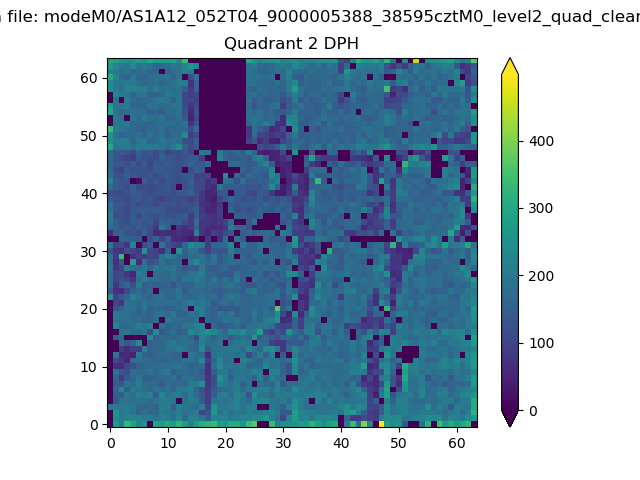 |
Quadrant C |
| Plot type | Count rate plots | Images |
|---|---|---|
| Comparison with Poisson distribution Blue bars denote a histogram of data divided into 1 sec bins. Red curve is a Poisson curve with rate = median count rate of data. |
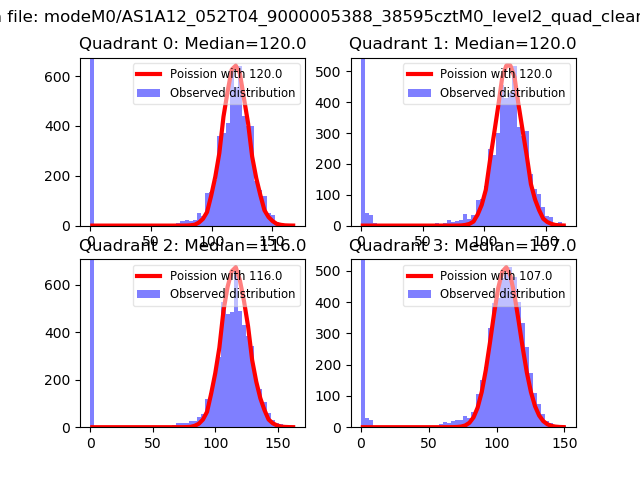 |
 |
| Quadrant-wise count rates Data is divided into 100 sec bins |
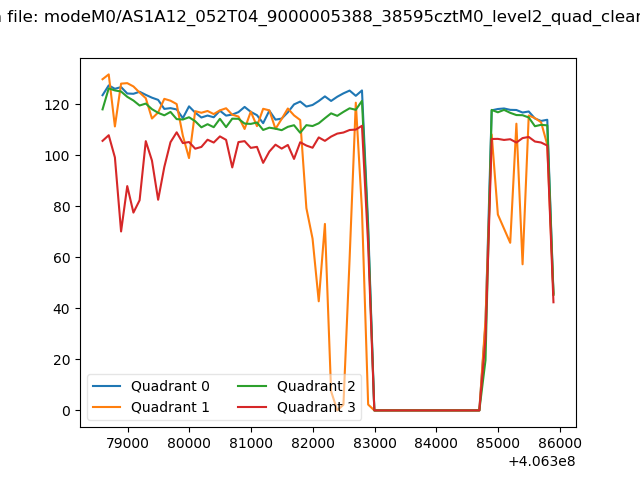 |
|
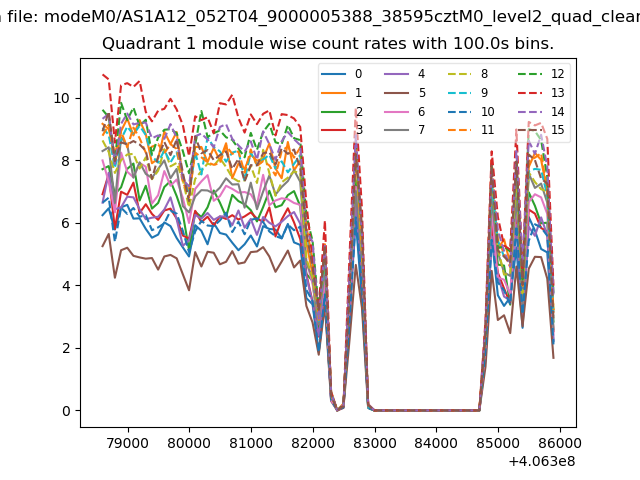
| Module-wise count rates for Quadrant A Data is divided into 100 sec bins |
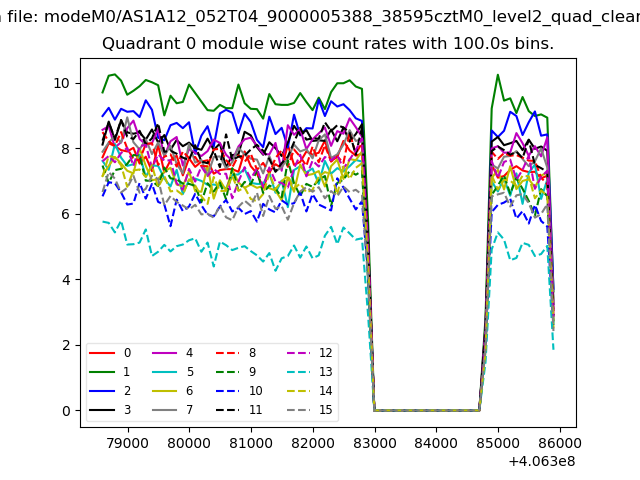 |
 |
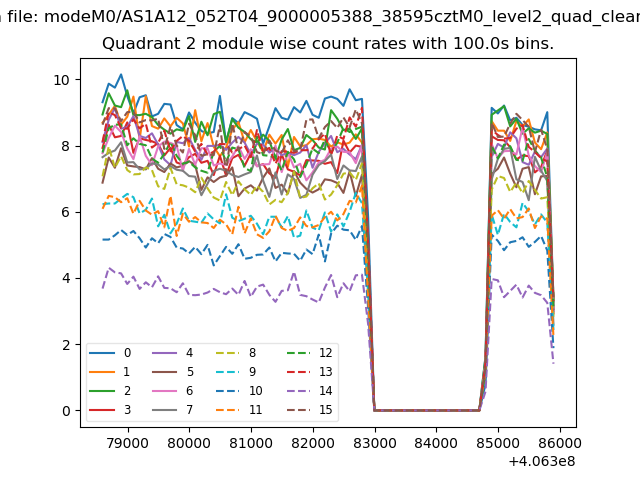
| Module-wise count rates for Quadrant B Data is divided into 100 sec bins |
 |
 |
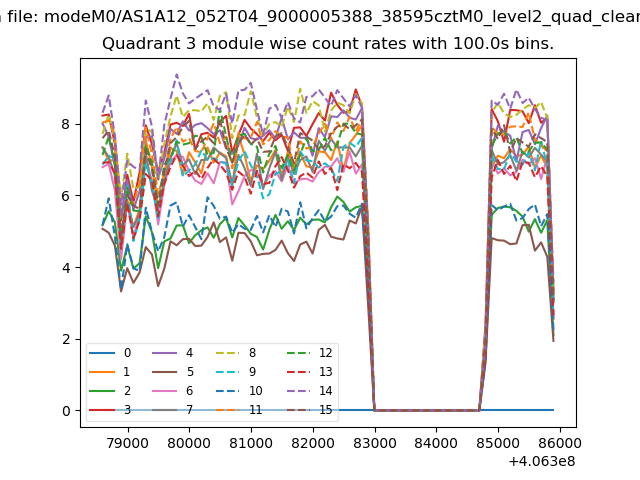
| Module-wise count rates for Quadrant C Data is divided into 100 sec bins |
 |
 |
| Module-wise count rates for Quadrant D Data is divided into 100 sec bins |
 |
 |
| Parameter | Plot |
|---|---|
| CZT HV Monitor |  |
| D_VDD | 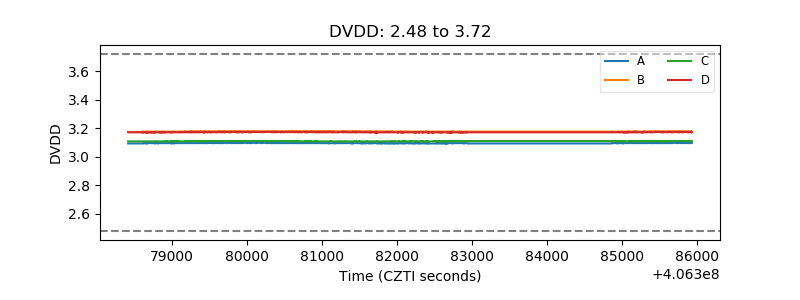 |
| Temperature 1 | 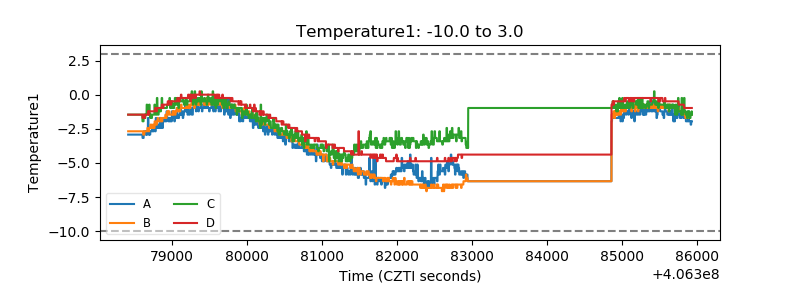 |
| Veto HV Monitor | 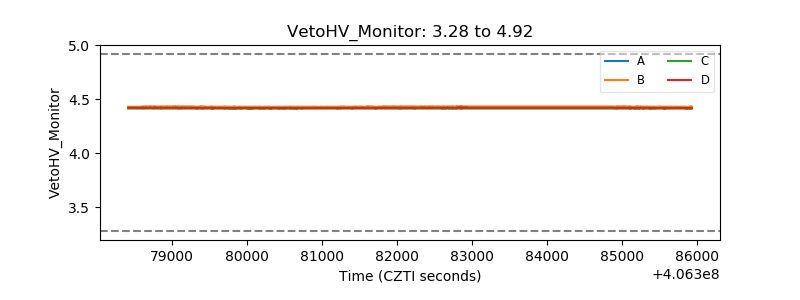 |
| Veto LLD | 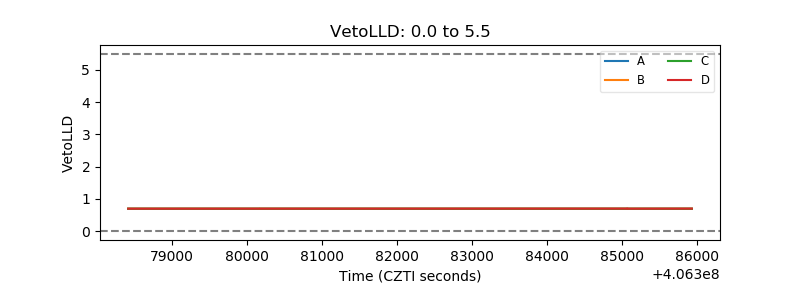 |
| Alpha Counter | 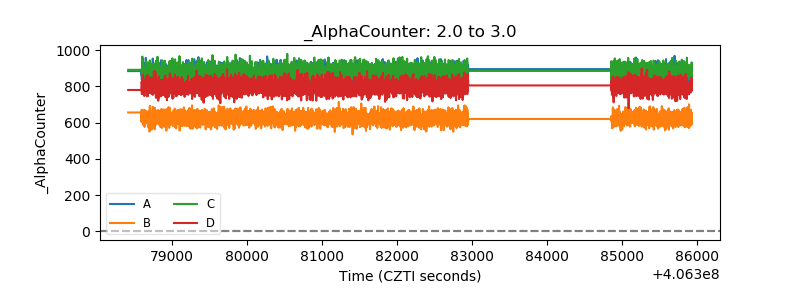 |
| _CPM_Rate | 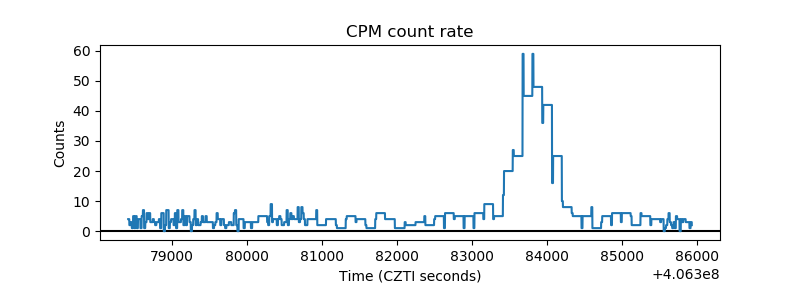 |
| CZT Counter | 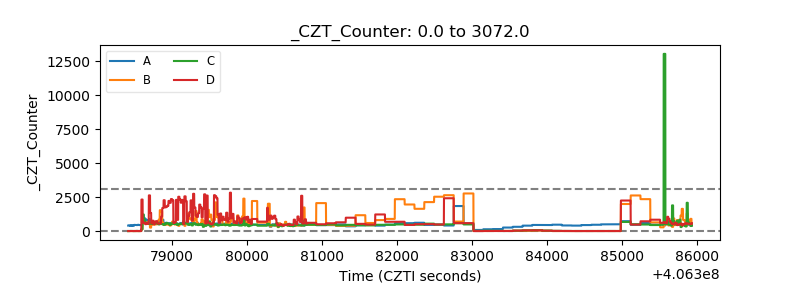 |
| +2.5 Volts monitor | 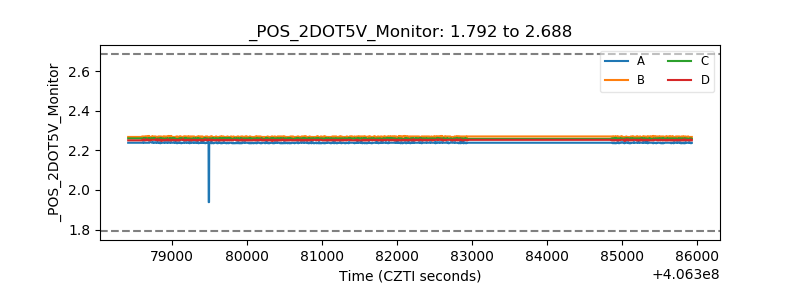 |
| +5 Volts monitor | 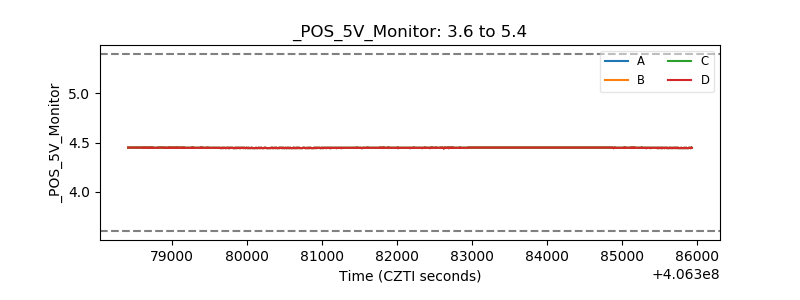 |
| _ROLL_ROT | 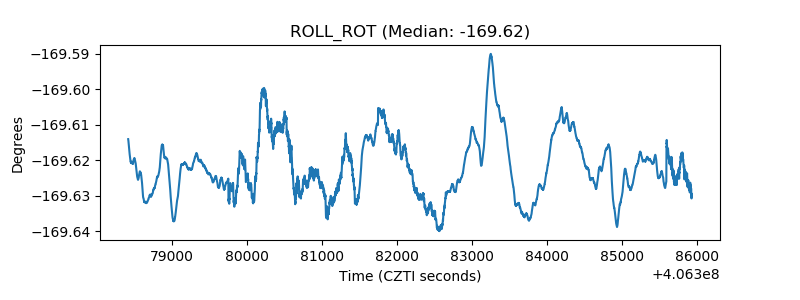 |
| _Roll_DEC | 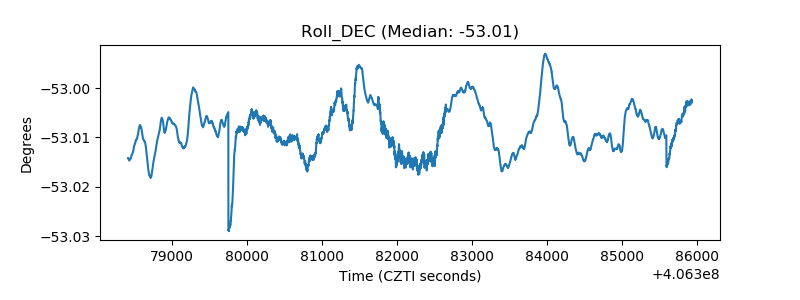 |
| _Roll_RA | 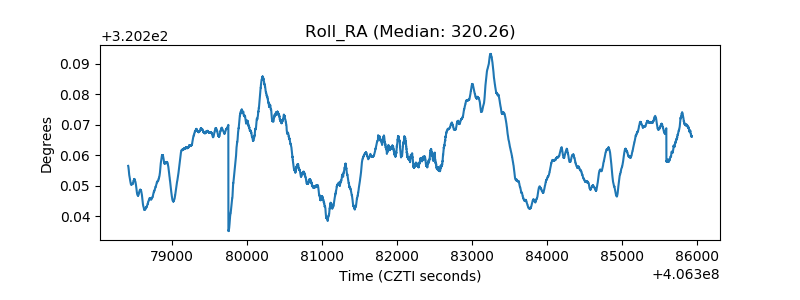 |
| Veto Counter | 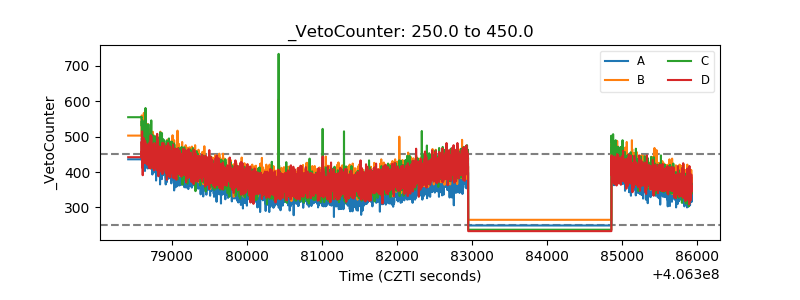 |